Downloaded 270 times


![8-18
Comparative Scaling Techniques
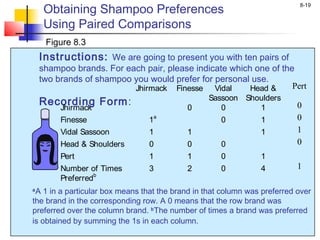
Paired Comparison Scaling
A respondent is presented with two objects and
asked to select one according to some criterion.
The data obtained are ordinal in nature.
Paired comparison scaling is the most widely used
comparative scaling technique.
With n brands, [n(n - 1) /2] paired comparisons are
required
Under the assumption of transitivity, it is possible to
convert paired comparison data to a rank order.](https://image.slidesharecdn.com/marketingresearchch8malhotra-140725015120-phpapp02/85/Marketing-research-ch-8_malhotra-18-320.jpg)


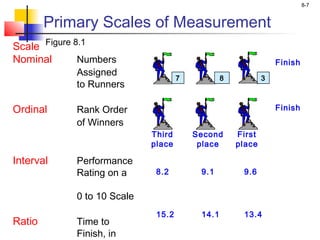
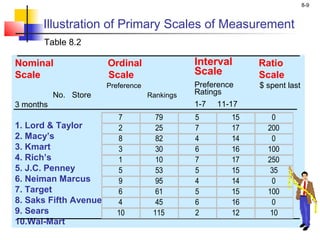
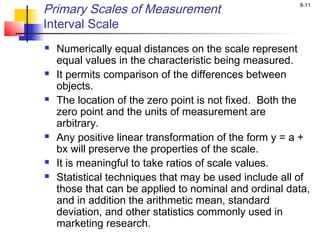
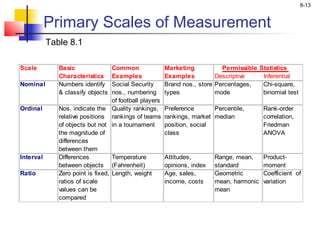
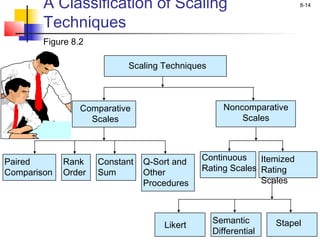
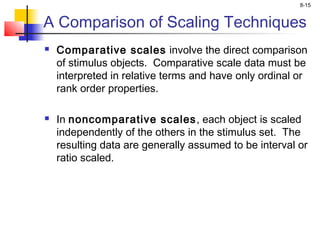
This chapter discusses different methods of measurement and scaling used in marketing research. It describes four primary scales of measurement - nominal, ordinal, interval, and ratio scales - and explains their characteristics. Comparative scaling techniques like paired comparisons, rank ordering, and constant sum scaling are presented, which involve direct comparisons between objects. Noncomparative scales that measure objects independently are also covered. The chapter provides examples to illustrate different scaling methods and their applications in marketing research.