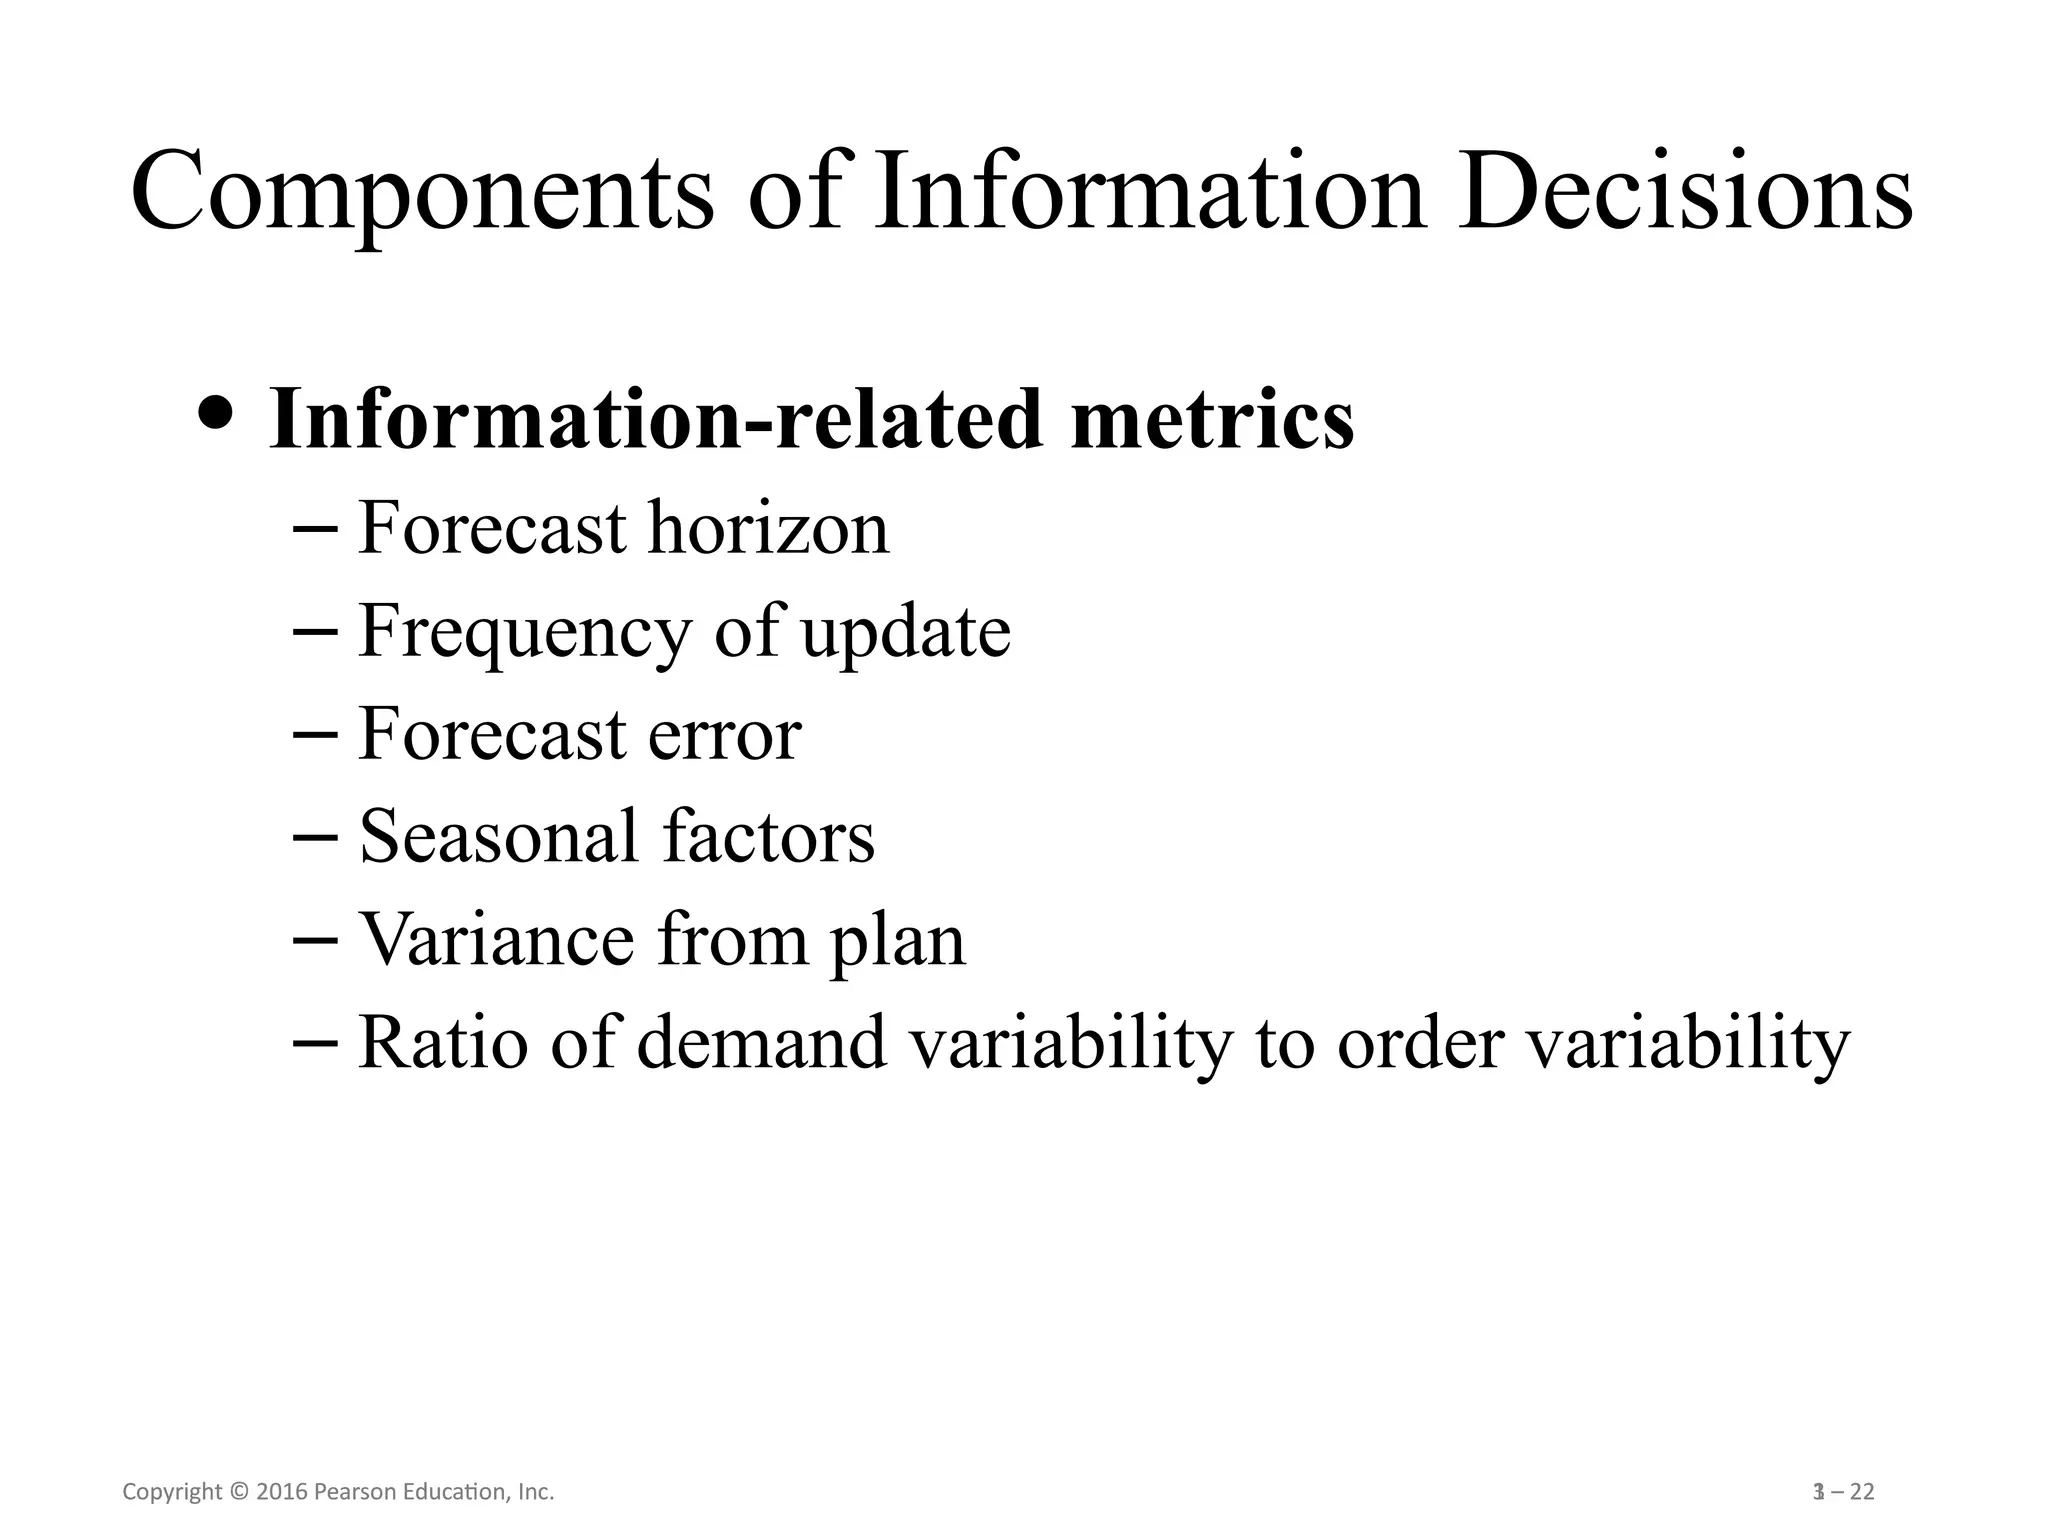
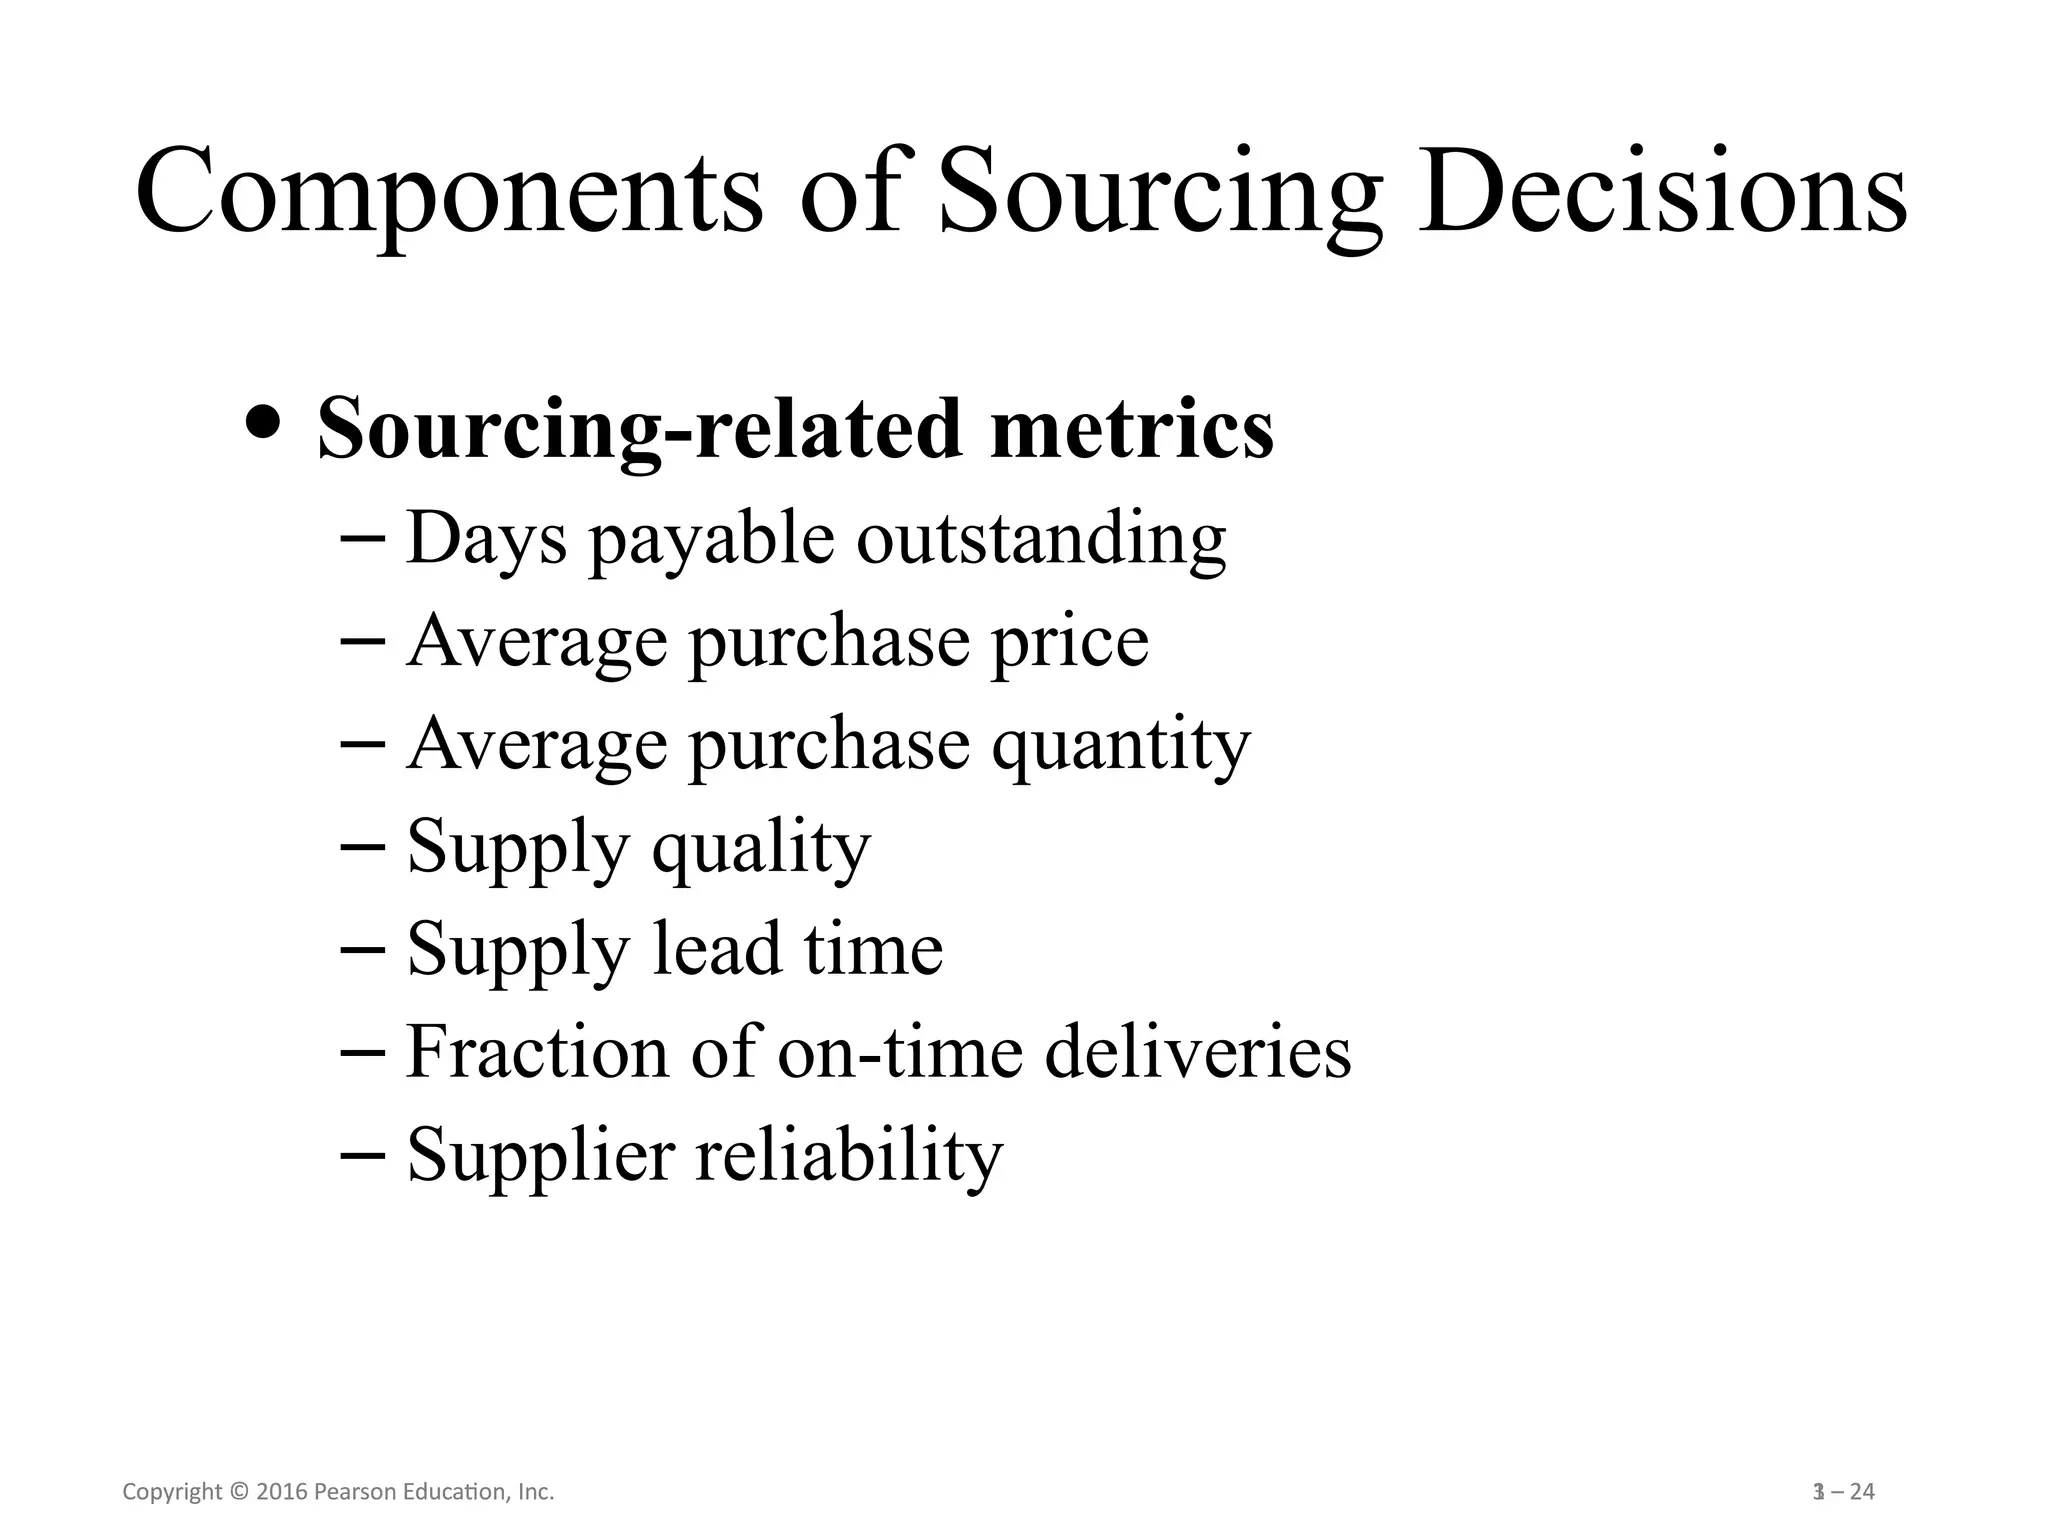
Copyright © 2016 Pearson Education, Inc. 1 – 1
Copyright © 2016 Pearson Education, Inc. 3 – 1
PowerPoint presentation
to accompany
Chopra and Meindl
Supply Chain Management, 6e
PowerPoint presentation
to accompany
Chopra and Meindl
Supply Chain Management, 6e
3 Supply Chain Drivers
and Metrics
Copyright © 2016 Pearson Education, Inc. 1 – 2
Copyright © 2016 Pearson Education, Inc. 3 – 2
Starting
• The strategic fit requires that a company's supply
chain achieve the balance between
responsiveness and efficiency that best meets the
needs of the company's competitive strategy. To
understand how a company can improve supply
chain performance in terms of responsiveness and
efficiency, we must examine the logistical and
cross- functional drivers of supply chain
performance: facilities, inventory, transportation,
information, sourcing, and pricing.
Copyright © 2016 Pearson Education, Inc. 1 – 3
Copyright © 2016 Pearson Education, Inc. 3 – 3
1-3
Drivers of Supply Chain Performance
Logistical Drivers
• Facilities ( location)
– places where inventory is stored, assembled (put together), or fabricated
– production sites and storage sites, e.g. several stores for responsiveness, e.g. auto- parts
distributor different location to satisfy their customer's demand
• Inventory
– raw materials, finished goods within a supply chain
– inventory policies e.g. clothing retailer by stock the product(large inventory) to satisfy
the customer demand and increase responsive and the opposite, smaller inventory,
increase efficiency, clothing retailers
• Transportation
– moving inventory from point to point in a supply chain transportation has a large impact
on supply chain responsiveness and efficiency
– combinations of transportation modes and routes, e.g. A mail- order company use fedex
Copyright © 2016 Pearson Education, Inc. 1 – 4
Copyright © 2016 Pearson Education, Inc. 3 – 4
1-4
Cross-Functional Drivers
• Information
– data and analysis regarding inventory, transportation, facilities, price
throughout the supply chain
– potentially the biggest driver of supply chain performance. The
information of customer demand in drugs to stock, pharmaceutical
companies, can be more responsiveness because customer require
when need, or the opposite because the firms can forecast the amount
of needs
• Sourcing
– functions a firm performs and functions that are outsourced
– determine what functions a firm performs and what functions the firm
out- sources. E.g. Motorola, in china, efficiency improved but
responsiveness suffered because of distance so flying some of the
cellphones even though its increased transportation cost
Or Flextronics very responsive so keep the production facilities in the
U.S. but keep another facilities in the low-cost countries
Copyright © 2016 Pearson Education, Inc. 1 – 5
Copyright © 2016 Pearson Education, Inc. 3 – 5
Cross-Functional Drivers
• Pricing
– Price associated with goods and services provided by a firm to the
supply chain, effect on consumer behavior
Copyright © 2016 Pearson Education, Inc. 1 – 6
Copyright © 2016 Pearson Education, Inc. 3 – 6
1-6
Cross-Functional Drivers
• These drivers are working independently but
interact with each other to determine the supply
chain’s performance in terms of responsiveness
and efficiency.
• As a result, the structure of these drivers
determines if and how strategic fit is achieved
across the supply chain. Good supply chain
design and operation recognizes this interaction
and makes the appropriate trade-offs to deliver
the desired level of responsiveness.
Copyright © 2016 Pearson Education, Inc. 1 – 7
Copyright © 2016 Pearson Education, Inc. 3 – 7
Facilities
Role in competitive strategy:
• Facilities are the key driver of the supply
chain, e.g. a company can gain economies of
scale when the product is manufactured or
stored in only one location(centralization) and
increase the efficiency or the opposite
Copyright © 2016 Pearson Education, Inc. 1 – 8
Copyright © 2016 Pearson Education, Inc. 3 – 8
Facilities
• Components of facilities decisions
– Role: companies must decide about:
• Flexible, dedicated (more efficient, can use for number
of product), or a combination of the two
• Product is stored or cross-docking
– Location
• Where a company will locate its facilities
• Centralize for economies of scale, decentralize for
responsiveness
• Consider macroeconomic factors, quality of workers,
cost of workers and facility, availability of
infrastructure, proximity to customers, location of other
facilities, tax effects
Copyright © 2016 Pearson Education, Inc. 1 – 9
Copyright © 2016 Pearson Education, Inc. 3 – 9
Facilities
• Components of facilities decisions
– Capacity
• Large amount of extra capacity – responsive,
costly
• Little excess capacity – more efficient, less
responsive
• A company must make a trade-off to determine
the right amount of capacity to have at each of its
facilities
Copyright © 2016 Pearson Education, Inc. 1 – 10
Copyright © 2016 Pearson Education, Inc. 3 – 10
• Components of facilities decisions
• A manager should track the following facility-related
metrics that influence supply chain performance.
– Facility-related metrics
• Capacity
• Utilization (operation)
• Processing/setup/down/idle time
• Production cost per unit
• Quality losses
• Theoretical flow/cycle time of production
• Actual average flow/cycle time
Facilities
Copyright © 2016 Pearson Education, Inc. 1 – 11
Copyright © 2016 Pearson Education, Inc. 3 – 11
Components of Inventory Decisions
• Cycle inventory
– 1.Is the average amount of inventory used to satisfy demand between supplier
shipments,
– 3. As an example of a cycle stock decision, consider an online book retailer,
replenishment, 10 truckload each month or one each three days, cycle
inventory high or low
– The first cost of holding larger lots of inventory(cycle is high), second cost of
ordering product frequently
– 2. How much to order for replenishment and how often to place the order
– Function of lot size decisions
• Safety inventory(if the world were perfectly predictable, only cycle
inventory would be enough) e.g. toy retailer holiday for safety
– Inventory held in case highly unexpected demand(high uncertainly) e.g. toy
retailer must calculate its safety inventory for holiday buying
Too much inventory will face with unsold product,
Copyright © 2016 Pearson Education, Inc. 1 – 12
Copyright © 2016 Pearson Education, Inc. 3 – 12
Safety inventory
• safety inventory involves making a trade-off
between the costs of having too much
inventory and the costs of losing sales due to
not having enough inventory.
Copyright © 2016 Pearson Education, Inc. 1 – 13
Copyright © 2016 Pearson Education, Inc. 3 – 13
Components of Inventory Decisions
• Seasonal inventory if can rapidly change the
rate of production no need seasonal inventory
– Inventory built up to counter predictable variability
in demand, store product for a period of time
- If the company can change the rate of product system
quickly so no need to have a seasonal inventory
• Level of product availability
– The fraction of demand that is served on time from
product held in inventory, lower product lower
holding cost, opposite
– Trade off between customer service and cost
Copyright © 2016 Pearson Education, Inc. 1 – 14
Copyright © 2016 Pearson Education, Inc. 3 – 14
Transportation
• Components of Transportation Decisions
– Design of transportation network
• Modes, locations, and routes along which product
can be shipped
• Direct or with intermediate consolidation points
• One or multiple supply or demand points in a single
run
Copyright © 2016 Pearson Education, Inc. 1 – 15
Copyright © 2016 Pearson Education, Inc. 3 – 15
Transportation
• Components of Transportation Decisions
– Choice of transportation mode(manner of
moving)
• Air, truck, rail, sea, and pipeline
• Information goods via the Internet
• Different speed, size of shipments, cost of shipping,
and flexibility
Copyright © 2016 Pearson Education, Inc. 1 – 16
Copyright © 2016 Pearson Education, Inc. 3 – 16
Transportation
– Transportation-related metrics
• Average inbound transportation cost
• Average income shipment size
• Average inbound transportation cost per shipment
• Average outbound transportation cost
• Average outbound shipment size
• Average outbound transportation cost per shipment
• Fraction transported by mode
Copyright © 2016 Pearson Education, Inc. 1 – 17
Copyright © 2016 Pearson Education, Inc. 3 – 17
Information
• Role in the Supply Chain
• Serves as a connection within various stages of
supply chain
• The company can then use this information to
determine whether new orders can be filled.
Copyright © 2016 Pearson Education, Inc. 1 – 18
Copyright © 2016 Pearson Education, Inc. 3 – 18
Information
• Role in the Competitive Strategy
– Improves visibility of transactions and
coordination of decisions across the supply chain
– Right information can help a supply chain better
meet customer needs at lower cost
Copyright © 2016 Pearson Education, Inc. 1 – 19
Copyright © 2016 Pearson Education, Inc. 3 – 19
Components of Information Decisions
• Push versus Pull
• Different system requires different information
• Push needs information in terms of MRP (material
requirement planning) which is the schedule of
planning inventory system
• Pull requires information in terms of actual demand
Copyright © 2016 Pearson Education, Inc. 1 – 20
Copyright © 2016 Pearson Education, Inc. 3 – 20
Components of Information Decisions
• Coordination and information sharing
– Supply chain coordination, all stages of a supply
chain work toward the objective of maximizing
total supply chain profitability based on shared
information
• Sales and operations planning (S&OP)
– The process of creating an overall supply plan
(production and inventories) to meet the
anticipated level of demand (sales)
Copyright © 2016 Pearson Education, Inc. 1 – 21
Copyright © 2016 Pearson Education, Inc. 3 – 21
Components of Information Decisions
• Enabling technologies
1. Electronic data interchange (EDI)
2. The Internet
3. Enterprise resource planning (ERP) systems
4. Radio frequency identification (RFID)
Copyright © 2016 Pearson Education, Inc. 1 – 22
Copyright © 2016 Pearson Education, Inc. 3 – 22
Components of Information Decisions
• Information-related metrics
– Forecast horizon
– Frequency of update
– Forecast error
– Seasonal factors
– Variance from plan
– Ratio of demand variability to order variability
Copyright © 2016 Pearson Education, Inc. 1 – 23
Copyright © 2016 Pearson Education, Inc. 3 – 23
Sourcing
• Role in the Competitive Strategy
– Sourcing decisions are crucial because they
affect the level of efficiency and
responsiveness in a supply chain
– Outsource to responsive third parties if it is too
expensive to develop their own
Copyright © 2016 Pearson Education, Inc. 1 – 24
Copyright © 2016 Pearson Education, Inc. 3 – 24
Components of Sourcing Decisions
• Sourcing-related metrics
– Days payable outstanding
– Average purchase price
– Average purchase quantity
– Supply quality
– Supply lead time
– Fraction of on-time deliveries
– Supplier reliability
Copyright © 2016 Pearson Education, Inc. 1 – 25
Copyright © 2016 Pearson Education, Inc. 3 – 25
Components of Pricing Decisions
• Pricing-related metrics
– Profit margin
– Average sale price
– Average order size
– Range of sale price

Chapter 3 supply chain drivers and metrics (6e).pdf

  • 1.
    Copyright © 2016Pearson Education, Inc. 1 – 1 Copyright © 2016 Pearson Education, Inc. 3 – 1 PowerPoint presentation to accompany Chopra and Meindl Supply Chain Management, 6e PowerPoint presentation to accompany Chopra and Meindl Supply Chain Management, 6e 3 Supply Chain Drivers and Metrics
  • 2.
    Copyright © 2016Pearson Education, Inc. 1 – 2 Copyright © 2016 Pearson Education, Inc. 3 – 2 Starting • The strategic fit requires that a company's supply chain achieve the balance between responsiveness and efficiency that best meets the needs of the company's competitive strategy. To understand how a company can improve supply chain performance in terms of responsiveness and efficiency, we must examine the logistical and cross- functional drivers of supply chain performance: facilities, inventory, transportation, information, sourcing, and pricing.
  • 3.
    Copyright © 2016Pearson Education, Inc. 1 – 3 Copyright © 2016 Pearson Education, Inc. 3 – 3 1-3 Drivers of Supply Chain Performance Logistical Drivers • Facilities ( location) – places where inventory is stored, assembled (put together), or fabricated – production sites and storage sites, e.g. several stores for responsiveness, e.g. auto- parts distributor different location to satisfy their customer's demand • Inventory – raw materials, finished goods within a supply chain – inventory policies e.g. clothing retailer by stock the product(large inventory) to satisfy the customer demand and increase responsive and the opposite, smaller inventory, increase efficiency, clothing retailers • Transportation – moving inventory from point to point in a supply chain transportation has a large impact on supply chain responsiveness and efficiency – combinations of transportation modes and routes, e.g. A mail- order company use fedex
  • 4.
    Copyright © 2016Pearson Education, Inc. 1 – 4 Copyright © 2016 Pearson Education, Inc. 3 – 4 1-4 Cross-Functional Drivers • Information – data and analysis regarding inventory, transportation, facilities, price throughout the supply chain – potentially the biggest driver of supply chain performance. The information of customer demand in drugs to stock, pharmaceutical companies, can be more responsiveness because customer require when need, or the opposite because the firms can forecast the amount of needs • Sourcing – functions a firm performs and functions that are outsourced – determine what functions a firm performs and what functions the firm out- sources. E.g. Motorola, in china, efficiency improved but responsiveness suffered because of distance so flying some of the cellphones even though its increased transportation cost Or Flextronics very responsive so keep the production facilities in the U.S. but keep another facilities in the low-cost countries
  • 5.
    Copyright © 2016Pearson Education, Inc. 1 – 5 Copyright © 2016 Pearson Education, Inc. 3 – 5 Cross-Functional Drivers • Pricing – Price associated with goods and services provided by a firm to the supply chain, effect on consumer behavior
  • 6.
    Copyright © 2016Pearson Education, Inc. 1 – 6 Copyright © 2016 Pearson Education, Inc. 3 – 6 1-6 Cross-Functional Drivers • These drivers are working independently but interact with each other to determine the supply chain’s performance in terms of responsiveness and efficiency. • As a result, the structure of these drivers determines if and how strategic fit is achieved across the supply chain. Good supply chain design and operation recognizes this interaction and makes the appropriate trade-offs to deliver the desired level of responsiveness.
  • 7.
    Copyright © 2016Pearson Education, Inc. 1 – 7 Copyright © 2016 Pearson Education, Inc. 3 – 7 Facilities Role in competitive strategy: • Facilities are the key driver of the supply chain, e.g. a company can gain economies of scale when the product is manufactured or stored in only one location(centralization) and increase the efficiency or the opposite
  • 8.
    Copyright © 2016Pearson Education, Inc. 1 – 8 Copyright © 2016 Pearson Education, Inc. 3 – 8 Facilities • Components of facilities decisions – Role: companies must decide about: • Flexible, dedicated (more efficient, can use for number of product), or a combination of the two • Product is stored or cross-docking – Location • Where a company will locate its facilities • Centralize for economies of scale, decentralize for responsiveness • Consider macroeconomic factors, quality of workers, cost of workers and facility, availability of infrastructure, proximity to customers, location of other facilities, tax effects
  • 9.
    Copyright © 2016Pearson Education, Inc. 1 – 9 Copyright © 2016 Pearson Education, Inc. 3 – 9 Facilities • Components of facilities decisions – Capacity • Large amount of extra capacity – responsive, costly • Little excess capacity – more efficient, less responsive • A company must make a trade-off to determine the right amount of capacity to have at each of its facilities
  • 10.
    Copyright © 2016Pearson Education, Inc. 1 – 10 Copyright © 2016 Pearson Education, Inc. 3 – 10 • Components of facilities decisions • A manager should track the following facility-related metrics that influence supply chain performance. – Facility-related metrics • Capacity • Utilization (operation) • Processing/setup/down/idle time • Production cost per unit • Quality losses • Theoretical flow/cycle time of production • Actual average flow/cycle time Facilities
  • 11.
    Copyright © 2016Pearson Education, Inc. 1 – 11 Copyright © 2016 Pearson Education, Inc. 3 – 11 Components of Inventory Decisions • Cycle inventory – 1.Is the average amount of inventory used to satisfy demand between supplier shipments, – 3. As an example of a cycle stock decision, consider an online book retailer, replenishment, 10 truckload each month or one each three days, cycle inventory high or low – The first cost of holding larger lots of inventory(cycle is high), second cost of ordering product frequently – 2. How much to order for replenishment and how often to place the order – Function of lot size decisions • Safety inventory(if the world were perfectly predictable, only cycle inventory would be enough) e.g. toy retailer holiday for safety – Inventory held in case highly unexpected demand(high uncertainly) e.g. toy retailer must calculate its safety inventory for holiday buying Too much inventory will face with unsold product,
  • 12.
    Copyright © 2016Pearson Education, Inc. 1 – 12 Copyright © 2016 Pearson Education, Inc. 3 – 12 Safety inventory • safety inventory involves making a trade-off between the costs of having too much inventory and the costs of losing sales due to not having enough inventory.
  • 13.
    Copyright © 2016Pearson Education, Inc. 1 – 13 Copyright © 2016 Pearson Education, Inc. 3 – 13 Components of Inventory Decisions • Seasonal inventory if can rapidly change the rate of production no need seasonal inventory – Inventory built up to counter predictable variability in demand, store product for a period of time - If the company can change the rate of product system quickly so no need to have a seasonal inventory • Level of product availability – The fraction of demand that is served on time from product held in inventory, lower product lower holding cost, opposite – Trade off between customer service and cost
  • 14.
    Copyright © 2016Pearson Education, Inc. 1 – 14 Copyright © 2016 Pearson Education, Inc. 3 – 14 Transportation • Components of Transportation Decisions – Design of transportation network • Modes, locations, and routes along which product can be shipped • Direct or with intermediate consolidation points • One or multiple supply or demand points in a single run
  • 15.
    Copyright © 2016Pearson Education, Inc. 1 – 15 Copyright © 2016 Pearson Education, Inc. 3 – 15 Transportation • Components of Transportation Decisions – Choice of transportation mode(manner of moving) • Air, truck, rail, sea, and pipeline • Information goods via the Internet • Different speed, size of shipments, cost of shipping, and flexibility
  • 16.
    Copyright © 2016Pearson Education, Inc. 1 – 16 Copyright © 2016 Pearson Education, Inc. 3 – 16 Transportation – Transportation-related metrics • Average inbound transportation cost • Average income shipment size • Average inbound transportation cost per shipment • Average outbound transportation cost • Average outbound shipment size • Average outbound transportation cost per shipment • Fraction transported by mode
  • 17.
    Copyright © 2016Pearson Education, Inc. 1 – 17 Copyright © 2016 Pearson Education, Inc. 3 – 17 Information • Role in the Supply Chain • Serves as a connection within various stages of supply chain • The company can then use this information to determine whether new orders can be filled.
  • 18.
    Copyright © 2016Pearson Education, Inc. 1 – 18 Copyright © 2016 Pearson Education, Inc. 3 – 18 Information • Role in the Competitive Strategy – Improves visibility of transactions and coordination of decisions across the supply chain – Right information can help a supply chain better meet customer needs at lower cost
  • 19.
    Copyright © 2016Pearson Education, Inc. 1 – 19 Copyright © 2016 Pearson Education, Inc. 3 – 19 Components of Information Decisions • Push versus Pull • Different system requires different information • Push needs information in terms of MRP (material requirement planning) which is the schedule of planning inventory system • Pull requires information in terms of actual demand
  • 20.
    Copyright © 2016Pearson Education, Inc. 1 – 20 Copyright © 2016 Pearson Education, Inc. 3 – 20 Components of Information Decisions • Coordination and information sharing – Supply chain coordination, all stages of a supply chain work toward the objective of maximizing total supply chain profitability based on shared information • Sales and operations planning (S&OP) – The process of creating an overall supply plan (production and inventories) to meet the anticipated level of demand (sales)
  • 21.
    Copyright © 2016Pearson Education, Inc. 1 – 21 Copyright © 2016 Pearson Education, Inc. 3 – 21 Components of Information Decisions • Enabling technologies 1. Electronic data interchange (EDI) 2. The Internet 3. Enterprise resource planning (ERP) systems 4. Radio frequency identification (RFID)
  • 22.
    Copyright © 2016Pearson Education, Inc. 1 – 22 Copyright © 2016 Pearson Education, Inc. 3 – 22 Components of Information Decisions • Information-related metrics – Forecast horizon – Frequency of update – Forecast error – Seasonal factors – Variance from plan – Ratio of demand variability to order variability
  • 23.
    Copyright © 2016Pearson Education, Inc. 1 – 23 Copyright © 2016 Pearson Education, Inc. 3 – 23 Sourcing • Role in the Competitive Strategy – Sourcing decisions are crucial because they affect the level of efficiency and responsiveness in a supply chain – Outsource to responsive third parties if it is too expensive to develop their own
  • 24.
    Copyright © 2016Pearson Education, Inc. 1 – 24 Copyright © 2016 Pearson Education, Inc. 3 – 24 Components of Sourcing Decisions • Sourcing-related metrics – Days payable outstanding – Average purchase price – Average purchase quantity – Supply quality – Supply lead time – Fraction of on-time deliveries – Supplier reliability
  • 25.
    Copyright © 2016Pearson Education, Inc. 1 – 25 Copyright © 2016 Pearson Education, Inc. 3 – 25 Components of Pricing Decisions • Pricing-related metrics – Profit margin – Average sale price – Average order size – Range of sale price