Download to read offline
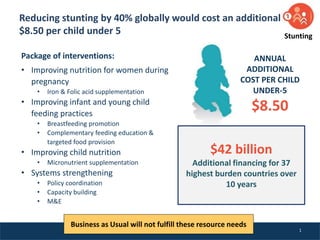
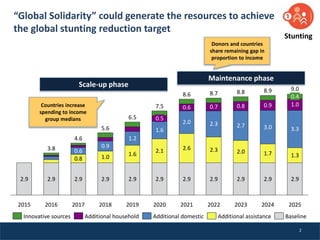
Reducing stunting globally by 40% would cost an additional $8.50 per child under 5 annually, totaling $42 billion. A package of interventions like improving nutrition for pregnant women, supplementation, breastfeeding promotion, and complementary feeding could achieve this target. Additional financing is needed for 37 high burden countries over 10 years, as current approaches will not meet resource needs. "Global Solidarity" generating resources from all countries proportionate to their means could fund reaching the stunting reduction goal.


