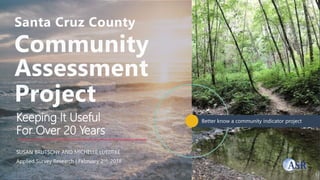
The Santa Cruz County Community Assessment Project (CAP) is one of the oldest community indicator projects of its kind in the United States. Learn more about the model, funding structure, indicator selection, and innovate ways that allow this report to remain a vital tool for the community.
The transition to Universal Credit and the introduction of a lower benefit cap will become a reality for thousands of people this Autumn.
For the first time, Policy in Practice has modelled how welfare reform is affecting cities, towns and London Boroughs differently to create a national picture.
Using household-level data from different local authorities we’ve modelled the likely impact of continued deployment of welfare reforms on towns and cities that aren’t yet significantly affected.
By analysing the impact of Universal Credit on different types of councils we can predict how similar local authorities are likely to be hit.
Some areas in the UK will see a major impact almost overnight as a result of welfare reforms.
Listen to this webinar to learn:
1. How your local authority peers are impacted by welfare reforms (by council type)
2. What impact the lower benefit cap, Universal Credit and housing reforms will have (by council type)
3. How households in your local area are likely to be affected
Programme launch: Delivering prevention in an ageing worldILC- UK
Following our year-long Prevention in an ageing world programme that sparked conversations from Abu Dhabi to Taipei, Austin, Geneva, Sydney, London all the way to the G20 Health Ministers, the message is clear. It’s never too late to prevent. And the health and economic costs of failing to invest in preventative interventions across the life course are simply too high to ignore.
The ongoing COVID-19 pandemic has made these messages staggeringly clear and brought home the urgent need to match commitment with action by:
Democratising access to prevention – to reduce health inequalities
Inspiring and engaging policymakers, healthcare professionals and individuals – to invest, promote and take action on prevention
Effectively utilising technology – to improve access to health care, improve uptake rates, reduce barriers and empower patients.
These are the slides from the launch of the second phase of our programme Delivering prevention in an ageing world, where we will be moving from “why” we need to prioritise prevention to “how” we can deliver it and see the change we need to see.
Workshop presentation to California Workforce Association Youth Conference, Jan 2014. Gang violence costs communities their most significant assets – young people. Monterey County led the state in youth homicides for two years. This year, the communi- ty responded. Using Human Centered Design, a broad- based coalition (collective impact model) is creating and testing solutions.
Nonprofit SIG: Maximizing Volunteer ImpactChicago AMA
Activating Volunteers from Supporters to Advocates was presented by ESC at the Nonprofit SIG event on July 18, 2013. ESC is a nonprofit consulting resource strengthening other nonprofits and public agencies to serve their missions.
A keynote overview on the State of Volunteering in America with the latest statistics and research-backed data on who volunteers and w,hy along with ideas on reaching and retaining volunteers. Presented to the Council of Volunteer Administrators, March 2015.
Cash transfer programs and intimate partner violence – Lessons from 3 case st...IFPRI-PIM
PIM Webinar held on March 28, 2018 by Melissa Hidrobo and Shalini Roy (IFPRI) discusses how cash transfers can reduce intimate partner violence (IPV). The presenters review 3 PIM-funded studies (in Ecuador, Bangladesh, and Mali) that explore impacts of transfer programs on IPV. A more detailed description and recording of the webinar is available at http://bit.ly/PIMwebinarIPV
Here are our recommendations for getting your operations back on track. This 90-day plan will help your team improve communication, sense of community and online reviews
Milwaukee's Community Approach to Reducing Teen Births with Digital Video, Te...YTH
United Way of Greater Milwaukee and citywide partners are working to reduce the teen birthrate by 46% by 2015. Involving young people, parents, faith leaders and the business community, the campaign uses mixed media such as digital video, contracep-texting, and an online resource portal.
Children's Services Council of Broward County, Systemic Model of Preventioncscbroward
Research Analyst Laura Ganci and Program Specialist Melissa Stanley of the Children's Services Council of Broward County, hosted a webinar for the Florida Alcohol and Drug Abuse Association on Implementing a Collaborative Approach to Child Welfare.
The Children's Services Council of Broward County provides leadership, advocacy and resources necessary to enhance children's lives and empower them to become responsible, productive adults. To learn more, visit us online at www.cscbroward.org and on social media at www.facebook.com/cscbroward; www.twitter.com/cscbroward; and www.youtube.com/cscbroward
Cities are becoming the most prominent context for social change in the world today, and they offer exciting opportunities for participative governance. A model of “systematic civic stewardship” frames the city as community-based, action-learning system. Leaders play key roles in neighborhood teams focused on local challenges (graduation rates, health outcomes, etc.), while learning and working with peers via city-wide communities of practice. We have much to learn about learning systems in any context—understanding how they work in communities and cities draws on organization experience and provokes new insights.
Game Changing Decisions: Using Wave Studies To Understand Changes To Your BrandEMI Research Solutions
When organizations face decisions that can vastly alter their operations or how they do business, these can be called “game-changing” decisions. As these decisions are made, organizations want to measure what impact these decisions have with brand perception in the marketplace.
How best can organization measure the impact of their decision?
Check out the deck from our webinar Game-Changing Decisions: Using Wave Studies To Understand Changes To Your Brand, to discover how.
Addressing Obesity In The Latino Community Through Community-based Advocacy In Baldwin Park
Alfred Mata, Local Policy Specialist, California Center for Public Health Advocacy.
ATS14- What meaningful engagement means: capacity-building as a tool to impro...BTAOregon
Federal, state and local transportation guidelines strongly encourage or even require that transportation officials conduct “meaningful” public engagement as part of their planning and decision-making processes. But the most well-intentioned efforts can fail to reach low-income and minority communities that are often still not at the table when important decisions are being made. In order for marginalized communities to participate effectively in public process, government agencies and private funders must invest in their time, skills and capacity to engage in time-consuming and complex discussions such as those around transportation, planning and funding decisions. Attendees will discuss what capacity-building is and why it is important, and learn from recent capacity-building efforts in health, community planning and transportation.
The Power of ABCD and Results-Based Accountability for Greater Impact and Res...Clear Impact
Asset Based Community Development (ABCD) is a place-based framework pioneered by John McKnight and Jody Kretzmann, founders of the ABCD Institute at Northwestern University. ABCD builds on the gifts (skills, experiences, knowledge, and passions) of local residents, the power of local associations, and the supportive functions of local institutions to build more sustainable communities for the future.
This webinar is for participants interested in discovering how the frameworks of Asset-Based Community Development and Results-Based Accountability can be used together to help build stronger, safer, healthier communities and neighborhoods. You will learn how to build the relationships and accountability necessary to unlock the gifts of the residents, associations and organizations in a community. During this webinar you will hear stories of effective impact through the power of Asset-Based Community Development and Results-Based Accountability.
Webinar topics include:
Introduction to ABCD and RBA – Definitions & Principles
Examples of ABCD and RBA in action
Why place-based strategies and community engagement are critical
The roles of residents in building a stronger community
The new role of institutions – How institutions can use all their assets to build a stronger community
Tools for agencies – Leading by stepping back
Asset Mapping – Discover-Ask-Connect – From Mapping to Mobilizing
Check out more videos and webinars on our website: https://clearimpact.com/resources/videos/
BUILDing Multi-Sector Collaborations to Advance Community HealthPractical Playbook
The Practical Playbook
National Meeting 2016
www.practicalplaybook.org
Bringing Public Health and Primary Care Together: The Practical Playbook National Meeting was at the Hyatt Regency in Bethesda, MD, May 22 - 24, 2016. The meeting was a milestone event towards advancing robust collaborations that improve population health. Key stakeholders from across sectors – representing professional associations, community organizations, government agencies and academic institutions – and across the country came together at the National Meeting to help catalyze a national movement, accelerate collaborations by fostering skill development, and connect with like-minded individuals and organizations to facilitate the exchange of ideas to drive population health improvement.
The National Meeting was also a significant source of tools and resources to advance collaboration. These tools and resources are available below and include:
Session presentations and materials
Poster session content
Photos from the National Meeting
The conversation started at the National Meeting is continuing in a LinkedIn Group "Working Together for Population Health" and Twitter. Use #PPBMeeting to provide feedback on the National Meeting.
The Practical Playbook was developed by the de Beaumont Foundation, the Duke University School of Medicine Department of Community and Family Medicine, the Centers for Disease Control and Prevention (CDC), and the Health Resources & Services Administration (HRSA).
Presentation given at ACE Memphis 2016. Describes the process a team of Extension and on-campus faculty went through to create a two-day training for Extension personnel to communicate about sensitive and contentious issues related to agriculture and natural resources.
In the latest webinar in the Using What Works series highlighting tools of the Annie E. Casey Foundation’s Evidence2Success framework, experts described the components of a strategic financing plan for programs proven to work for children and families and new financing approaches being adopted around the country.
Proposal: Launch a community-based action-learning lab to accelerate innovation and application of systematic approaches to civic stewardship.
Approach: Applies systematic methods in the civic context that are now used in successful organizations to increase local ownership for ambitious goals, and to foster innovation and collaboration for achieving them.
Opportunity: Spur progress on our most persistent and costly socio-economic and environmental problems by cultivating a national network of neighborhood-based civic stewardship initiatives. A critical mass of neighborhood efforts in 300 U.S. cities can save hundreds of billions in annual government costs, while fostering “collective efficacy” and wellbeing in communities nationwide.
Why now: Recent developments in measures (spurred by the proliferation of “public data”), social media (e.g., neighborhood websites), and monetization (e.g., social impact bonds) are “disruptive innovations” that create ripe opportunities for quantum change.
Nonprofit Insights: Who is Volunteering in America?VolunteerMatch
Who is volunteering in America? How much do they volunteer, and with what organizations?
How can nonprofits best engage Americans in their causes?
The new report from the Corporation for National and Community Service, "Volunteering and Civic Life in America," has some answers. Drawn from the most recent U.S. Census Bureau surveys of tens of thousands of households, the report and its accompanying website show how cities, states, age groups and other demographics rank and interact when it comes to volunteering and community involvement.
What does this mean for nonprofits? How can you use this data to increase support for your organization's efforts? Why does it matter that parents volunteer at a higher rate than non-parents, or that two out of every three Americans are volunteering informally in their communities?
For April 2013 Nonprofit Insights webinar, VolunteerMatch President Greg Baldwin had a special conversation with Dr. Christopher Spera, Director of Research & Evaluation at the Corporation for National and Community Service. They discussed the history of this research report, the trends it reveals, and the many ways nonprofits can make best use of the information contained within.
Linking well-being evidence across the policy cycle and across different time...StatsCommunications
Session 2 of the virtual event series on Implementing a well-being approach to policy and international partnerships in Latin America, 28-30 June 2022, More information at: https://www.oecd.org/wise/lac-well-being-metrics.htm
Be part of a conversation about Rotary's future — in 2020 and beyond. What challenges does our organization face, and what opportunities can we seize going forward? We'll discuss the charge of the Strategic Planning Committee as it works to develop the next iteration of Rotary's strategic plan in light of the new vision statement.
Similar to Santa Cruz County Community Assessment Project: Keeping It Useful for Over 20 Years (20)
Show drafts
volume_up
Empowering the Data Analytics Ecosystem: A Laser Focus on Value
The data analytics ecosystem thrives when every component functions at its peak, unlocking the true potential of data. Here's a laser focus on key areas for an empowered ecosystem:
1. Democratize Access, Not Data:
Granular Access Controls: Provide users with self-service tools tailored to their specific needs, preventing data overload and misuse.
Data Catalogs: Implement robust data catalogs for easy discovery and understanding of available data sources.
2. Foster Collaboration with Clear Roles:
Data Mesh Architecture: Break down data silos by creating a distributed data ownership model with clear ownership and responsibilities.
Collaborative Workspaces: Utilize interactive platforms where data scientists, analysts, and domain experts can work seamlessly together.
3. Leverage Advanced Analytics Strategically:
AI-powered Automation: Automate repetitive tasks like data cleaning and feature engineering, freeing up data talent for higher-level analysis.
Right-Tool Selection: Strategically choose the most effective advanced analytics techniques (e.g., AI, ML) based on specific business problems.
4. Prioritize Data Quality with Automation:
Automated Data Validation: Implement automated data quality checks to identify and rectify errors at the source, minimizing downstream issues.
Data Lineage Tracking: Track the flow of data throughout the ecosystem, ensuring transparency and facilitating root cause analysis for errors.
5. Cultivate a Data-Driven Mindset:
Metrics-Driven Performance Management: Align KPIs and performance metrics with data-driven insights to ensure actionable decision making.
Data Storytelling Workshops: Equip stakeholders with the skills to translate complex data findings into compelling narratives that drive action.
Benefits of a Precise Ecosystem:
Sharpened Focus: Precise access and clear roles ensure everyone works with the most relevant data, maximizing efficiency.
Actionable Insights: Strategic analytics and automated quality checks lead to more reliable and actionable data insights.
Continuous Improvement: Data-driven performance management fosters a culture of learning and continuous improvement.
Sustainable Growth: Empowered by data, organizations can make informed decisions to drive sustainable growth and innovation.
By focusing on these precise actions, organizations can create an empowered data analytics ecosystem that delivers real value by driving data-driven decisions and maximizing the return on their data investment.
Opendatabay - Open Data Marketplace.pptxOpendatabay
Opendatabay.com unlocks the power of data for everyone. Open Data Marketplace fosters a collaborative hub for data enthusiasts to explore, share, and contribute to a vast collection of datasets.
First ever open hub for data enthusiasts to collaborate and innovate. A platform to explore, share, and contribute to a vast collection of datasets. Through robust quality control and innovative technologies like blockchain verification, opendatabay ensures the authenticity and reliability of datasets, empowering users to make data-driven decisions with confidence. Leverage cutting-edge AI technologies to enhance the data exploration, analysis, and discovery experience.
From intelligent search and recommendations to automated data productisation and quotation, Opendatabay AI-driven features streamline the data workflow. Finding the data you need shouldn't be a complex. Opendatabay simplifies the data acquisition process with an intuitive interface and robust search tools. Effortlessly explore, discover, and access the data you need, allowing you to focus on extracting valuable insights. Opendatabay breaks new ground with a dedicated, AI-generated, synthetic datasets.
Leverage these privacy-preserving datasets for training and testing AI models without compromising sensitive information. Opendatabay prioritizes transparency by providing detailed metadata, provenance information, and usage guidelines for each dataset, ensuring users have a comprehensive understanding of the data they're working with. By leveraging a powerful combination of distributed ledger technology and rigorous third-party audits Opendatabay ensures the authenticity and reliability of every dataset. Security is at the core of Opendatabay. Marketplace implements stringent security measures, including encryption, access controls, and regular vulnerability assessments, to safeguard your data and protect your privacy.
Levelwise PageRank with Loop-Based Dead End Handling Strategy : SHORT REPORT ...Subhajit Sahu
Abstract — Levelwise PageRank is an alternative method of PageRank computation which decomposes the input graph into a directed acyclic block-graph of strongly connected components, and processes them in topological order, one level at a time. This enables calculation for ranks in a distributed fashion without per-iteration communication, unlike the standard method where all vertices are processed in each iteration. It however comes with a precondition of the absence of dead ends in the input graph. Here, the native non-distributed performance of Levelwise PageRank was compared against Monolithic PageRank on a CPU as well as a GPU. To ensure a fair comparison, Monolithic PageRank was also performed on a graph where vertices were split by components. Results indicate that Levelwise PageRank is about as fast as Monolithic PageRank on the CPU, but quite a bit slower on the GPU. Slowdown on the GPU is likely caused by a large submission of small workloads, and expected to be non-issue when the computation is performed on massive graphs.
Explore our comprehensive data analysis project presentation on predicting product ad campaign performance. Learn how data-driven insights can optimize your marketing strategies and enhance campaign effectiveness. Perfect for professionals and students looking to understand the power of data analysis in advertising. for more details visit: https://bostoninstituteofanalytics.org/data-science-and-artificial-intelligence/
Techniques to optimize the pagerank algorithm usually fall in two categories. One is to try reducing the work per iteration, and the other is to try reducing the number of iterations. These goals are often at odds with one another. Skipping computation on vertices which have already converged has the potential to save iteration time. Skipping in-identical vertices, with the same in-links, helps reduce duplicate computations and thus could help reduce iteration time. Road networks often have chains which can be short-circuited before pagerank computation to improve performance. Final ranks of chain nodes can be easily calculated. This could reduce both the iteration time, and the number of iterations. If a graph has no dangling nodes, pagerank of each strongly connected component can be computed in topological order. This could help reduce the iteration time, no. of iterations, and also enable multi-iteration concurrency in pagerank computation. The combination of all of the above methods is the STICD algorithm. [sticd] For dynamic graphs, unchanged components whose ranks are unaffected can be skipped altogether.
4. 4
• Goal setting
• Strategic plan development
• Expansion planning
• Grant writing support
• Presentation development
• Local reporting
• Program planning
• Product development
• Single source for many secondary data sources
• Topic specific profile development
• Resource tool as a community snapshot
• Understanding community needs for action
• Initiative measures, evaluation, and advocacy
• Community benefit reporting
• Aligning with Social Determinants of Health
• Viewing trends over time
• Tracking disparities among different profiles
• Championing causes and raising awareness
7. Updating structure and
content to align with national
measures of well-being
Relevance.
7
Neighborhood
and Built
Environment
Health and
Health Care
Social and
Community
Context
Education
Economic
Stability
Social Determinants
of Health
(SDOH)
9. Indicator
9
CALIFORNIA
SOUTH COUNTY
SAN
LORENZO
VALLEY
NORTH COUNTY
SANTA
CRUZ
COUNTY
39.8%
32.3%
2005 2007 2009 2011 2013 2015 2017
SURVEY QUESTION: Do you feel you are better off financially this
year than last year? (Respondents answering “Yes”)
OVERALL
85% 90%
74%
97%
Overall North County South County San Lorenzo Valley
SURVEY QUESTION: Do you currently have a transaction account,
checking or savings, with a bank or credit union?
(Respondents answering “Yes”)
OVERALL / REGION
10. 46%
32% 30%
Yes, including
birth-5 years old
Yes, not including
birth-5 years old
No
35%
29%
Homeowner Renter
17%
31%
48%
$34,999 or less $34,999 to
$74,999
$75,000 or
more
28%
37%
Female Male
36%
49%
28%
22%
18 to 24 25 to 44 45 to 64 65+
33% 32% 31%
North County South County San Lorenzo
Valley
Cross-tabs
10
32%
2017
OVERALL
33% 31%
White Latino
ETHNICITY REGION AGE
GENDER INCOME HOUSING STATUS PARENTAL STATUS
17. 17
-Mary Lou Goeke, United Way of Santa Cruz County
“Susan Brutschy
susan@appliedsurveyresearch.org
Michelle Luedtke
michelle@appliedsurveyresearch.org
www.appliedsurveyresearch.org/scccap
Reach out.
Source information for all data shown in this PowerPoint is available in the full report at
www.appliedsurveyresearch.org/scccap.
Editor's Notes
Santa Cruz County Statistics:
Population 274,673
Race/ethnicity
White: 58% | Hispanic/Latino: 34%
Asian: 5% | Black: 1% | Multi-race: 3%
Age
Under 19: 25% | 20-64: 60% | 65+: 15%
Language spoken at home
English: 68% | Other than English: 32%
Educational Attainment
High school diploma (equivalency): 16%
Bachelor’s degree or higher: 41%
Source: ACS Estimates
The Santa Cruz County Community Assessment Project (CAP) report summarizes community assets, challenges, and trends to help identify and assess what is unique about Santa Cruz County. The report displays the most current data available using established sources as well as an original survey. CAP is in its third decade, with 2017 marking the 23rd year of the project, and also marking this project among the oldest of its kind in the United States.
In 2013, the CAP was featured in Santa Cruz County’s application and award of the inaugural Robert Wood Johnson Foundation’s Culture of Health Prize. This annual prize recognizes six communities in America that are making strides to become healthier and more equitable communities. Additionally, the CAP is featured in the Organization for Economic Co-operation and Development’s (OECD) Statistics, Knowledge and Policy 2007: Measuring and Fostering the Progress of Societies and has been discussed at OECD conferences around the world.
The diversity of uses of the CAP products showcased on this slide show the robust use cases and applicable projects for which CAP data is utilized. These reasons contribute to the commitment of the community in supporting this project.
The CAP was convened in 1994 through a collaboration of the United Way of Santa Cruz County and Dominican Hospital, with ASR as the research partner. The broad base of volunteers to the CAP Steering Committee commit their time, resources, and expert counsel to guide the project. And of course, the financial sponsors whose annually contribute to the project’s continued success.
Leveraging Results Based Accountability and Collective Impact models, the CAP, has been, and to this day, remains a self-funded and self-sustaining project that continues as a result of dedicated community volunteers and financial sponsors. Financial sponsors to the project include government organizations, small and large CBOs, businesses, hospitals and educational institutions. Aside from serving as research partner to this project, ASR proudly counts ourselves among the organizations that contribute financially to this project.
The Santa Cruz Community Health Centers (SCCHC): consistent source of timely, local data that allows the SCCHC to leverage funding to improve community health and insights in order to respond to community health needs.
The Public Health Division of the Santa Cruz County Health Services Agency is pursuing Public Health Accreditation, and are utilizing the data from the CAP to help complete various components of their required Community Health Assessment; also utilizes CAP data in grant applications.
The Santa Cruz County Probation Department has used data from the annual CAP report in a number of ways, including improvement of services for Latino youth and residents residing in South County, securing a grant to help renovate juvenile hall and expand youth programming, securing funding to expand programming, particularly for Latino youth and families, and development of a proposal to put in place a culinary arts program at juvenile hall.
Ecology Action (EA) used the CAP data regarding childhood obesity rates and overall population physical activity levels to assess where youth bike safety and encouragement programs were most needed.
The Criminal Justice Council's Youth Violence Prevention Task Force (YVTF) used the unique information found in the CAP to help inform their strategic planning process. Indicators specific to the CAP and the household survey gauge how well the county is doing at creating strong communities where youth can thrive; data to help track their success over time.
In 2016, the CAP began the process of realigning the six original report domains to associate with the 5 areas of the Social Determinants of Health (SDOH). Beyond the integration of SDOH national measures and objectives, Healthy People 2020 targets are also highlighted, offering context to what is happening at the local level. 2017 has marked the culmination of these alignment efforts by transitioning away from the original six sub-sections of the report to organize the report fully by the SDOH areas (shown in the slide).
Across these areas, the CAP features over 80 indicators and approximately 190 measures, including both primary and secondary data. Indicators must meet the governing criteria that were set the project’s inception stipulating that indicators need to be understandable to the general user and the public, responsive to change, relevant for policy decisions, and updated regularly.
While complementary secondary data is collected from a myriad of sources at the national, state, and local level, primary data in the CAP is a result of a biennial community survey.
Community is essential to this project and there are three distinct areas that are shaped and fostered through the role of community residents. The first is the community survey which accounts for the primary data that is reflected in the report. The community telephone survey, conducted in both English and Spanish, is a unique component of the CAP that calls on a demographically representative sample of Santa Cruz County residents to offer their opinions, attitudes, desires, and needs through both open-ended and confined options questions. The survey was conducted annually between 1995 and 2005, and biennially since 2005, with the most recent survey occurring in 2017 and surveying nearly 800 residents. In advance of each community survey year, the CAP Steering Committee is engaged to review the survey and indicators to ensure the report keep ups with changes within our community.
CAP Community Goals are established every five years through a public-engagement process. These community goals broadly align with the topic areas of the report, however they are not intended to endorse or oppose any particular project or initiative, but rather to chart the course for collective action to create a better future for the people of Santa Cruz County.
Finally, the CAP annually honors local community heroes. These special individuals are chosen through a nomination and selection process, which is sponsored by Santa Cruz Sentinel Newspaper, for their efforts toward the achievement of an established CAP community goal. Also, new this year, ASR is sponsoring the inaugural Mary Lou Goeke Data to Action Award recognizing an individual who has catalyzed data for the benefit of the community. All these true-life heroes are publically recognized and acknowledged for their good work at the public release and celebration event for the report in the fall.
Since the beginning of the project, 16 community surveys have been conducted. And while changes to the survey do affect year-over-year comparisons, there are many questions that reflect over a decade of longitudinal data. A sample indicator is shown here: Financial Wellbeing, Income & Employment. The indicator consists of survey data addressing financial wellbeing this year relative to last year, survey data regarding transaction accounts, and to offer a more complete picture of this indicator, secondary data regarding personal income, family income, employment status, and the unemployment rate are also provided.
Survey quotas were used to obtain sufficient samples to allow generalization to the overall population within each of the three designated geographic areas (North County, South County, and the San Lorenzo Valley)- shown in the graphic here. Data are weighted to account for discrepancies between demographic proportions within the sample.
Beyond making community survey data available by overall results, and by geographic region, cross-tabulations are also available by ethnicity, age, gender, income, housing status, and families with and without children.
Innovation has been central to the CAP’s longevity in order to keep the product useful.
The CAP went green in 2017, opting out of printed copies in favor a digital only experience. In response, ASR took up the challenge to go beyond a traditional PDF download and offer users more ways to engage with the report’s content.
Now, in addition to PDF downloads, the comprehensive report is presented for browser viewing using a responsive, interactive online viewer to mimic the experience of flipping through a book. This experience is completed with dynamic content links and keyword search capabilities.
A few years ago we transitioned from a narrative executive summary to a highly graphic version as seen here, along with graphic topic area snapshots. Both of which use colored indicator arrows to quickly ascertain trend information.
Also new this year, ASR leveraged data visualization software to create dynamic data profiles for the community survey overall results as well as for 7 cross-tabulations. These user-friendly and inexpensive dashboards enable easy, interactive viewing of the data results, and a new way to engage with the information rather than static data tables.
ASR leveraged the power of these data profiles to build a dynamic dashboard that specifically considers how our local renters are faring relative to their home-owning peers and county residents overall. Aside from demographics, this dashboard specifically looks at health and social outcomes, both of which, research suggests, can be improved upon by access to affordable, stable housing.
--------------------------------
Link to the special housing report noted here: http://www.appliedsurveyresearch.org/news/capspecialhousingreport
The CAP, at its core, is an actionable document. The action that this project has spurred in Santa Cruz County has brought recognition at national and international levels.
In 2013, the CAP was featured in Santa Cruz County’s application and award of the first Robert Wood Johnson Foundation’s Culture of Health Prize. This annual prize recognizes six communities in America that are making strides to become healthier and more equitable communities.
Since that time, the CAP has been nationally featured by the National Academies of Science, Institute of Medicine’s Roundtable for Population Health Improvement. In 2007, the CAP was chosen as one of the best community indicator projects in the United States, winning first place in the Community Indicators Consortium Innovation Awards sponsored by the Brookings Institution in Washington D.C.
Profiles and articles on the CAP can be found in various publications including the books, Community Quality of Life Indicators, Best Practices III; Diversity and Community Development: An Intercultural Approach; and in the Organization for Economic Co-operation and Development’s (OECD) Statistics, Knowledge and Policy 2007: Measuring and Fostering the Progress of Societies, and the journal, Applied Research in Quality of Life. Additionally, in 2011, The United States General Accounting Office (GAO) determined that the CAP project was a best practice methodology for indicator reports.
In closing, we thank you for joining us this morning. We encourage you to check out the CAP and the new features we discussed which can be found on our website at www.appliedsurveyresearch.org/scccap. Thanks again!