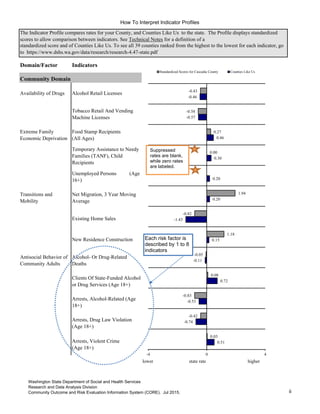
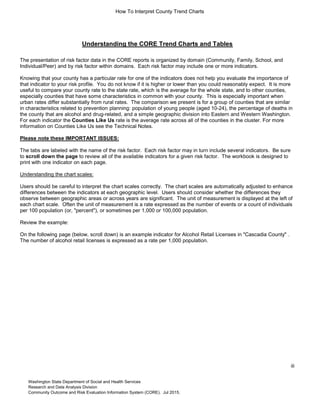
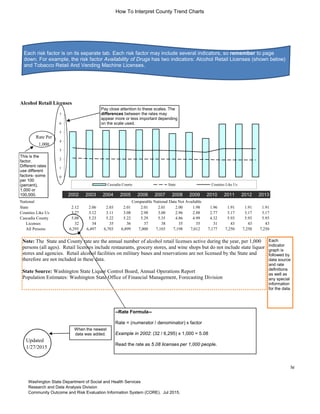
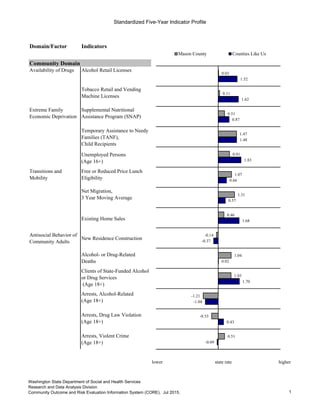
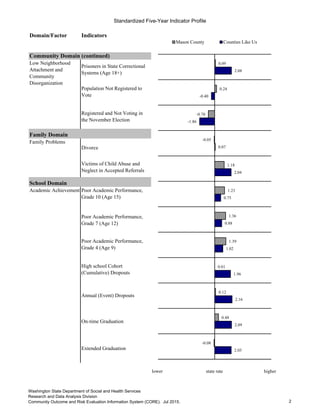
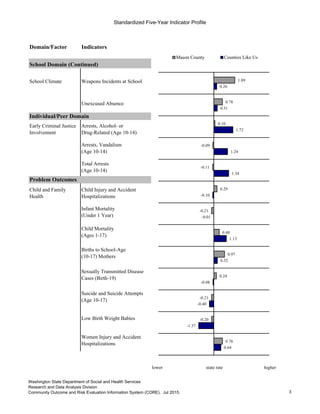
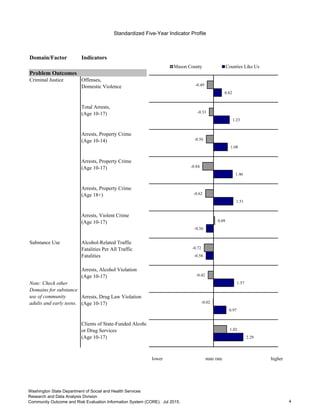
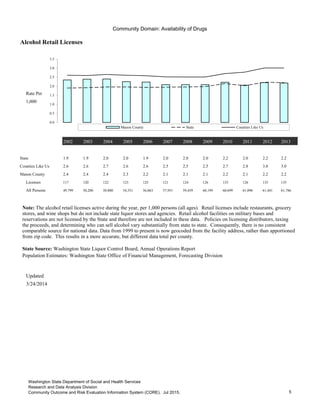
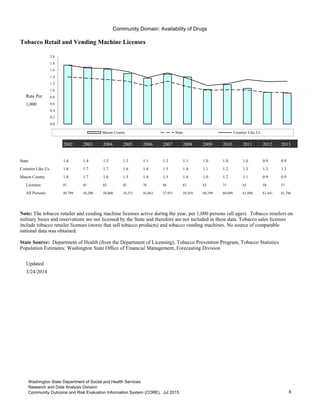
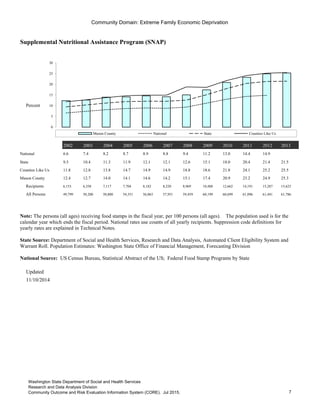
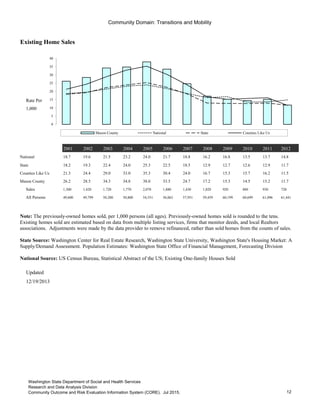
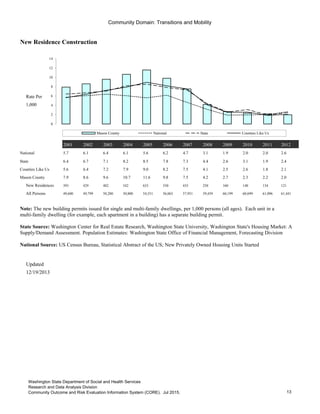
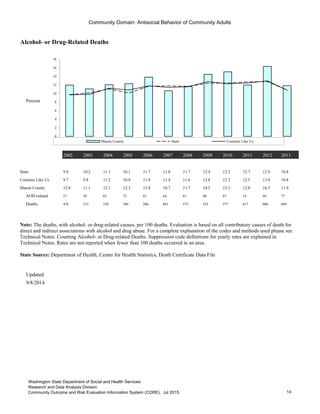
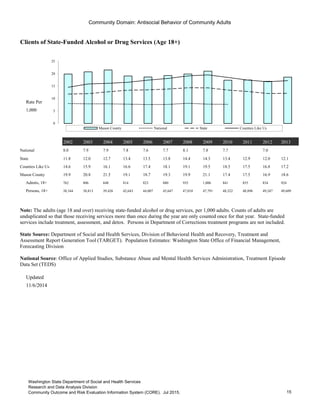
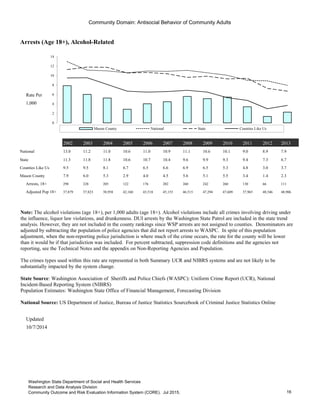
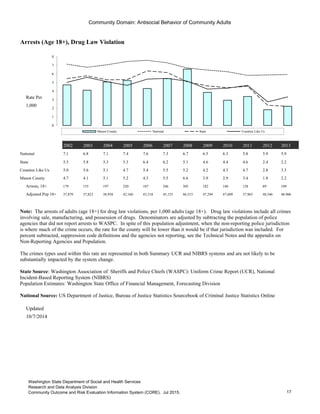
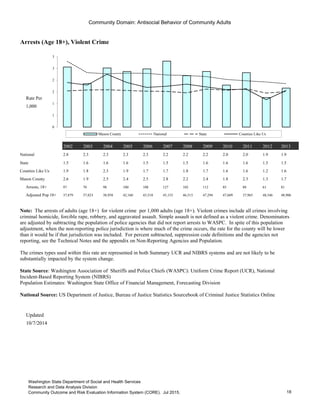
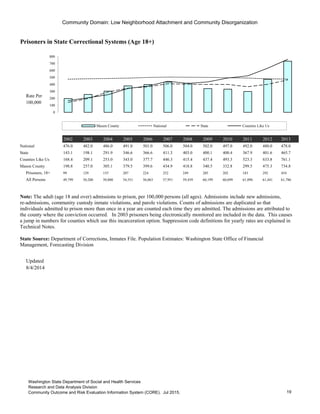
July, 2015
Risk and Protection Profile for
Substance Abuse Prevention in
Mason County
4.47-23:2015
Research & Data Analysis Division
Vera Barga, B.S.
Irina V. Sharkova, Ph.D.
David Mancuso, Ph.D.
in conjunction with the
Division of Behavioral Health and Recovery
Chris Imhoff, Director
Mason County
Table of contents: (Resize document window to access navigation tabs)
Cover page
Introduction
Indicator Comparison Profiles: (A comparison of standardized five-year rates at county
and 'county like us' levels by domain, factor, and indicator)
Community:
Family:
Schools:
Individual/Peer:
Problem Outcomes:
Appendices
i19. Police Agencies that did not Report Arrests to UCR
15. Criminal Justice
12. School Climate
11. Academic Achievement
13. Early Criminal Justice Involvement
14. Child and Family Health
4. Indicator Profile 4
5. Availability of Drugs
17. Technical Notes
18. Populations Subtracted for Police Agencies not Reporting Arrests to UCR
8. Antisocial Behavior of Community Adults
9. Low Neighborhood Attachment and Community Disorganization
10. Family Problems
16. Substance Use
6. Extreme Economic & Social Deprivation
7. Transitions & Mobility
2. Indicator Profile 2
3. Indicator Profile 3
Interpreting Annual Trend Charts:
1. Indicator Profile 1
These tables provide a comprehensive update of data published in previous Profiles . They are among the timeliest data available to
planners for understanding the risks of substance abuse among youth in their counties. Community, family, peer, and school-related
factors are presented within the Hawkins and Catalano risk and protective factor framework that is used by many substance abuse
prevention planners across the country.
For more information about the data, framework, definitions, and other topics, see the 1997 Profile on Risk and Protection for
Substance Abuse Prevention Planning in Washington State, (Report 4.15-40). That report and subsequent years’ Profiles are
available on the RDA website at: https://www.dshs.wa.gov/sesa/rda/core-profile-archive.
Interpreting Indicator Profiles:
How To Interpret Indicator Profiles
Domain/Factor Indicators
Community Domain
Availability of Drugs Alcohol Retail Licenses
Availability of Drugs
Tobacco Retail And Vending
Machine Licenses
Extreme Family
Economic Deprivation
Food Stamp Recipients
(All Ages)
Extreme Family
Economic Deprivation
Temporary Assistance to Needy
Families (TANF), Child
Recipients
Extreme Family
Economic Deprivation
Unemployed Persons (Age
16+)
Transitions and
Mobility
Net Migration, 3 Year Moving
Average
Transitions and
Mobility
Existing Home Sales
Transitions and
Mobility
New Residence Construction
Antisocial Behavior of
Community Adults
Alcohol- Or Drug-Related
Deaths
AOD Problems
Clients Of State-Funded Alcohol
or Drug Services (Age 18+)
AOD Problems
Arrests, Alcohol-Related (Age
18+)
AOD Problems
Arrests, Drug Law Violation
(Age 18+)
Arrests, Violent Crime
(Age 18+)
lower state rate higher
The Indicator Profile compares rates for your County, and Counties Like Us to the state. The Profile displays standardized
scores to allow comparison between indicators. See Technical Notes for a definition of a
standardized score and of Counties Like Us. To see all 39 counties ranked from the highest to the lowest for each indicator, go
to https://www.dshs.wa.gov/data/research/research-4.47-state.pdf
0.51
-0.74
-0.53
0.72
-0.11
0.15
-1.43
0.20
0.20
0.30
0.46
-0.57
-0.46
0.03
-0.42
-0.83
0.08
-0.05
1.18
-0.82
1.94
0.00
0.27
-0.58
-0.43
-4 0 4
Standardized Scores for Cascadia County Counties Like Us
Each risk factor is
described by 1 to 8
indicators
Suppressed
rates are blank,
while zero rates
are labeled.
ii
Washington State Department of Social and Health Services
Research and Data Analysis Division
Community Outcome and Risk Evaluation Information System (CORE). Jul 2015.
How To Interpret County Trend Charts
iii
Understanding the CORE Trend Charts and Tables
The presentation of risk factor data in the CORE reports is organized by domain (Community, Family, School, and
Individual/Peer) and by risk factor within domains. Each risk factor may include one or more indicators.
Knowing that your county has a particular rate for one of the indicators does not help you evaluate the importance of
that indicator to your risk profile. You do not know if it is higher or lower than you could reasonably expect. It is more
useful to compare your county rate to the state rate, which is the average for the whole state, and to other counties,
especially counties that have some characteristics in common with your county. This is especially important when
urban rates differ substantially from rural rates. The comparison we present is for a group of counties that are similar
in characteristics related to prevention planning: population of young people (aged 10-24), the percentage of deaths in
the county that are alcohol and drug-related, and a simple geographic division into Eastern and Western Washington.
For each indicator the Counties Like Us rate is the average rate across all of the counties in the cluster. For more
information on Counties Like Us see the Technical Notes.
Please note these IMPORTANT ISSUES:
The tabs are labeled with the name of the risk factor. Each risk factor may in turn include several indicators. Be sure
to scroll down the page to review all of the available indicators for a given risk factor. The workbook is designed to
print with one indicator on each page.
Understanding the chart scales:
Users should be careful to interpret the chart scales correctly. The chart scales are automatically adjusted to enhance
differences between the indicators at each geographic level. Users should consider whether the differences they
observe between geographic areas or across years are significant. The unit of measurement is displayed at the left of
each chart scale. Often the unit of measurement is a rate expressed as the number of events or a count of individuals
per 100 population (or, "percent"), or sometimes per 1,000 or 100,000 population.
Review the example:
On the following page (below, scroll down) is an example indicator for Alcohol Retail Licenses in "Cascadia County" .
The number of alcohol retail licenses is expressed as a rate per 1,000 population.
Washington State Department of Social and Health Services
Research and Data Analysis Division
Community Outcome and Risk Evaluation Information System (CORE). Jul 2015.
How To Interpret County Trend Charts
Alcohol Retail Licenses
Rate Per
1,000
2002 2003 2004 2005 2006 2007 2008 2009 2010 2011 2012 2013
National Comparable National Data Not Available
State 2.12 2.06 2.03 2.01 2.01 2.01 2.00 1.98 1.96 1.91 1.91 1.91
Counties Like Us 3.27 3.12 3.11 3.08 2.98 3.00 2.96 2.88 2.77 3.17 3.17 3.17
Cascadia County 5.08 5.23 5.22 5.22 5.29 5.35 4.86 4.99 4.32 5.93 5.93 5.93
Licenses 32 34 35 36 37 38 35 35 31 43 43 43
All Persons 6,295 6,497 6,703 6,899 7,000 7,103 7,198 7,012 7,177 7,250 7,250 7,250
Updated
1/27/2015
iv
Go To Standardized Five-Year Rate Indicator Comparison Profile
Back to Table of Contents
0
1
2
3
4
5
6
7
Cascadia County State Counties Like Us
Note: The State and County rate are the annual number of alcohol retail licenses active during the year, per 1,000
persons (all ages). Retail licenses include restaurants, grocery stores, and wine shops but do not include state liquor
stores and agencies. Retail alcohol facilities on military bases and reservations are not licensed by the State and
therefore are not included in these data.
State Source: Washington State Liquor Control Board, Annual Operations Report
Population Estimates: Washington State Office of Financial Management, Forecasting Division
Pay close attention to these scales. The
differences between the rates may
appear more or less important depending
on the scale used.
This is the
factor.
Different rates
use different
factors- some
per 100
(percent),
1,000 or
100,000.
Each
indicator
graph is
followed by
data source
and rate
definitions
as well as
any special
information
for the data.
When the newest
data was added.
--Rate Formula--
Rate = (numerator / denominator) x factor
Example in 2002: (32 / 6,295) x 1,000 = 5.08
Read the rate as 5.08 licenses per 1,000 people.
Each risk factor is on its separate tab. Each risk factor may include several indicators, so remember to page
down. For example, the risk factor Availability of Drugs has two indicators: Alcohol Retail Licenses (shown below)
and Tobacco Retail And Vending Machine Licenses.
Washington State Department of Social and Health Services
Research and Data Analysis Division
Community Outcome and Risk Evaluation Information System (CORE). Jul 2015.
Standardized Five-Year Indicator Profile
Domain/Factor Indicators
Community Domain
Availability of Drugs Alcohol Retail Licenses
Tobacco Retail and Vending
Machine Licenses
Extreme Family
Economic Deprivation
Supplemental Nutritional
Assistance Program (SNAP)
Temporary Assistance to Needy
Families (TANF),
Child Recipients
Unemployed Persons
(Age 16+)
Transitions and
Mobility
Free or Reduced Price Lunch
Eligibility
Net Migration,
3 Year Moving Average
Existing Home Sales
Antisocial Behavior of
Community Adults
New Residence Construction
Alcohol- or Drug-Related
Deaths
Clients of State-Funded Alcohol
or Drug Services
(Age 18+)
Arrests, Alcohol-Related
(Age 18+)
Arrests, Drug Law Violation
(Age 18+)
Arrests, Violent Crime
(Age 18+)
lower state rate higher
-0.09
0.43
-1.04
1.70
0.02
-0.37
1.68
0.57
0.66
1.83
1.48
0.87
1.62
1.52
0.51
-0.53
-1.21
1.03
1.04
-0.14
0.46
1.31
1.07
0.91
1.47
0.51
0.11
0.03
-5 -3 -1 1 3 5
Mason County Counties Like Us
1
Washington State Department of Social and Health Services
Research and Data Analysis Division
Community Outcome and Risk Evaluation Information System (CORE). Jul 2015.
Standardized Five-Year Indicator Profile
Domain/Factor Indicators
Community Domain (continued)
Prisoners in State Correctional
Systems (Age 18+)
Population Not Registered to
Vote
Registered and Not Voting in
the November Election
Family Domain
Family Problems
Divorce
Victims of Child Abuse and
Neglect in Accepted Referrals
School Domain
Academic Achievement Poor Academic Performance,
Grade 10 (Age 15)
Poor Academic Performance,
Grade 7 (Age 12)
Poor Academic Performance,
Grade 4 (Age 9)
High school Cohort
(Cumulative) Dropouts
Annual (Event) Dropouts
On-time Graduation
Extended Graduation
lower state rate higher
Low Neighborhood
Attachment and
Community
Disorganization
2.05
2.09
2.16
1.96
1.02
0.88
0.75
2.04
0.07
-1.86
-0.40
2.08
-0.08
0.48
0.12
0.01
1.39
1.36
1.23
1.18
-0.05
-0.78
0.24
0.09
-7 -5 -3 -1 1 3 5 7
Mason County Counties Like Us
2
Washington State Department of Social and Health Services
Research and Data Analysis Division
Community Outcome and Risk Evaluation Information System (CORE). Jul 2015.
Standardized Five-Year Indicator Profile
Domain/Factor Indicators
School Domain (Continued)
School Climate Weapons Incidents at School
Unexcused Absence
Individual/Peer Domain
Early Criminal Justice
Involvement
Arrests, Alcohol- or
Drug-Related (Age 10-14)
Arrests, Vandalism
(Age 10-14)
Total Arrests
(Age 10-14)
Problem Outcomes
Child and Family
Health
Child Injury and Accident
Hospitalizations
Infant Mortality
(Under 1 Year)
Child Mortality
(Ages 1-17)
Births to School-Age
(10-17) Mothers
Sexually Transmitted Disease
Cases (Birth-19)
Suicide and Suicide Attempts
(Age 10-17)
Low Birth Weight Babies
Women Injury and Accident
Hospitalizations
lower state rate higher
0.64
-1.37
-0.40
-0.08
0.32
1.13
-0.01
-0.10
1.34
1.24
1.72
0.31
0.26
0.78
-0.20
-0.21
0.24
0.97
0.49
-0.21
0.29
-0.11
-0.09
0.10
0.78
1.89
-5 -3 -1 1 3 5
Mason County Counties Like Us
3
Washington State Department of Social and Health Services
Research and Data Analysis Division
Community Outcome and Risk Evaluation Information System (CORE). Jul 2015.
Standardized Five-Year Indicator Profile
Domain/Factor Indicators
Problem Outcomes
Criminal Justice Offenses,
Domestic Violence
Total Arrests,
(Age 10-17)
Arrests, Property Crime
(Age 10-14)
Arrests, Property Crime
(Age 10-17)
Arrests, Property Crime
(Age 18+)
Arrests, Violent Crime
(Age 10-17)
Substance Use Alcohol-Related Traffic
Fatalities Per All Traffic
Fatalities
Arrests, Alcohol Violation
(Age 10-17)
Arrests, Drug Law Violation
(Age 10-17)
Clients of State-Funded Alcohol
or Drug Services
(Age 10-17)
lower state rate higher
Note: Check other
Domains for substance
use of community
adults and early teens.
2.29
0.97
1.57
-0.58
-0.56
1.51
1.46
1.08
1.23
0.62
1.02
-0.02
-0.42
-0.72
0.09
-0.62
-0.84
-0.56
-0.33
-0.49
Mason County Counties Like Us
4
Washington State Department of Social and Health Services
Research and Data Analysis Division
Community Outcome and Risk Evaluation Information System (CORE). Jul 2015.
Community Domain: Availability of Drugs
Alcohol Retail Licenses
Rate Per
1,000
2002 2003 2004 2005 2006 2007 2008 2009 2010 2011 2012 2013
State 1.9 1.9 2.0 2.0 1.9 2.0 2.0 2.0 2.2 2.0 2.2 2.2
Counties Like Us 2.6 2.6 2.7 2.6 2.6 2.5 2.5 2.5 2.7 2.8 3.0 3.0
Mason County 2.4 2.4 2.4 2.3 2.2 2.1 2.1 2.1 2.2 2.1 2.2 2.2
Licenses 117 120 122 123 125 121 124 126 135 126 135 135
All Persons 49,799 50,200 50,800 54,551 56,063 57,951 59,459 60,199 60,699 61,096 61,441 61,786
Updated
3/24/2014
Go to Indicator Comparison Profile
0.0
0.5
1.0
1.5
2.0
2.5
3.0
3.5
Mason County State Counties Like Us
Note: The alcohol retail licenses active during the year, per 1,000 persons (all ages). Retail licenses include restaurants, grocery
stores, and wine shops but do not include state liquor stores and agencies. Retail alcohol facilities on military bases and
reservations are not licensed by the State and therefore are not included in these data. Policies on licensing distributors, taxing
the proceeds, and determining who can sell alcohol vary substantially from state to state. Consequently, there is no consistent
comparable source for national data. Data from 1999 to present is now geocoded from the facility address, rather than apportioned
from zip code. This results in a more accurate, but different data total per county.
State Source: Washington State Liquor Control Board, Annual Operations Report
Population Estimates: Washington State Office of Financial Management, Forecasting Division
5
Washington State Department of Social and Health Services
Research and Data Analysis Division
Community Outcome and Risk Evaluation Information System (CORE). Jul 2015.
Community Domain: Availability of Drugs
Tobacco Retail and Vending Machine Licenses
Rate Per
1,000
2002 2003 2004 2005 2006 2007 2008 2009 2010 2011 2012 2013
State 1.4 1.4 1.3 1.3 1.1 1.3 1.1 1.0 1.0 1.0 0.9 0.9
Counties Like Us 1.8 1.7 1.7 1.6 1.4 1.5 1.4 1.1 1.2 1.3 1.3 1.3
Mason County 1.8 1.7 1.6 1.5 1.4 1.5 1.4 1.0 1.2 1.1 0.9 0.9
Licenses 87 85 83 82 76 86 83 62 71 65 58 57
All Persons 49,799 50,200 50,800 54,551 56,063 57,951 59,459 60,199 60,699 61,096 61,441 61,786
Updated
3/24/2014
Go to Indicator Comparison Profile
0.0
0.2
0.4
0.6
0.8
1.0
1.2
1.4
1.6
1.8
2.0
Mason County State Counties Like Us
Note: The tobacco retailer and vending machine licenses active during the year, per 1,000 persons (all ages). Tobacco retailers on
military bases and reservations are not licensed by the State and therefore are not included in these data. Tobacco sales licenses
include tobacco retailer licenses (stores that sell tobacco products) and tobacco vending machines. No source of comparable
national data was obtained.
State Source: Department of Health (from the Department of Licensing), Tobacco Prevention Program, Tobacco Statistics
Population Estimates: Washington State Office of Financial Management, Forecasting Division
6
Washington State Department of Social and Health Services
Research and Data Analysis Division
Community Outcome and Risk Evaluation Information System (CORE). Jul 2015.
Community Domain: Extreme Family Economic Deprivation
Supplemental Nutritional Assistance Program (SNAP)
Percent
2002 2003 2004 2005 2006 2007 2008 2009 2010 2011 2012 2013
National 6.6 7.4 8.2 8.7 8.9 8.8 9.4 11.2 13.0 14.4 14.9
State 9.5 10.4 11.3 11.9 12.1 12.1 12.6 15.1 18.0 20.4 21.4 21.5
Counties Like Us 11.8 12.8 13.8 14.7 14.9 14.9 18.8 18.6 21.8 24.1 25.2 25.5
Mason County 12.4 12.7 14.0 14.1 14.6 14.2 15.1 17.4 20.9 23.2 24.9 25.3
Recipients 6,153 6,358 7,117 7,704 8,182 8,220 8,969 10,488 12,662 14,191 15,287 15,623
All Persons 49,799 50,200 50,800 54,551 56,063 57,951 59,459 60,199 60,699 61,096 61,441 61,786
Updated
11/10/2014
Go to Indicator Comparison Profile
0
5
10
15
20
25
30
Mason County National State Counties Like Us
Note: The persons (all ages) receiving food stamps in the fiscal year, per 100 persons (all ages). The population used is for the
calendar year which ends the fiscal period. National rates use counts of all yearly recipients. Suppression code definitions for
yearly rates are explained in Technical Notes.
State Source: Department of Social and Health Services, Research and Data Analysis, Automated Client Eligibility System and
Warrant Roll. Population Estimates: Washington State Office of Financial Management, Forecasting Division
National Source: US Census Bureau, Statistical Abstract of the US; Federal Food Stamp Programs by State
7
Washington State Department of Social and Health Services
Research and Data Analysis Division
Community Outcome and Risk Evaluation Information System (CORE). Jul 2015.
Community Domain: Extreme Family Economic Deprivation
Temporary Assistance to Needy Families (TANF), Child Recipients
Percent
2002 2003 2004 2005 2006 2007 2008 2009 2010 2011 2012 2013
National 5.3 5.1 4.9 4.7 4.4 4.1 3.9 4.2 4.5 4.5 4.6
State 10.6 10.3 10.4 10.2 9.7 9.0 8.8 9.7 10.3 11.0 9.6 8.2
Counties Like Us 12.8 12.7 13.1 12.8 12.3 11.3 11.3 12.7 13.4 14.2 12.8 11.3
Mason County 15.8 15.3 16.5 13.8 12.5 11.1 11.2 13.2 15.4 16.5 16.2 13.9
TANF Children 1,807 1,737 1,881 1,641 1,511 1,365 1,394 1,636 1,911 2,018 1,970 1,691
Children, birth-17 11,455 11,387 11,373 11,908 12,056 12,305 12,449 12,408 12,377 12,200 12,194 12,177
Updated
11/10/2014
Go to Indicator Comparison Profile
0
2
4
6
8
10
12
14
16
18
Mason County National State Counties Like Us
Note: The children (age birth-17) participating in Aid to Families (AFDC/TANF) programs in the fiscal year, per 100 children
(age birth-17). The population used is for the calendar year which ends the fiscal period. National TANF child recipients are
defined as children 0-19 with almost no children of age 19, therefore national denominators are for children 0-18. Suppression
code definitions for yearly rates are explained in Technical Notes.
State Source: Department of Social and Health Services, Research and Data Analysis, Automated Client Eligibility System and
Warrant Roll. Population Estimates: Washington State Office of Financial Management, Forecasting Division
National Source: U.S. Department of Health & Human Services, Administration for Children and Families, Office of Planning
Research and Evaluation: Characteristics and Financial Circumstances of TANF Recipients Table I-29
8
Washington State Department of Social and Health Services
Research and Data Analysis Division
Community Outcome and Risk Evaluation Information System (CORE). Jul 2015.
Community Domain: Extreme Family Economic Deprivation
Unemployed Persons (Age 16+)
Percent
2002 2003 2004 2005 2006 2007 2008 2009 2010 2011 2012 2013
National 5.8 6.0 5.5 5.1 4.6 4.6 5.8 9.3 9.6 8.9 8.1 7.4
State 7.3 7.4 6.3 5.5 5.0 4.5 5.3 8.9 9.6 9.2 8.2 7.0
Counties Like Us 8.7 8.6 7.3 6.6 6.0 5.7 6.8 10.7 11.3 11.1 10.2 9.5
Mason County 8.3 8.5 7.3 6.5 5.9 5.7 7.0 10.3 11.1 11.2 10.4 9.8
Unemployed, 16+ 1,810 1,950 1,730 1,560 1,450 1,440 1,800 2,610 2,820 2,750 2,500 2,290
Labor Force,16+ 21,850 22,910 23,790 24,110 24,540 25,110 25,690 25,440 25,380 24,530 24,050 23,480
Updated
5/20/2014
Go to Indicator Comparison Profile
0
2
4
6
8
10
12
Mason County National State Counties Like Us
Note: The unemployed persons (age 16 and over) per 100 persons in the civilian labor force. Unemployed persons are individuals
who are currently available for work have actively looked for work, and do not have a job. The civilian labor force includes
persons who are working or looking for work. The monthly numbers are a snapshot in time done approximately the 12th of each
month. A yearly estimate is then produced by averaging the monthly numbers. Historical data has been updated. Data for the latest
year should be considered preliminary. Suppression code definitions for yearly rates are explained in Technical Notes.
State Source: Employment Security Department, Labor Market and Economic Analysis, County Unemployment File
National Source: U.S. Department of Labor Bureau of Labor Statistics Labor Force Statistics from the Current Population Survey
9
Washington State Department of Social and Health Services
Research and Data Analysis Division
Community Outcome and Risk Evaluation Information System (CORE). Jul 2015.
Community Domain: Extreme Family Economic Deprivation
Students Eligible for Free or Reduced Price Lunch
Percent
2003 2004 2005 2006 2007 2008 2009 2010 2011 2012 2013 2014
National 30.8 31.8 37.4 42.0 41.7 42.0 44.6 47.5 47.9 43.3 43.5
State 34.8 36.2 37.1 37.7 36.8 38.0 39.0 42.2 43.8 45.2 45.9 45.5
Counties Like Us 38.7 40.6 41.9 43.0 40.5 43.0 44.0 48.2 49.6 51.4 53.5 53.3
Mason County 44.8 47.6 43.1 46.1 46.3 48.1 48.8 53.9 56.3 56.8 61.0 63.1
Eligible Students 3,662 3,911 3,513 3,808 3,865 3,944 3,947 4,324 4,530 4,484 4,742 4,900
Enrolled Students 8,176 8,209 8,152 8,254 8,354 8,208 8,091 8,027 8,041 7,895 7,770 7,762
Updated
4/10/2014
Go to Indicator Comparison Profile
0
10
20
30
40
50
60
70
Mason County National State Counties Like Us
Note: The students eligible for free or reduced price lunch per 100 students enrolled. Eligibility requirements are discussed in
Technical Notes.
State Source: Office of Superintendent of Public Instruction
10
Washington State Department of Social and Health Services
Research and Data Analysis Division
Community Outcome and Risk Evaluation Information System (CORE). Jul 2015.
Community Domain: Transitions and Mobility
Net Migration, 3 Year Moving Average
Rate Per
1,000
2003 2004 2005 2006 2007 2008 2009 2010 2011 2012 2013 2014
State 7.0 7.3 7.1 9.6 10.3 9.5 6.3 3.7 2.0 1.4 2.2 4.2
Counties Like Us 8.9 9.4 10.1 13.0 13.2 11.9 8.6 5.1 3.2 2.8 3.4 3.7
Mason County 16.1 20.4 22.2 24.7 27.3 26.2 21.4 13.0 7.5 5.9 5.5 4.1
Net Migration 808 1,036 1,209 1,386 1,584 1,558 1,287 790 456 360 341 253
All Persons 50,200 50,800 54,551 56,063 57,951 59,459 60,199 60,699 61,096 61,441 61,786 61,985
Updated
11/12/2014
Go to Indicator Comparison Profile
0
5
10
15
20
25
30
Mason County State Counties Like Us
Note: Net migration is the annual number of new residents that moved into an area minus the number of residents that moved out
of an area. In Washington, the Office of Financial Management estimates annual net migration for twelve months ending on
March 31st of a given year. For example, annual net migration in 2009 refers to the period from April 1, 2008 through March 31,
2009. Net migration can change a lot from year to year; calculating a 3-year moving average smoothes net migration. The net
migration rate in Year 3 is equal to the average of net migration in Years 1, 2, and 3, divided by the total population in Year 3.
The result is then multiplied by 1,000 to measure net migration rate per 1,000 persons.
State Source: Office of Financial Management, Net Migration Data
11
Washington State Department of Social and Health Services
Research and Data Analysis Division
Community Outcome and Risk Evaluation Information System (CORE). Jul 2015.
Community Domain: Transitions and Mobility
Existing Home Sales
Rate Per
1,000
2001 2002 2003 2004 2005 2006 2007 2008 2009 2010 2011 2012
National 18.7 19.6 21.5 23.2 24.0 21.7 18.8 16.2 16.8 13.5 13.7 14.8
State 18.2 19.3 22.4 24.0 25.3 22.5 18.5 12.9 12.7 12.6 12.9 11.7
Counties Like Us 21.3 24.4 29.0 33.0 35.3 30.4 24.0 16.7 15.3 15.7 16.2 11.5
Mason County 26.2 28.5 34.3 34.8 38.0 33.5 24.7 17.2 15.3 14.5 15.2 11.7
Sales 1,300 1,420 1,720 1,770 2,070 1,880 1,430 1,020 920 880 930 720
All Persons 49,600 49,799 50,200 50,800 54,551 56,063 57,951 59,459 60,199 60,699 61,096 61,441
Updated
12/19/2013
Go to Indicator Comparison Profile
0
5
10
15
20
25
30
35
40
Mason County National State Counties Like Us
Note: The previously-owned homes sold, per 1,000 persons (all ages). Previously-owned homes sold is rounded to the tens.
Existing homes sold are estimated based on data from multiple listing services, firms that monitor deeds, and local Realtors
associations. Adjustments were made by the data provider to remove refinanced, rather than sold homes from the counts of sales.
State Source: Washington Center for Real Estate Research, Washington State University, Washington State's Housing Market: A
Supply/Demand Assessment. Population Estimates: Washington State Office of Financial Management, Forecasting Division
National Source: US Census Bureau, Statistical Abstract of the US; Existing One-family Houses Sold
12
Washington State Department of Social and Health Services
Research and Data Analysis Division
Community Outcome and Risk Evaluation Information System (CORE). Jul 2015.
Community Domain: Transitions and Mobility
New Residence Construction
Rate Per
1,000
2001 2002 2003 2004 2005 2006 2007 2008 2009 2010 2011 2012
National 5.7 6.1 6.4 6.1 5.6 6.2 4.7 3.1 1.9 2.0 2.0 2.6
State 6.4 6.7 7.1 8.2 8.5 7.8 7.3 4.4 2.6 3.1 1.9 2.4
Counties Like Us 5.6 6.4 7.2 7.9 9.0 8.2 7.5 4.1 2.5 2.6 1.8 2.1
Mason County 7.9 8.6 9.6 10.7 11.6 9.8 7.5 4.2 2.7 2.3 2.2 2.0
New Residences 393 429 482 542 633 550 435 250 160 140 134 121
All Persons 49,600 49,799 50,200 50,800 54,551 56,063 57,951 59,459 60,199 60,699 61,096 61,441
Updated
12/19/2013
Go to Indicator Comparison Profile
0
2
4
6
8
10
12
14
Mason County National State Counties Like Us
Note: The new building permits issued for single and multi-family dwellings, per 1,000 persons (all ages). Each unit in a
multi-family dwelling (for example, each apartment in a building) has a separate building permit.
State Source: Washington Center for Real Estate Research, Washington State University, Washington State's Housing Market: A
Supply/Demand Assessment. Population Estimates: Washington State Office of Financial Management, Forecasting Division
National Source: US Census Bureau, Statistical Abstract of the US; New Privately Owned Housing Units Started
13
Washington State Department of Social and Health Services
Research and Data Analysis Division
Community Outcome and Risk Evaluation Information System (CORE). Jul 2015.
Community Domain: Antisocial Behavior of Community Adults
Alcohol- or Drug-Related Deaths
Percent
2002 2003 2004 2005 2006 2007 2008 2009 2010 2011 2012 2013
State 9.8 10.2 11.1 10.1 11.7 11.8 11.7 12.4 12.5 12.7 12.8 10.8
Counties Like Us 9.7 9.8 11.2 10.8 11.8 11.4 11.6 12.8 12.3 12.5 13.0 10.8
Mason County 12.0 11.1 12.1 12.3 13.8 10.7 11.7 14.5 15.1 12.0 16.3 11.9
AOD-related 57 59 65 72 81 64 67 80 87 74 99 77
Deaths 476 533 539 586 586 601 575 552 577 617 606 649
Updated
9/8/2014
Go to Indicator Comparison Profile
Note: The deaths, with alcohol- or drug-related causes, per 100 deaths. Evaluation is based on all contributory causes of death for
direct and indirect associations with alcohol and drug abuse. For a complete explanation of the codes and methods used please see
Technical Notes: Counting Alcohol- or Drug-related Deaths. Suppression code definitions for yearly rates are explained in
Technical Notes. Rates are not reported when fewer than 100 deaths occurred in an area.
State Source: Department of Health, Center for Health Statistics, Death Certificate Data File
0
2
4
6
8
10
12
14
16
18
Mason County State Counties Like Us
14
Washington State Department of Social and Health Services
Research and Data Analysis Division
Community Outcome and Risk Evaluation Information System (CORE). Jul 2015.
Community Domain: Antisocial Behavior of Community Adults
Clients of State-Funded Alcohol or Drug Services (Age 18+)
Rate Per
1,000
2002 2003 2004 2005 2006 2007 2008 2009 2010 2011 2012 2013
National 8.0 7.9 7.9 7.8 7.6 7.7 8.1 7.8 7.7 7.0
State 11.8 12.0 12.7 13.4 13.5 13.8 14.4 14.3 13.4 12.9 12.0 12.1
Counties Like Us 14.6 15.9 16.1 16.6 17.4 18.1 19.1 19.5 18.5 17.5 16.8 17.2
Mason County 19.9 20.8 21.5 19.1 18.7 19.3 19.9 21.1 17.4 17.5 16.9 18.6
Admits, 18+ 762 806 848 814 823 880 935 1,006 841 855 834 924
Persons, 18+ 38,344 38,813 39,426 42,643 44,007 45,647 47,010 47,791 48,322 48,896 49,247 49,609
Updated
11/6/2014
Go to Indicator Comparison Profile
0
5
10
15
20
25
Mason County National State Counties Like Us
Note: The adults (age 18 and over) receiving state-funded alcohol or drug services, per 1,000 adults. Counts of adults are
unduplicated so that those receiving services more than once during the year are only counted once for that year. State-funded
services include treatment, assessment, and detox. Persons in Department of Corrections treatment programs are not included.
State Source: Department of Social and Health Services, Division of Behavioral Health and Recovery, Treatment and
Assessment Report Generation Tool (TARGET). Population Estimates: Washington State Office of Financial Management,
Forecasting Division
National Source: Office of Applied Studies, Substance Abuse and Mental Health Services Administration, Treatment Episode
Data Set (TEDS)
15
Washington State Department of Social and Health Services
Research and Data Analysis Division
Community Outcome and Risk Evaluation Information System (CORE). Jul 2015.
Community Domain: Antisocial Behavior of Community Adults
Arrests (Age 18+), Alcohol-Related
Rate Per
1,000
2002 2003 2004 2005 2006 2007 2008 2009 2010 2011 2012 2013
National 13.0 11.2 11.0 10.6 11.0 10.9 11.1 10.6 10.1 9.0 8.9 7.9
State 11.3 11.8 11.8 10.6 10.7 10.4 9.6 9.9 9.3 9.4 7.3 6.7
Counties Like Us 9.5 9.5 8.1 6.7 6.5 6.6 6.9 6.5 5.3 4.8 3.0 3.7
Mason County 7.9 6.0 5.3 2.9 4.0 4.5 5.6 5.1 5.5 3.4 1.4 2.3
Arrests, 18+ 298 228 205 122 176 202 260 242 260 130 66 111
Adjusted Pop 18+ 37,879 37,823 38,958 42,160 43,518 45,153 46,515 47,294 47,609 37,965 48,546 48,906
Updated
10/7/2014
Go to Indicator Comparison Profile
0
2
4
6
8
10
12
14
Mason County National State Counties Like Us
Note: The alcohol violations (age 18+), per 1,000 adults (age 18+). Alcohol violations include all crimes involving driving under
the influence, liquor law violations, and drunkenness. DUI arrests by the Washington State Patrol are included in the state trend
analysis. However, they are not included in the county rankings since WSP arrests are not assigned to counties. Denominators are
adjusted by subtracting the population of police agencies that did not report arrests to WASPC. In spite of this population
adjustment, when the non-reporting police jurisdiction is where much of the crime occurs, the rate for the county will be lower
than it would be if that jurisdiction was included. For percent subtracted, suppression code definitions and the agencies not
reporting, see the Technical Notes and the appendix on Non-Reporting Agencies and Population.
The crimes types used within this rate are represented in both Summary UCR and NIBRS systems and are not likely to be
substantially impacted by the system change.
State Source: Washington Association of Sheriffs and Police Chiefs (WASPC): Uniform Crime Report (UCR), National
Incident-Based Reporting System (NIBRS)
Population Estimates: Washington State Office of Financial Management, Forecasting Division
National Source: US Department of Justice, Bureau of Justice Statistics Sourcebook of Criminal Justice Statistics Online
16
Washington State Department of Social and Health Services
Research and Data Analysis Division
Community Outcome and Risk Evaluation Information System (CORE). Jul 2015.
Community Domain: Antisocial Behavior of Community Adults
Arrests (Age 18+), Drug Law Violation
Rate Per
1,000
2002 2003 2004 2005 2006 2007 2008 2009 2010 2011 2012 2013
National 7.1 6.8 7.1 7.4 7.6 7.3 6.7 6.5 6.3 5.8 5.9 5.9
State 5.5 5.8 5.3 5.3 6.4 6.2 5.1 4.6 4.4 4.6 2.4 2.2
Counties Like Us 5.0 5.6 5.1 4.7 5.4 5.5 5.2 4.2 4.3 4.7 2.8 3.3
Mason County 4.7 4.1 5.1 5.2 4.3 5.5 6.6 3.9 2.9 3.4 1.8 2.2
Arrests, 18+ 179 155 197 220 187 246 305 182 140 128 89 109
Adjusted Pop 18+ 37,879 37,823 38,958 42,160 43,518 45,153 46,515 47,294 47,609 37,965 48,546 48,906
Updated
10/7/2014
Go to Indicator Comparison Profile
0
1
2
3
4
5
6
7
8
Mason County National State Counties Like Us
Note: The arrests of adults (age 18+) for drug law violations, per 1,000 adults (age 18+). Drug law violations include all crimes
involving sale, manufacturing, and possession of drugs. Denominators are adjusted by subtracting the population of police
agencies that did not report arrests to WASPC. In spite of this population adjustment, when the non-reporting police jurisdiction
is where much of the crime occurs, the rate for the county will be lower than it would be if that jurisdiction was included. For
percent subtracted, suppression code definitions and the agencies not reporting, see the Technical Notes and the appendix on
Non-Reporting Agencies and Population.
The crimes types used within this rate are represented in both Summary UCR and NIBRS systems and are not likely to be
substantially impacted by the system change.
State Source: Washington Association of Sheriffs and Police Chiefs (WASPC): Uniform Crime Report (UCR), National
Incident-Based Reporting System (NIBRS)
Population Estimates: Washington State Office of Financial Management, Forecasting Division
National Source: US Department of Justice, Bureau of Justice Statistics Sourcebook of Criminal Justice Statistics Online
17
Washington State Department of Social and Health Services
Research and Data Analysis Division
Community Outcome and Risk Evaluation Information System (CORE). Jul 2015.
Community Domain: Antisocial Behavior of Community Adults
Arrests (Age 18+), Violent Crime
Rate Per
1,000
2002 2003 2004 2005 2006 2007 2008 2009 2010 2011 2012 2013
National 2.8 2.3 2.3 2.3 2.3 2.2 2.2 2.2 2.0 2.0 1.9 1.9
State 1.5 1.6 1.6 1.6 1.5 1.5 1.5 1.6 1.6 1.6 1.5 1.5
Counties Like Us 1.9 1.8 2.3 1.9 1.7 1.7 1.8 1.7 1.6 1.6 1.2 1.6
Mason County 2.6 1.9 2.5 2.4 2.5 2.8 2.2 2.4 1.8 2.3 1.3 1.7
Arrests, 18+ 97 70 98 100 108 127 102 112 85 88 61 81
Adjusted Pop 18+ 37,879 37,823 38,958 42,160 43,518 45,153 46,515 47,294 47,609 37,965 48,546 48,906
Updated
10/7/2014
Go to Indicator Comparison Profile
0
1
1
2
2
3
3
Mason County National State Counties Like Us
Note: The arrests of adults (age 18+) for violent crime per 1,000 adults (age 18+). Violent crimes include all crimes involving
criminal homicide, forcible rape, robbery, and aggravated assault. Simple assault is not defined as a violent crime. Denominators
are adjusted by subtracting the population of police agencies that did not report arrests to WASPC. In spite of this population
adjustment, when the non-reporting police jurisdiction is where much of the crime occurs, the rate for the county will be lower
than it would be if that jurisdiction was included. For percent subtracted, suppression code definitions and the agencies not
reporting, see the Technical Notes and the appendix on Non-Reporting Agencies and Population.
The crimes types used within this rate are represented in both Summary UCR and NIBRS systems and are not likely to be
substantially impacted by the system change.
State Source: Washington Association of Sheriffs and Police Chiefs (WASPC): Uniform Crime Report (UCR), National
Incident-Based Reporting System (NIBRS)
Population Estimates: Washington State Office of Financial Management, Forecasting Division
National Source: US Department of Justice, Bureau of Justice Statistics Sourcebook of Criminal Justice Statistics Online
18
Washington State Department of Social and Health Services
Research and Data Analysis Division
Community Outcome and Risk Evaluation Information System (CORE). Jul 2015.
Community Domain: Low Neighborhood Attachment and Community Disorganization
Prisoners in State Correctional Systems (Age 18+)
Rate Per
100,000
2002 2003 2004 2005 2006 2007 2008 2009 2010 2011 2012 2013
National 476.0 482.0 486.0 491.0 501.0 506.0 504.0 502.0 497.0 492.0 480.0 478.0
State 143.1 198.1 291.9 346.6 366.6 411.3 403.0 400.1 400.4 367.9 401.6 465.7
Counties Like Us 168.4 209.1 253.0 343.0 377.7 446.3 415.4 437.4 493.3 523.3 633.8 761.1
Mason County 198.8 257.0 305.1 379.5 399.6 434.9 418.8 340.5 332.8 299.5 475.3 734.8
Prisoners, 18+ 99 129 155 207 224 252 249 205 202 183 292 454
All Persons 49,799 50,200 50,800 54,551 56,063 57,951 59,459 60,199 60,699 61,096 61,441 61,786
Updated
8/4/2014
Go to Indicator Comparison Profile
0
100
200
300
400
500
600
700
800
Mason County National State Counties Like Us
Note: The adult (age 18 and over) admissions to prison, per 100,000 persons (all ages). Admissions include new admissions,
re-admissions, community custody inmate violations, and parole violations. Counts of admissions are duplicated so that
individuals admitted to prison more than once in a year are counted each time they are admitted. The admissions are attributed to
the county where the conviction occurred. In 2003 prisoners being electronically monitored are included in the data. This causes
a jump in numbers for counties which use this incarceration option. Suppression code definitions for yearly rates are explained in
Technical Notes.
State Source: Department of Corrections, Inmates File. Population Estimates: Washington State Office of Financial
Management, Forecasting Division
19
Washington State Department of Social and Health Services
Research and Data Analysis Division
Community Outcome and Risk Evaluation Information System (CORE). Jul 2015.
Community Domain: Low Neighborhood Attachment and Community Disorganization
Population Not Registered to Vote
Percent
2003 2004 2005 2006 2007 2008 2009 2010 2011 2012 2013 2014
National 34.1 38.4 37.4 34.9 28.8
State 29.8 24.5 29.1 32.9 33.6 27.8 29.7 30.0 29.6 25.5 26.2 27.1
Counties Like Us 28.9 22.1 26.7 27.6 29.1 25.1 26.2 26.9 26.6 24.3 24.8 25.7
Mason County 29.8 21.2 27.4 30.5 34.0 30.2 30.8 31.0 31.2 28.4 29.2 29.5
Not Registered 11,568 8,343 11,683 13,436 15,531 14,182 14,706 14,978 15,233 13,979 14,463 14,708
Persons, 18+ 38,813 39,426 42,643 44,007 45,647 47,010 47,791 48,322 48,896 49,247 49,609 49,838
Updated
1/5/2015
Go to Indicator Comparison Profile
0
5
10
15
20
25
30
35
40
45
Mason County National State Counties Like Us
Note: The persons not registered to vote in the November elections, per 100 adults (age 18 and over). As part of the November
Current Population Survey (the Voting and Registration Supplement), the Bureau of the Census collects data on voting and
registration in years with presidential or congressional elections (i.e. every other year).
State Source: Office of the Secretary of State, Elections Division, Registered Voters. Population Estimates: Washington State
Office of Financial Management, Forecasting Division
National Source: Calculated using data from U.S. Census Bureau, Statistical Abstract of the United States; "Voting-Age
20
Washington State Department of Social and Health Services
Research and Data Analysis Division
Community Outcome and Risk Evaluation Information System (CORE). Jul 2015.
Community Domain: Low Neighborhood Attachment and Community Disorganization
Registered And Not Voting in the November Election
Percent
2003 2004 2005 2006 2007 2008 2009 2010 2011 2012 2013 2014
National 11.5 29.2 10.4 30.1 13.2
State 59.5 17.8 45.2 35.5 50.0 15.4 49.1 28.8 47.1 18.8 54.7 45.8
Counties Like Us 50.0 16.1 36.0 31.6 42.9 14.0 44.0 25.1 41.5 18.6 48.7 39.6
Mason County 56.7 16.9 37.2 29.7 38.5 12.6 43.5 24.0 40.7 18.6 48.8 40.5
Not Voting 15,441 5,247 11,518 9,067 11,607 4,130 14,404 7,997 13,684 6,555 17,133 14,227
Reg'd Voters 27,245 31,083 30,960 30,571 30,116 32,828 33,085 33,344 33,663 35,268 35,146 35,130
Updated
1/5/2015
Go to Indicator Comparison Profile
0
10
20
30
40
50
60
70
Mason County National State Counties Like Us
Note: The persons registered to vote in the November elections but not voting, per 100 adults (age 18 and over) registered to vote.
As part of the November Current Population Survey (the Voting and Registration Supplement), the Bureau of the Census collects
data on voting and registration in years with presidential or congressional elections (i.e. every other year).
State Source: Office of the Secretary of State, Elections Division, Registered Voters. Population Estimates: Washington State
Office of Financial Management, Forecasting Division
National Source: Calculated using data from U.S. Census Bureau, Statistical Abstract of the United States; "Voting-Age
Population, Percent Reporting Registered, and Voted"
21
Washington State Department of Social and Health Services
Research and Data Analysis Division
Community Outcome and Risk Evaluation Information System (CORE). Jul 2015.
Family Domain: Family Problems
Divorce
Rate Per
1,000
2002 2003 2004 2005 2006 2007 2008 2009 2010 2011 2012 2013
State 5.9 5.5 5.6 5.4 5.1 5.0 4.8 4.9 5.2 5.1 4.9 4.8
Counties Like Us 6.1 6.1 6.1 5.7 5.1 5.2 5.0 4.9 5.2 5.2 5.0 4.8
Mason County 6.1 6.2 6.1 6.1 4.7 5.0 4.8 4.9 5.1 5.0 4.6 5.1
Divorces 248 254 255 272 219 241 238 247 258 256 235 263
Persons, 15+ 40,568 41,035 41,653 44,904 46,311 47,998 49,343 50,056 50,551 50,996 51,351 51,673
Updated
11/13/2014
Go to Indicator Comparison Profile
0
1
2
3
4
5
6
7
Mason County State Counties Like Us
Note: The divorces per 1,000 persons (age 15 and over). Divorce includes dissolutions, annulments, and unknown decree types; it
does not include legal separations. Divorce data is reported by the woman's residence, if in Washington at the time of decree. If the
woman lived outside Washington, the man's residence was used. If both parties residence was unknown the event is not assigned
to a county, but is included in the state rate. The National rate is based on age 18 and over population. Suppression code
definitions for yearly rates are explained in Technical Notes.
State Source: Department of Health, Center for Health Statistics, Dissolution and Annulment Data. Population Estimates:
Washington State Department of Health
National Source: Calculated using Department of Health and Human Services, Centers for Disease Control and Prevention,
National Center for Health Statistics, National Vital Statistics System, National Vital Statistics Reports Births, Marriages,
Divorces, and Deaths, Provisional Data
22
Washington State Department of Social and Health Services
Research and Data Analysis Division
Community Outcome and Risk Evaluation Information System (CORE). Jul 2015.
Family Domain: Family Problems
Victims of Child Abuse and Neglect in Accepted Referrals
Rate Per
1,000
2003 2004 2005 2006 2007 2008 2009 2010 2011 2012 2013 2014
National 46.3 47.7 48.3 47.9 47.2 49.4 48.1 44.5 41.9 52.1
State 40.9 38.1 35.0 34.1 34.0 31.6 32.0 31.8 33.9 34.3 34.4 32.4
Counties Like Us 63.4 54.7 53.8 45.7 44.7 40.3 42.0 45.1 46.1 49.2 51.3 47.5
Mason County 67.4 61.2 48.0 47.0 55.8 43.6 47.7 52.4 57.1 49.3 54.0 45.8
Accepted Victims 767 696 572 566 686 543 592 649 696 601 657 556
Persons, birth-17 11,387 11,373 11,908 12,056 12,305 12,449 12,408 12,377 12,200 12,194 12,177 12,147
Updated
6/15/2015
Go to Indicator Comparison Profile
0
10
20
30
40
50
60
70
80
Mason County National State Counties Like Us
Note: The children (age birth-17) identified as victims in reports to Child Protective Services that were accepted for further
action, per 1,000 children (age birth-17). Children are counted more than once if they are reported as a victim more than once
during the year. A "referral" is a report of suspected child abuse which may have multiple listed victims. Numbers may differ due
to corrections or changes in location definition made in the database extraction process. Child location is derived from the
residence at the time of referral. Suppression code definitions for yearly rates are explained in Technical Notes.
State Source: Department of Social and Health Services, Children's Administration FamLink Data Warehouse. Population
Estimates: Washington State Office of Financial Management, Forecasting Division
National Source: US Department of Health and Human Services Administration for Children and Families, Voluntary
Cooperative Information System(VCIS), and estimates from Adoption, Foster Care Analysis Reporting System(AFCARS)
23
Washington State Department of Social and Health Services
Research and Data Analysis Division
Community Outcome and Risk Evaluation Information System (CORE). Jul 2015.
School Domain: Academic Achievement
Poor Academic Performance, Grade 10
Percent
2002 2003 2004 2005 2006 2007 2008 2009 2010 2011 2012 2013
State 69.8 66.4 72.7 57.5 63.9 63.0 62.8 65.0 75.6 50.9 40.1 31.6
Counties Like Us 73.3 70.6 76.1 61.9 67.7 67.6 68.2 70.7 79.3 55.6 43.3 36.1
Mason County 69.6 71.5 81.2 64.2 66.4 68.0 71.8 74.9 85.9 56.9 46.6 41.4
Low Scorers 470 481 527 423 334 302 316 304 743 252 218 207
Tested, 10th grade 675 673 649 659 503 444 440 406 865 443 468 500
Updated
4/14/2014
Go to Indicator Comparison Profile
0
10
20
30
40
50
60
70
80
90
100
Mason County State Counties Like Us
Note: The students tested who failed one or more content areas as a percent of all students tested at the 10th grade level. Some
districts have chosen to test students in both grades 9 and 10 for the 10th grade assessment. All students being tested at the 10th
grade level are included in these data regardless of their grade placement. Tests are given in the spring of the year. For example,
data for 2008 is for students in the 10th grade during the school year 2007/2008. By contractual agreement data is suppressed
when less than ten students were tested to avoid individual student identification.
In 2009-10 the tenth grade WASL was replaced by the High School Proficiency Exam (HSPE). This test was built on the same
framework as the WASL, but contain fewer questions. It is considered equivalent by OSPI.
State Source: Office of Superintendent of Public Instruction, Instructional Programs, Curriculum and Assessment, Grade 10
Failing In One Or More Content Areas.
24
Washington State Department of Social and Health Services
Research and Data Analysis Division
Community Outcome and Risk Evaluation Information System (CORE). Jul 2015.
School Domain: Academic Achievement
Poor Academic Performance, Grade 7
Percent
2002 2003 2004 2005 2006 2007 2008 2009 2010 2011 2012 2013
State 77.9 72.8 63.8 58.7 60.1 53.9 57.4 58.3 56.4 57.0 49.6 47.8
Counties Like Us 80.7 75.8 67.7 62.9 63.3 59.5 64.2 64.7 62.6 64.0 55.0 53.3
Mason County 84.2 80.1 72.1 69.0 73.9 66.6 68.6 74.4 68.0 70.7 57.5 57.2
Low Scorers 545 550 491 442 427 407 410 450 422 424 331 324
Tested, 7th grade 647 687 681 641 578 611 598 605 621 600 576 566
Updated
4/14/2014
Go to Indicator Comparison Profile
0
10
20
30
40
50
60
70
80
90
Mason County State Counties Like Us
Note: The students tested who failed one or more content areas as a percent of all students tested at the 7th grade level. Tests are
given in the spring of the year. Data for 2008 is for students in the 7th grade during the school year 2007/2008. By contractual
agreement data is suppressed when less than ten students were tested to avoid individual student identification.
In 2009-10 the 7th grade WASL was replaced by Measurements of Student Progress (MSP). This test was built on the same
framework as the WASL, but contain fewer questions. It is considered equivalent by OSPI.
State Source: Office of Superintendent of Public Instruction, Instructional Programs, Curriculum and Assessment, Grade 7
Failing In One Or More Content Areas.
25
Washington State Department of Social and Health Services
Research and Data Analysis Division
Community Outcome and Risk Evaluation Information System (CORE). Jul 2015.
School Domain: Academic Achievement
Poor Academic Performance, Grade 4
Percent
2002 2003 2004 2005 2006 2007 2008 2009 2010 2011 2012 2013
State 70.9 65.6 56.4 54.8 52.8 54.1 56.5 58.3 59.8 55.0 54.3 51.7
Counties Like Us 76.6 71.0 63.1 61.2 59.2 61.8 64.1 65.7 68.4 63.4 62.9 60.4
Mason County 81.5 78.8 65.5 66.2 67.0 66.3 71.6 72.8 70.7 69.5 67.0 65.8
Low Scorers 486 464 387 391 356 380 408 420 442 391 374 360
Tested, 4th grade 596 589 591 591 531 573 570 577 625 563 558 547
Updated
4/14/2014
Go to Indicator Comparison Profile
0
10
20
30
40
50
60
70
80
90
Mason County State Counties Like Us
Note: The students tested who failed one or more content areas as a percent of all students tested at the 4th grade level. Tests are
given in the spring of the year. Data for 2008 is for students in the 4th grade during the school year 2007/2008. By contractual
agreement data is suppressed when less than ten students were tested to avoid individual student identification.
In 2009-10 the 4th grade WASL was replaced by Measurements of Student Progress (MSP). This test was built on the same
framework as the WASL, but contain fewer questions. It is considered equivalent by OSPI.
State Source: Office of Superintendent of Public Instruction, Instructional Programs, Curriculum and Assessment, Grade 4
Failing In One Or More Content Areas.
26
Washington State Department of Social and Health Services
Research and Data Analysis Division
Community Outcome and Risk Evaluation Information System (CORE). Jul 2015.
School Domain: Academic Achievement
High school Cohort (Cumulative) Dropouts
Percent
2003 2004 2005 2006 2007 2008 2009 2010 2011 2012 2013 2014
National 15.1 16.7 15.7
State 21.4 21.0 21.4 19.4 17.6 13.9 13.6 13.0 12.3
Counties Like Us 24.3 27.5 31.2 28.5 29.4 21.9 16.6 19.9 17.6
Mason County 27.1 26.5 29.8 20.3 17.7 14.6 14.0 12.2 12.2
204.00 196.00 228.00 136.00 106.00 . . . .
2,826 2,749 2,729 2,573 2,490 . . . .
Updated
3/25/2015
Go to Indicator Comparison Profile
0
5
10
15
20
25
30
35
Mason County National State Counties Like Us
Note: The percent of students dropping out prior to graduation. The High School Cohort Dropout rate (may also be referred to as
the longitudinal, cumulative, or freshmen cohort dropout rate) measures what happens to a single group (or cohort) of students
over a period of time. This rate is most useful for seeing the long-term impact on the community. The Estimated Cohort (old
method) rate formula used data from multiple grades in a single year. The Adjusted Cohort (new method) rate is the number of
students in the same freshman cohort dropping out prior to graduation divided by the adjusted freshman class cohort of the
graduates. Beginning with the 9-grade cohort due to graduate in the 2010/2011 school year, OSPI has started using the actual
cohort of students for their calculations.
For more information on the changes in rate computation and cohort methodology, see the Technical Notes.
State Source: Office of Superintendent of Public Instruction, Graduation and Dropout Statistics for Washington.
Estimated Cohort Method Adjusted Freshman Cohort Method
27
Washington State Department of Social and Health Services
Research and Data Analysis Division
Community Outcome and Risk Evaluation Information System (CORE). Jul 2015.
School Domain: Academic Achievement
Annual (Event) Dropouts
Percent
2001 2002 2003 2004 2005 2006 2007 2008 2009 2010 2011 2012
National 3.9 4.4 4.1 4.1
State 5.7 5.6 5.6 5.1 4.6 4.4 4.1
Counties Like Us 6.5 7.5 8.7 7.9 8.2 7.9 7.7
Mason County 7.2 7.1 8.4 5.3 4.3 4.2 3.9
Dropouts 204 196 228 136 106 107 94
Students 2,826 2,749 2,729 2,573 2,490 2,525 2,424
Updated
3/25/2015
Go to Indicator Comparison Profile
0
1
2
3
4
5
6
7
8
9
10
Mason County National State Counties Like Us
Note: The Annual Dropout rate measures the proportion of students enrolled in grades 9-12 who drop out in a single year without
completing high school as a percentage of all students in grades 9 through 12 that year. When districts try new policies or projects
to keep students in school the impact of those actions will be more immediately visible in this rate. This rate is much more time
intensive to compute with the new cohort designations for students as it draws information from four separate cohorts. This
indicator will have a break in data production while data collection transitions to using the adjusted cohort for most other
calculations. The formula for this indicator has not changed.
For more information on the changes in rate computation and cohort methodology, see the Technical Notes.
State Source: Office of Superintendent of Public Instruction, Graduation and Dropout Statistics for Washington.
28
Washington State Department of Social and Health Services
Research and Data Analysis Division
Community Outcome and Risk Evaluation Information System (CORE). Jul 2015.
School Domain: Academic Achievement
On-time Graduation
Percent
2003 2004 2005 2006 2007 2008 2009 2010 2011 2012 2013 2014
National 73.4 73.9 74.7 75.5 76.3
State 70.5 72.5 72.0 73.5 76.5 76.6 77.2 76.0 77.2
Counties Like Us 66.2 65.5 60.8 61.6 66.8 67.0 71.6 67.2 70.0
Mason County 59.1 64.7 40.8 68.8 81.2 68.5 66.8 72.7 72.3
Updated
3/25/2015
Go to Indicator Comparison Profile
0
10
20
30
40
50
60
70
80
90
Mason County National State Counties Like Us
Note: The percent of students who graduate in four years by completion of the graduation requirements. The Adjusted Cohort
(new method) rate divides the number of students in the same freshman cohort graduating in their fourth year by the adjusted
freshman cohort for those students. In this method there are no adjustments for Special Ed or Limited English students who are
expected to take longer, and transfers from out of state or other districts who are credit deficient may not be reclassified into a
lower grade. Prior to the 2011 the Estimated Cohort method used a complex formula to estimate the graduation rate from data for
multiple grades during the graduation year. The differences in graduation rates from 2010 to 2011 is likely to be due to the change
in computation method.
For more information on the changes in rate computation and cohort methodology, see the Technical Notes.
State Source: Office of Superintendent of Public Instruction, Graduation and Dropout Statistics for Washington.
Estimated Cohort Method Adjusted Freshman Cohort Method
29
Washington State Department of Social and Health Services
Research and Data Analysis Division
Community Outcome and Risk Evaluation Information System (CORE). Jul 2015.
School Domain: Academic Achievement
Extended Graduation
Percent
2003 2004 2005 2006 2007 2008 2009 2010 2011 2012 2013 2014
State 75.1 77.5 77.1 79.2 82.6 78.2 78.9 78.8 79.9
Counties Like Us 71.0 70.4 65.3 66.4 73.1 69.8 69.7 68.8 72.1
Mason County 62.7 70.3 46.3 77.3 92.6 73.6 76.4 79.4 80.7
Updated
3/25/2015
Go to Indicator Comparison Profile
0
10
20
30
40
50
60
70
80
90
100
Mason County State Counties Like Us
Note: The percent of students who graduate including those students who stay in school and take more than four years to
complete their degree. The Estimated Cohort (old method) Extended Graduation rate formula is: (the number of on-time and late
graduates in the same year)/(the number of on-time graduates divided by the on-time graduation rate). The Adjusted Cohort (new
method) rate is the number of students graduating within five years divided by the adjusted freshman cohort for the graduates. The
new method does not include graduates after year 5 to the extended graduation rate.
For more information on the changes in rate computation and cohort methodology, see the Technical Notes.
State Source: Office of Superintendent of Public Instruction, Graduation and Dropout Statistics for Washington.
Estimated Cohort Method Adjusted Freshman Cohort Method
30
Washington State Department of Social and Health Services
Research and Data Analysis Division
Community Outcome and Risk Evaluation Information System (CORE). Jul 2015.
Problem Outcomes: School Climate
Weapons Incidents in School
Rate Per
1,000
2003 2004 2005 2006 2007 2008 2009 2010 2011 2012 2013 2014
State 2.9 2.8 3.0 3.3 3.1 2.9 2.9 2.8 2.7 2.6 2.0 1.9
Counties Like Us 3.5 3.5 3.5 3.5 3.4 3.7 3.3 3.1 2.6 2.6 2.1 1.9
Mason County 5.9 3.9 4.2 3.9 6.1 3.8 5.7 6.6 3.7 4.7 2.1 2.5
Incidents 48 32 34 32 51 32 47 54 30 38 17 20
Enrollment 8,176 8,209 8,152 8,254 8,354 8,331 8,242 8,174 8,198 8,100 7,965 7,974
Updated
5/8/2015
Go to Indicator Comparison Profile
0.0
1.0
2.0
3.0
4.0
5.0
6.0
7.0
Mason County State Counties Like Us
Note: The reported incidents involving guns and other weapons at any grade level per 1000 students enrolled in October of all
grades.
State Source: Office of Superintendent of Public Instruction, Information Services, Safe and Drug-free Schools: Report to the
Legislature on Weapons in Schools RCW 28A.320.130
31
Washington State Department of Social and Health Services
Research and Data Analysis Division
Community Outcome and Risk Evaluation Information System (CORE). Jul 2015.
Problem Outcomes: School Climate
Unexcused Absences for Students in Grades 1 to 8
Rate Per
1,000
2002 2003 2004 2005 2006 2007 2008 2009 2010 2011 2012 2013
State 4.5 4.2 4.3 3.9 3.8 3.8 3.6 3.8 4.3 5.1
Counties Like Us 6.1 4.7 4.3 3.8 3.9 3.5 3.9 4.1 4.7 5.9
Mason County 11.4 5.0 5.7 6.8 5.0 5.6 7.3 4.8 5.5 5.6
Absences 9,392 4,030 4,566 5,418 3,989 4,406 5,934 3,787 4,365 4,261
Potential Days 825,182 801,825 797,097 802,347 803,384 788,759 812,486 792,412 791,541 761,503
Updated
10/16/2013
Go to Indicator Comparison Profile
0
2
4
6
8
10
12
Mason County State Counties Like Us
Note: The unexcused absences for students in grades 1-8 per thousand potential school days. Potential school days are the
number of days students were taught from the first day of school through May 31 in each school building multiplied by the net
served students in grades 1-8 in that building. The definition of an unexcused absence is a local decision, so the definition differs
among schools and districts. In general, a student who has an unexcused absence has not attended a majority of hours or periods
in a school day, or has not complied with a more restrictive district policy, and has not met the conditions for an excused absence
(see RCW 28A.225.020).
State Source: Office of Superintendent of Public Instruction, Washington State Report Card, Unexcused Absence Files.
32
Washington State Department of Social and Health Services
Research and Data Analysis Division
Community Outcome and Risk Evaluation Information System (CORE). Jul 2015.
Individual/Peer Domain: Early Criminal Justice Involvement
Arrests (Age 10-14), Alcohol- or Drug-Related
Rate Per
1,000
2002 2003 2004 2005 2006 2007 2008 2009 2010 2011 2012 2013
National 2.5 2.3 2.3 2.1 2.2 2.1 2.0 2.0 2.0 1.7 1.6 1.3
State 3.1 3.1 3.0 2.6 2.6 2.7 2.4 2.4 2.8 2.8 2.0 1.9
Counties Like Us 5.5 6.0 5.0 4.4 5.2 5.4 4.0 4.1 4.0 5.1 3.0 3.7
Mason County 3.4 3.8 2.9 2.3 3.2 8.9 5.8 3.5 2.6 4.8 1.8 0.6
Arrests, 10-14 12 13 10 8 11 31 20 12 9 13 6 2
Adjusted Pop 10-14 3,486 3,430 3,468 3,506 3,479 3,482 3,476 3,445 3,403 2,726 3,421 3,398
Updated
10/7/2014
Go to Indicator Comparison Profile
0
1
2
3
4
5
6
7
8
9
10
Mason County National State Counties Like Us
Note: The arrests of younger adolescents (age 10-14) for alcohol and drug law violations, per 1,000 adolescents (age
10-14). Alcohol violations include all crimes involving driving under the influence, liquor law violations, and drunkenness.
For children, arrests for liquor law violations are usually arrests for minor in possession. Drug law violations include all
crimes involving sale, manufacturing, and possession of drugs.
1) Denominators are adjusted by subtracting the population of police agencies that did not report arrests to UCR/NIBRS. In
spite of this population adjustment, when the non-reporting police jurisdiction is where much of the crime occurs, the rate
for the county will be lower than it would be if that jurisdiction was included. For percent subtracted, suppression code
definitions and the agencies not reporting, see the Technical Notes and the appendix on Non-Reporting Agencies and
Population.
2) The DUI portion of this measure is likely understated, because arrests made by the State Patrol are not attributable to
counties. State Patrol arrests are included in the state rates.
The crimes types used within this rate are represented in both Summary UCR and NIBRS systems and are not likely to be
substantially impacted by the system change.
State Source: Washington Association of Sheriffs and Police Chiefs (WASPC): Uniform Crime Report (UCR), National
Incident-Based Reporting System (NIBRS)
Population Estimates: Washington State Office of Financial Management, Forecasting Division
National Source: US Department of Justice, Bureau of Justice Statistics Sourcebook of Criminal Justice Statistics Online
33
Washington State Department of Social and Health Services
Research and Data Analysis Division
Community Outcome and Risk Evaluation Information System (CORE). Jul 2015.
Individual/Peer Domain: Early Criminal Justice Involvement
Arrests (Age 10-14), Vandalism
Rate Per
1,000
2002 2003 2004 2005 2006 2007 2008 2009 2010 2011 2012 2013
National 2.3 2.1 2.0 2.0 2.2 2.2 2.1 1.7 1.4 1.2 1.1 0.9
State 2.3 2.4 2.4 2.2 2.2 2.4 2.4 1.7 1.6 1.6 1.2 1.0
Counties Like Us 2.8 3.0 2.9 2.8 3.1 3.3 3.4 2.3 2.2 2.9 1.0 1.5
Mason County 2.0 0.3 4.3 0.9 1.2 1.7 2.9 1.7 2.4 1.8 0.6 0.3
Arrests, 10-14 7 1 15 3 4 6 10 6 8 5 2 1
Adjusted Pop 10-14 3,486 3,430 3,468 3,506 3,479 3,482 3,476 3,445 3,403 2,726 3,421 3,398
Updated
10/7/2014
Go to Indicator Comparison Profile
0
1
1
2
2
3
3
4
4
5
5
Mason County National State Counties Like Us
Note: The arrests of younger adolescents (age 10-14) for vandalism (including residence, non-residence, vehicles,
venerated objects, police cars, or other) per 1,000 adolescents (age 10-14). Denominators are adjusted by subtracting the
population of police agencies that did not report arrests to UCR/NIBRS. In spite of this population adjustment, when the
non-reporting police jurisdiction is where much of the crime occurs, the rate for the county will be lower than it would be if
that jurisdiction was included. For percent subtracted, suppression code definitions and the agencies not reporting, see the
Technical Notes and the appendix on Non-Reporting Agencies and Population.
The crimes types used within this rate are represented in both Summary UCR and NIBRS systems and are not likely to be
substantially impacted by the system change.
State Source: Washington Association of Sheriffs and Police Chiefs (WASPC): Uniform Crime Report (UCR), National
Incident-Based Reporting System (NIBRS)
Population Estimates: Washington State Office of Financial Management, Forecasting Division
National Source: US Department of Justice, Bureau of Justice Statistics Sourcebook of Criminal Justice Statistics Online
34
Washington State Department of Social and Health Services
Research and Data Analysis Division
Community Outcome and Risk Evaluation Information System (CORE). Jul 2015.
Individual/Peer Domain: Early Criminal Justice Involvement
Total Arrests of Adolescents (Age 10-14)
Rate Per
1,000
2002 2003 2004 2005 2006 2007 2008 2009 2010 2011 2012 2013
National 36.8 32.3 32.6 32.5 30.9 29.6 28.4 25.4 21.2 18.9 17.3 14.8
State 27.8 27.9 26.6 23.2 22.1 21.3 20.0 17.8 17.8 16.8 12.4 11.9
Counties Like Us 39.6 39.2 35.8 29.0 30.7 29.5 29.1 25.7 22.4 25.0 14.1 16.9
Mason County 27.0 27.4 40.4 31.7 34.8 34.8 30.8 20.9 16.5 19.4 9.1 7.4
Arrests, 10-14 94 94 140 111 121 121 107 72 56 53 31 25
Adjusted Pop 10-14 3,486 3,430 3,468 3,506 3,479 3,482 3,476 3,445 3,403 2,726 3,421 3,398
Updated
10/7/2014
Go to Indicator Comparison Profile
0
5
10
15
20
25
30
35
40
45
Mason County National State Counties Like Us
Note: The arrests of adolescents (age 10-14) for any crime, per 1,000 adolescents (age 10-14).
Washington State has transitioned from Summary UCR to the NIBRS system for reporting. Summary UCR collects eight (8)
Part One Crime offenses: criminal homicide, forcible rape, robbery, aggravated assault, burglary, larceny, motor vehicle theft
and arson. NIBRS collects information on twenty-three (23) different offenses, including all Part One Crimes plus others
including forcible and non-forcible sex offenses, fraud, kidnapping, and drug violations. Care must be taken when
interpreting the yearly trend of "total arrest" rates for an area. In areas where large amounts of arrests are likely for crimes
not previously reported, a substantial increase in total arrests could be expected starting with the 2012 data.
Denominators are adjusted by subtracting the population of police agencies that did not report arrests to WASPC. For more
information, see the Technical Notes and the appendix on Non-Reporting Agencies and Population.
State Source: Washington Association of Sheriffs and Police Chiefs (WASPC): Uniform Crime Report (UCR), National
Incident-Based Reporting System (NIBRS) Population Estimates: Washington State Office of Financial Management,
Forecasting Division
National Source: US Department of Justice, Bureau of Justice Statistics Sourcebook of Criminal Justice Statistics Online
Summary UCR NIBRS
35
Washington State Department of Social and Health Services
Research and Data Analysis Division
Community Outcome and Risk Evaluation Information System (CORE). Jul 2015.
Problem Outcomes: Child or Family Health
Injury or Accident Hospitalizations for Children
Percent
2002 2003 2004 2005 2006 2007 2008 2009 2010 2011 2012 2013
State 3.7 3.3 3.9 4.2 4.0 3.9 4.0 4.1 4.2 4.3 4.5 4.4
Counties Like Us 4.4 4.0 4.6 4.9 4.4 4.2 4.1 4.2 4.1 4.2 4.4 4.4
Mason County 6.1 4.3 5.1 5.6 5.5 5.2 4.2 4.9 3.6 3.7 5.8 5.7
Injuries 48 35 41 52 50 47 37 49 30 31 53 45
Hospitalizations 790 808 801 928 910 907 880 1,010 844 832 913 788
Updated
8/24/2014
Go to Indicator Comparison Profile
0
1
2
3
4
5
6
7
Mason County State Counties Like Us
Note: The child injury or accident hospitalizations as a percent of all hospitalizations for children (age birth-17). Suppression
code definitions for yearly rates are explained in Technical Notes. Due to contractual agreement data may not be displayed for
areas with less than 100 hospitalizations.
State Source: Department of Health, Office of Hospital and Patient Data Systems, Comprehensive Hospital Abstract Reporting
System (CHARS)
36
Washington State Department of Social and Health Services
Research and Data Analysis Division
Community Outcome and Risk Evaluation Information System (CORE). Jul 2015.
Problem Outcomes: Child or Family Health
Infant Mortality (Under 1 Year)
Rate Per
100,000
2002 2003 2004 2005 2006 2007 2008 2009 2010 2011 2012 2013
National 700.9 700.0 680.8 686.7 682.3 690.1 657.7 639.4 614.7 602.6 590.9
State 573.3 567.5 569.1 484.2 468.0 469.9 551.5 484.2 418.2 420.6 479.7 436.7
Counties Like Us 663.4 533.4 798.1 379.6 392.0 285.4 645.3 362.2 447.2 407.4 437.7 584.3
Mason County 382.4 192.3 1338.4 844.6 660.1 473.2 301.2 294.6 583.9 149.7 599.7 445.8
Deaths, infants 2 1 7 5 4 3 2 2 4 1 4 3
Infants < 1 year 523 520 523 592 606 634 664 679 685 668 667 673
Updated
9/8/2014
Go to Indicator Comparison Profile
0
200
400
600
800
1000
1200
1400
1600
Mason County State Counties Like Us National
Note: The deaths, of infants under one year of age, per 100,000 population of infants under one year of age. Suppression code
definitions for yearly rates are explained in Technical Notes. Rates are not reported when fewer than 100 deaths occurred in an
area.
State Source: Department of Health, Center for Health Statistics, Death Certificate Data File. Population Estimates: Washington
State Office of Financial Management, Forecasting Division
National Source: U.S. Department of Health and Human Services, Centers for Disease Control and Health Statistics
National Center for Health Statistics, Division of Health Services, National Vital Statistics Reports
37
Washington State Department of Social and Health Services
Research and Data Analysis Division
Community Outcome and Risk Evaluation Information System (CORE). Jul 2015.
Problem Outcomes: Child or Family Health
Child Mortality (Ages 1-17)
Rate Per
100,000
2002 2003 2004 2005 2006 2007 2008 2009 2010 2011 2012 2013
State 23.4 22.3 20.5 19.2 17.6 16.7 18.1 16.1 16.2 15.2 16.3 15.4
Counties Like Us 26.2 24.9 24.3 29.0 21.5 20.7 17.9 16.6 25.1 20.1 20.2 18.0
Mason County 45.7 27.6 36.9 53.0 17.5 25.7 42.4 25.6 17.1 26.0 34.7 17.4
Child Deaths 5 3 4 6 2 3 5 3 2 3 4 2
Children (age 1-17) 10,931 10,867 10,851 11,317 11,450 11,671 11,786 11,729 11,692 11,532 11,528 11,504
Updated
9/8/2014
Go to Indicator Comparison Profile
0
10
20
30
40
50
60
Mason County State Counties Like Us
Note: The deaths, of children 1 to 17 years of age, per 100,000 population of children 1 to 17 years of age. Suppression code
definitions for yearly rates are explained in Technical Notes. Rates are not reported when fewer than 100 deaths occurred in an
area.
State Source: Department of Health, Center for Health Statistics, Death Certificate Data File. Population Estimates: Washington
State Office of Financial Management, Forecasting Division
38
Washington State Department of Social and Health Services
Research and Data Analysis Division
Community Outcome and Risk Evaluation Information System (CORE). Jul 2015.
Problem Outcomes: Child or Family Health
Births to School-Age (10-17) Mothers
Rate Per
1,000
2002 2003 2004 2005 2006 2007 2008 2009 2010 2011 2012 2013
National 9.0 8.6 8.6 8.5 8.9 9.0 8.8 8.1 7.0 6.1 5.6
State 6.5 6.0 6.1 5.9 6.1 6.6 6.3 5.6 5.1 4.6 4.2 3.5
Counties Like Us 8.3 7.8 7.4 8.2 8.7 9.1 7.7 6.8 6.0 5.9 5.1 3.9
Mason County 11.3 8.8 8.1 10.9 9.8 10.8 9.1 10.0 5.8 9.3 11.5 4.1
Birthed, 10-17 32 25 23 31 28 31 26 28 16 25 31 11
Females, 10-17 2,842 2,838 2,832 2,842 2,846 2,865 2,850 2,795 2,770 2,702 2,703 2,671
Updated
11/12/2014
Go to Indicator Comparison Profile
0
2
4
6
8
10
12
14
Mason County National State Counties Like Us
Note: The live births to adolescents (age 10-17) per 1,000 females (age 10-17). Rate changes in data result from on-going updates
to birth records. Suppression code definitions for yearly rates are explained in Technical Notes. Due to contractual agreement
data may not be displayed for areas with less than 100 births.
State Source: Department of Health, Center for Health Statistics, Birth Certificate Data File. Population Estimates: Washington
State Office of Financial Management, Forecasting Division
National Source: U.S. Department of Health and Human Services, Centers for Disease Control and Health Statistics
National Center for Health Statistics, Division of Health Services, National Vital Statistics Reports
39
Washington State Department of Social and Health Services
Research and Data Analysis Division
Community Outcome and Risk Evaluation Information System (CORE). Jul 2015.
Problem Outcomes: Child or Family Health
Sexually Transmitted Disease Cases (Birth-19)
Rate Per
1,000
2003 2004 2005 2006 2007 2008 2009 2010 2011 2012 2013 2014
State 4.1 3.9 4.0 3.7 3.8 4.2 4.1 3.9 4.1 4.1 3.8 3.9
Counties Like Us 3.6 3.9 3.7 3.6 3.3 4.1 3.8 3.7 3.7 4.1 4.1 4.2
Mason County 3.8 3.0 4.2 3.8 3.2 4.1 3.7 3.5 4.3 4.1 4.0 5.4
Cases, birth-19 48 38 56 51 44 57 51 49 58 55 54 72
Persons, birth-19 12,695 12,697 13,279 13,441 13,733 13,917 13,894 13,836 13,661 13,521 13,436 13,416
Updated
5/11/2015
Go to Indicator Comparison Profile
0
1
2
3
4
5
6
Mason County State Counties Like Us
Note: The reported cases of gonorrhea, syphilis, or chlamydia in children (age birth-19) per 1,000 adolescents (age birth-19).
Suppression code definitions for yearly rates are explained in Technical Notes. Due to contractual agreement data may not be
displayed for populations less than 100.
State Source: Department of Health, Sexually Transmitted Disease (STD) Services, Sexually Transmitted Disease Reported
Cases. Population Estimates: Washington State Office of Financial Management, Forecasting Division
40
Washington State Department of Social and Health Services
Research and Data Analysis Division
Community Outcome and Risk Evaluation Information System (CORE). Jul 2015.
Problem Outcomes: Child or Family Health
Suicide and Suicide Attempts (Age 10-17)
Rate Per
100,000
2002 2003 2004 2005 2006 2007 2008 2009 2010 2011 2012 2013
State 50.4 42.7 56.3 51.3 48.2 38.6 47.8 44.1 44.3 40.7 52.0 55.3
Counties Like Us 66.5 42.5 64.0 53.8 43.8 48.5 26.9 41.1 37.0 44.5 43.6 45.7
Mason County 69.3 0.0 17.4 17.1 51.3 67.7 17.0 0.0 87.1 35.5 35.5 53.9
Suicide & Attempt 4 0 1 1 3 4 1 0 5 2 2 3
Persons, 10-17 5,776 5,770 5,758 5,837 5,854 5,905 5,881 5,782 5,742 5,639 5,634 5,571
Updated
9/8/2014
Go to Indicator Comparison Profile
0
10
20
30
40
50
60
70
80
90
100
Mason County State Counties Like Us
Note: The adolescents (age 10-17) who committed suicide or were admitted to the hospital for suicide attempts, per 100,000
adolescents (age 10-17). Suicides are based on death certificate information. Suicide attempts are based on hospital admissions,
but do not include admissions to federal hospitals. Suppression code definitions for yearly rates are explained in Technical Notes.
Due to contractual agreement data may not be displayed for locations with adolescent populations less than 100.
State Source: Department of Health, Office of Hospital and Patient Data Systems, Comprehensive Hospital Abstract Reporting
System (CHARS) and Department of Health, Center for Health Statistics Death Certificate Data. Population Estimates:
Washington State Office of Financial Management, Forecasting Division
41
Washington State Department of Social and Health Services
Research and Data Analysis Division
Community Outcome and Risk Evaluation Information System (CORE). Jul 2015.
Problem Outcomes: Child or Family Health
Low Birthweight Babies
Rate Per
1,000
2002 2003 2004 2005 2006 2007 2008 2009 2010 2011 2012 2013
National 78.0 79.0 81.0 82.0 83.0 82.0 82.0 81.6 81.5 81.0 79.9 80.0
State 57.3 60.4 62.0 61.0 65.2 63.3 63.4 62.5 63.2 61.5 61.2 64.2
Counties Like Us 52.5 52.5 59.8 55.1 58.9 54.1 58.5 59.3 60.2 57.6 54.1 63.9
Mason County 71.0 61.8 69.3 61.2 57.0 48.0 71.1 56.7 72.0 64.7 44.6 69.1
Low-weight Babies 39 35 39 38 36 31 45 40 45 40 31 41
All Births 549 566 563 621 632 646 633 706 625 618 695 593
Updated
11/12/2014
Go to Indicator Comparison Profile
0
10
20
30
40
50
60
70
80
90
Mason County National State Counties Like Us
Note: The babies born with low birthweight, per 1,000 live births. Low birthweight is less than 2,500 grams. Rate changes in data
may result from on-going updates to birth records. No rate is given when the number of live births is less than 100 in the
geographic area. Suppression code definitions for yearly rates are explained in Technical Notes.
State Source: Department of Health, Center for Health Statistics, Birth Certificate Data File
National Source: U.S. Department of Health and Human Services, Centers for Disease Control and Health Statistics National
Center for Health Statistics, Division of Health Services, WONDER Data System
42
Washington State Department of Social and Health Services
Research and Data Analysis Division
Community Outcome and Risk Evaluation Information System (CORE). Jul 2015.
Problem Outcomes: Child or Family Health
Injury or Accident Hospitalizations for Women
Percent
2002 2003 2004 2005 2006 2007 2008 2009 2010 2011 2012 2013
State 11.9 12.2 13.2 13.3 13.5 13.4 14.3 15.1 15.4 16.1 16.7 16.8
Counties Like Us 13.2 13.7 14.8 15.5 15.7 15.8 16.2 16.8 16.5 16.7 17.0 17.4
Mason County 16.0 15.0 17.6 17.9 16.3 16.0 17.5 19.1 17.0 19.4 17.7 17.7
Injuries 454 435 508 519 461 451 518 578 535 623 560 559
Hospitalizations 2,836 2,896 2,881 2,894 2,823 2,819 2,963 3,030 3,157 3,215 3,159 3,158
Updated
8/25/2014
Go to Indicator Comparison Profile
0
5
10
15
20
25
Mason County State Counties Like Us
Note: The injury or accident hospitalizations for women as a percent of all hospitalizations for women (age 18+). Suppression
code definitions for yearly rates are explained in Technical Notes. Due to contractual agreement data may not be displayed for
areas with less than 100 hospitalizations.
State Source: Department of Health, Office of Hospital and Patient Data Systems, Comprehensive Hospital Abstract Reporting
System (CHARS) .
43
Washington State Department of Social and Health Services
Research and Data Analysis Division
Community Outcome and Risk Evaluation Information System (CORE). Jul 2015.
Problem Outcomes: Criminal Justice
Offenses, Domestic Violence
Rate Per
1,000
2002 2003 2004 2005 2006 2007 2008 2009 2010 2011 2012 2013
State 6.5 6.5 6.5 6.4 6.0 5.8 5.3 5.7 5.7 5.6 5.9 5.8
Counties Like Us 7.5 6.9 7.2 6.7 6.3 5.8 5.9 5.8 6.2 6.3 7.2 7.0
Mason County 6.4 6.3 7.5 5.8 5.9 5.2 5.5 4.6 4.8 5.2 5.3 4.9
Offenses 315 314 376 311 326 295 325 272 286 311 320 296
Persons 49,102 49,506 50,109 53,860 55,368 57,245 58,750 59,497 59,680 60,098 60,442 60,784
Updated
10/7/2014
Go to Indicator Comparison Profile
0
1
2
3
4
5
6
7
8
Mason County State Counties Like Us
Note: The domestic violence-related offenses, per 1,000 persons. Domestic violence includes any violence of one family member
against another family member. Family can include spouses, former spouses, parents who have children in common regardless of
marital status, adults who live in the same household, as well as parents and their children.
Offenses differ from arrests. While funding and grants are associated with participation, reporting is not mandatory. Offenses are
incidence reporting. When more than one victim is involved an offence is filed for each victim. Multiple property violations
performed at the same incident are counted as one offence. However when both types of events happen, only the victim incidents
are reported as offenses. Offenses focus on the nature of the crime, while arrests focus on the apprehended accused perpetrator.
Many offenses occur without arresting perpetrators.
Denominators are adjusted by subtracting the population of police agencies that did not report offenses. In spite of this population
adjustment, when the non-reporting police jurisdiction is where much of the crime occurs, the rate for the county will be lower
than it would be if that jurisdiction was included. For percent subtracted and the agencies not reporting, see the appendix on
Non-Reporting Agencies and Population. Suppression code definitions for yearly rates are explained in Technical Notes.
The crimes types used within this rate are represented in both Summary UCR and NIBRS systems and are not likely to be
substantially impacted by the system change.
State Source: Washington Association of Sheriffs and Police Chiefs (WASPC): Uniform Crime Report (UCR), National
Incident-Based Reporting System (NIBRS) Population Estimates: Washington State Office of Financial Management, Forecasting
Division
44
Washington State Department of Social and Health Services
Research and Data Analysis Division
Community Outcome and Risk Evaluation Information System (CORE). Jul 2015.
Problem Outcomes: Criminal Justice
Total Arrests of Adolescents (Age 10-17)
Rate Per
1,000
2002 2003 2004 2005 2006 2007 2008 2009 2010 2011 2012 2013
National 76.2 65.7 65.5 63.2 66.1 65.5 64.4 59.2 49.0 43.8 39.4 33.7
State 54.7 54.3 51.8 48.1 48.4 49.0 45.5 41.4 39.4 37.2 26.8 27.7
Counties Like Us 70.4 71.7 67.2 58.5 57.2 61.1 58.0 49.6 46.9 48.9 28.5 34.8
Mason County 50.5 52.2 60.8 66.5 59.6 68.0 52.9 40.4 39.1 39.7 15.9 15.5
Arrests, 10-17 286 291 344 381 342 394 305 229 218 173 87 84
Adjusted Pop 10-17 5,669 5,578 5,654 5,727 5,743 5,793 5,771 5,673 5,579 4,362 5,475 5,413
Updated
10/7/2014
Go to Indicator Comparison Profile
0
10
20
30
40
50
60
70
80
Mason County National State Counties Like Us
Note: The arrests of adolescents (age 10-17) for any crime, per 1,000 adolescents (age 10-17).
Washington State has transitioned from Summary UCR to the NIBRS system for reporting. Summary UCR collects eight (8) Part
One Crime offenses: criminal homicide, forcible rape, robbery, aggravated assault, burglary, larceny, motor vehicle theft and
arson. NIBRS collects information on twenty-three (23) different offenses, including all Part One Crimes plus others including
forcible and non-forcible sex offenses, fraud, kidnapping, and drug violations. Care must be taken when interpreting the yearly
trend of "total arrest" rates for an area. In areas where large amounts of arrests are likely for crimes not previously reported, a
substantial increase in total arrests could be expected starting with the 2012 data.
Denominators are adjusted by subtracting the population of police agencies that did not report arrests to WASPC. For more
information, see the Technical Notes and the appendix on Non-Reporting Agencies and Population.
State Source: Washington Association of Sheriffs and Police Chiefs (WASPC): Uniform Crime Report (UCR), National
Incident-Based Reporting System (NIBRS) Population Estimates: Washington State Office of Financial Management, Forecasting
Division
National Source: US Department of Justice, Bureau of Justice Statistics Sourcebook of Criminal Justice Statistics Online
Summary UCR NIBRS
45
Washington State Department of Social and Health Services
Research and Data Analysis Division
Community Outcome and Risk Evaluation Information System (CORE). Jul 2015.
Problem Outcomes: Criminal Justice
Arrests (Age 10-14), Property Crime
Rate Per
1,000
2002 2003 2004 2005 2006 2007 2008 2009 2010 2011 2012 2013
National 9.3 7.8 7.6 6.7 6.4 6.3 6.3 5.8 5.0 4.5 4.1 3.4
State 12.0 11.8 11.0 9.4 8.6 8.6 7.5 6.7 5.9 5.8 4.0 3.6
Counties Like Us 15.5 14.9 13.7 10.7 10.5 10.0 9.8 8.8 6.9 7.3 4.4 4.0
Mason County 12.3 10.2 17.9 13.7 9.5 11.2 7.8 4.9 2.9 7.0 2.9 0.3
Arrests, 10-14 43 35 62 48 33 39 27 17 10 19 10 1
Adjusted Pop 10-14 3,486 3,430 3,468 3,506 3,479 3,482 3,476 3,445 3,403 2,726 3,421 3,398
Updated
10/7/2014
Go to Indicator Comparison Profile
0
2
4
6
8
10
12
14
16
18
20
Mason County National State Counties Like Us
Note: The arrests of younger adolescents (age 10-14) for property crimes, per 1,000 adolescents (age 10-14). Property crimes
include all crimes involving burglary, larceny-theft, motor vehicle theft, and arson. Denominators are adjusted by subtracting the
population of police agencies that did not report arrests to UCR/NIBRS. In spite of this population adjustment, when the
non-reporting police jurisdiction is where much of the crime occurs, the rate for the area will be lower than it would be if that
jurisdiction was included. For percent subtracted, suppression code definitions and the agencies not reporting, see the Technical
Notes and the appendix on Non-Reporting Agencies and Population.
The crimes types used within this rate are represented in both Summary UCR and NIBRS systems and are not likely to be
substantially impacted by the system change.
State Source: Washington Association of Sheriffs and Police Chiefs (WASPC): Uniform Crime Report (UCR), National
Incident-Based Reporting System (NIBRS) Population Estimates: Washington State Office of Financial Management, Forecasting
Division
National Source: US Department of Justice, Bureau of Justice Statistics Sourcebook of Criminal Justice Statistics Online
46
Washington State Department of Social and Health Services
Research and Data Analysis Division
Community Outcome and Risk Evaluation Information System (CORE). Jul 2015.
Problem Outcomes: Criminal Justice
Arrests (Age 10-17), Property Crime
Rate Per
1,000
2002 2003 2004 2005 2006 2007 2008 2009 2010 2011 2012 2013
National 16.3 13.8 13.5 12.4 12.1 12.7 13.5 13.1 11.1 10.1 8.9 7.7
State 19.7 19.1 18.1 16.6 15.7 16.3 15.4 13.8 12.4 12.3 8.9 8.3
Counties Like Us 21.8 21.2 21.9 18.2 16.5 18.3 18.2 15.8 15.4 15.8 8.7 9.3
Mason County 19.2 16.1 20.7 18.2 10.6 18.5 13.0 9.9 8.1 11.7 4.6 2.0
Arrests, 10-17 109 90 117 104 61 107 75 56 45 51 25 11
Adjusted Pop 10-17 5,669 5,578 5,654 5,727 5,743 5,793 5,771 5,673 5,579 4,362 5,475 5,413
Updated
10/7/2014
Go to Indicator Comparison Profile
0
5
10
15
20
25
Mason County National State Counties Like Us
Note: The arrests of adolescents (age 10-17) for property crimes, per 1,000 adolescents (age 10-17). Property crimes include all
crimes involving burglary, larceny-theft, motor vehicle theft, and arson. Denominators are adjusted by subtracting the population
of police agencies that did not report arrests to UCR/NIBRS. In spite of this population adjustment, when the non-reporting
police jurisdiction is where much of the crime occurs, the rate for the county will be lower than it would be if that jurisdiction was
included. For percent subtracted, suppression code definitions and the agencies not reporting, see the Technical Notes and the
appendix on Non-Reporting Agencies and Population.
The crimes types used within this rate are represented in both Summary UCR and NIBRS systems and are not likely to be
substantially impacted by the system change.
State Source: Washington Association of Sheriffs and Police Chiefs (WASPC): Uniform Crime Report (UCR), National
Incident-Based Reporting System (NIBRS) Population Estimates: Washington State Office of Financial Management, Forecasting
Division
National Source: US Department of Justice, Bureau of Justice Statistics Sourcebook of Criminal Justice Statistics Online
47
Washington State Department of Social and Health Services
Research and Data Analysis Division
Community Outcome and Risk Evaluation Information System (CORE). Jul 2015.
Problem Outcomes: Criminal Justice
Arrests (Age 18+), Property Crime
Rate Per
1,000
2002 2003 2004 2005 2006 2007 2008 2009 2010 2011 2012 2013
National 6.0 5.3 5.5 5.4 5.1 5.3 5.5 5.7 5.5 5.5 5.7 5.6
State 6.2 6.5 6.8 6.7 6.1 6.1 5.6 6.2 6.2 6.7 6.1 6.8
Counties Like Us 7.8 8.4 9.6 8.7 7.2 7.2 7.0 7.2 7.9 8.1 5.9 8.9
Mason County 6.9 6.7 7.0 7.3 6.1 6.7 4.5 4.6 4.9 5.4 4.2 4.3
Arrests, 18+ 260 254 274 306 265 302 210 217 231 203 205 212
Adjusted Pop 18+ 37,879 37,823 38,958 42,160 43,518 45,153 46,515 47,294 47,609 37,965 48,546 48,906
Updated
10/7/2014
Go to Indicator Comparison Profile
0
2
4
6
8
10
12
Mason County National State Counties Like Us
Note: The arrests of adults (age 18+) for property crimes, per 1,000 adults (age 18+). Property crimes include all crimes
involving burglary, larceny-theft, motor vehicle theft, and arson. Denominators are adjusted by subtracting the population of
police agencies that did not report arrests to UCR/NIBRS. In spite of this population adjustment, when the non-reporting police
jurisdiction is where much of the crime occurs, the rate for the county will be lower than it would be if that jurisdiction was
included. For percent subtracted, suppression code definitions and the agencies not reporting, see the Technical Notes and the
appendix on Non-Reporting Agencies and Population.
The crimes types used within this rate are represented in both Summary UCR and NIBRS systems and are not likely to be
substantially impacted by the system change.
State Source: Washington Association of Sheriffs and Police Chiefs (WASPC): Uniform Crime Report (UCR), National
Incident-Based Reporting System (NIBRS) Population Estimates: Washington State Office of Financial Management, Forecasting
Division
National Source: US Department of Justice, Bureau of Justice Statistics Sourcebook of Criminal Justice Statistics Online
48
Washington State Department of Social and Health Services
Research and Data Analysis Division
Community Outcome and Risk Evaluation Information System (CORE). Jul 2015.
Problem Outcomes: Criminal Justice
Arrests (Age 10-17), Violent Crime
Rate Per
1,000
2002 2003 2004 2005 2006 2007 2008 2009 2010 2011 2012 2013
National 3.1 2.7 2.7 2.8 3.0 2.9 2.9 2.7 2.3 2.0 1.8 1.7
State 2.3 2.3 2.2 2.2 2.3 2.5 2.3 2.3 2.1 1.8 1.5 1.7
Counties Like Us 2.7 2.7 2.4 2.1 2.2 2.4 1.9 2.1 1.8 2.1 0.8 1.4
Mason County 2.7 2.9 2.3 3.0 5.1 2.9 3.5 2.5 2.0 3.0 1.3 1.3
Arrests, 10-17 15 16 13 17 29 17 20 14 11 13 7 7
Adjusted Pop 10-17 5,669 5,578 5,654 5,727 5,743 5,793 5,771 5,673 5,579 4,362 5,475 5,413
Updated
10/7/2014
Go to Indicator Comparison Profile
0
1
2
3
4
5
6
Mason County National State Counties Like Us
Note: The arrests of adolescents (age 10-17) for violent crime per 1,000 adolescents (age 10-17). Violent crimes include all
crimes involving criminal homicide, forcible rape, robbery, and aggravated assault. Simple assault is not defined as a violent
crime. Denominators are adjusted by subtracting the population of police agencies that did not report arrests to UCR/NIBRS. In
spite of this population adjustment, when the non-reporting police jurisdiction is where much of the crime occurs, the rate for the
county will be lower than it would be if that jurisdiction was included. For percent subtracted, suppression code definitions and
the agencies not reporting, see the Technical Notes and the appendix on Non-Reporting Agencies and Population.
The crimes types used within this rate are represented in both Summary UCR and NIBRS systems and are not likely to be
substantially impacted by the system change.
State Source: Washington Association of Sheriffs and Police Chiefs (WASPC): Uniform Crime Report (UCR), National
Incident-Based Reporting System (NIBRS) Population Estimates: Washington State Office of Financial Management, Forecasting
Division
National Source: US Department of Justice, Bureau of Justice Statistics Sourcebook of Criminal Justice Statistics Online
49
Washington State Department of Social and Health Services
Research and Data Analysis Division
Community Outcome and Risk Evaluation Information System (CORE). Jul 2015.
Problem Outcomes: Substance Use
Alcohol-Related Traffic Fatalities Per All Traffic Fatalities
Percent
2002 2003 2004 2005 2006 2007 2008 2009 2010 2011 2012 2013
National 36.7 36.0 35.7 36.7 37.4 37.7 37.0 37.6 36.2 35.4
State 39.8 36.8 37.7 41.8 39.7 40.8 43.6 49.0 41.1 39.7 36.1 36.0
Counties Like Us 48.1 35.9 35.4 45.5 35.9 49.5 42.2 41.8 27.1 44.3 39.1 40.0
Mason County 70.0 50.0 33.3 42.9 40.0 75.0 44.4 40.0 16.7 40.0 60.0 16.7
Alcohol-related 7 6 4 6 6 6 4 2 1 4 3 2
Fatalities 10 12 12 14 15 8 9 5 6 10 5 12
Updated
1/5/2015
Go to Indicator Comparison Profile
0
10
20
30
40
50
60
70
80
Mason County National State Counties Like Us
Note: The alcohol-related traffic fatalities, per 100 traffic fatalities. "Alcohol-related" means that the officer on the scene
determined that at least one driver involved in the accident "had been drinking." Thus, "Alcohol-related" includes but is not
limited to the legal definition of driving under the influence. Care should be taken since small numbers of events can cause
unreliable rates in some counties.
State Source: Washington State Patrol, Records Section, Traffic Collisions in Washington State, Accident Records Database
National Source: National Center for Statistics and Analysis, Fatal Accident Reporting System (FARS)
50
Washington State Department of Social and Health Services
Research and Data Analysis Division
Community Outcome and Risk Evaluation Information System (CORE). Jul 2015.
Problem Outcomes: Substance Use
Arrests (Age 10-17), Alcohol Violation
Rate Per
1,000
2002 2003 2004 2005 2006 2007 2008 2009 2010 2011 2012 2013
National 6.4 5.3 4.9 4.7 5.3 5.3 5.0 4.3 3.7 3.4 2.3 2.3
State 7.8 7.8 7.4 6.5 7.4 7.7 6.7 5.8 4.8 3.9 2.7 2.4
Counties Like Us 14.5 15.5 12.6 10.2 10.4 12.5 12.1 8.7 6.8 5.9 4.0 3.7
Mason County 4.2 5.9 4.6 6.6 8.0 10.5 6.9 4.9 4.7 3.2 0.7 0.6
Arrests, 10-17 24 33 26 38 46 61 40 28 26 14 4 3
Adjusted Pop 10-17 5,669 5,578 5,654 5,727 5,743 5,793 5,771 5,673 5,579 4,362 5,475 5,413
Updated
10/7/2014
Go to Indicator Comparison Profile
0
2
4
6
8
10
12
14
16
18
Mason County National State Counties Like Us
Note: The arrests of adolescents (age 10-17) for alcohol violations, per 1,000 adolescents (age 10-17). Alcohol violations
include all crimes involving driving under the influence, liquor law violations, and drunkenness. For children, arrests for liquor
law violations are usually arrests for minor in possession.
1) Denominators are adjusted by subtracting the population of police agencies that did not report arrests to UCR/NIBRS. In spite
of this population adjustment, when the non-reporting police jurisdiction is where much of the crime occurs, the rate for the
county will be lower than it would be if that jurisdiction was included. For percent subtracted, suppression code definitions and
the agencies not reporting, see the Technical Notes and the appendix on Non-Reporting Agencies and Population.
2) The DUI portion of this measure is likely understated, because arrests made by the State Patrol are not attributable to counties.
State Patrol arrests are included in the state rates.
The crimes types used within this rate are represented in both Summary UCR and NIBRS systems and are not likely to be
substantially impacted by the system change.
State Source: Washington Association of Sheriffs and Police Chiefs (WASPC): Uniform Crime Report (UCR), National
Incident-Based Reporting System (NIBRS)
Population Estimates: Washington State Office of Financial Management, Forecasting Division
National Source: US Department of Justice, Bureau of Justice Statistics Sourcebook of Criminal Justice Statistics Online
51
Washington State Department of Social and Health Services
Research and Data Analysis Division
Community Outcome and Risk Evaluation Information System (CORE). Jul 2015.
Problem Outcomes: Substance Use
Arrests (Age 10-17), Drug Law Violation
Rate Per
1,000
2002 2003 2004 2005 2006 2007 2008 2009 2010 2011 2012 2013
National 6.3 5.8 5.8 5.7 5.9 5.9 5.5 5.3 5.1 4.4 4.2 3.7
State 4.9 4.9 4.2 4.3 4.5 4.6 4.3 4.3 4.8 5.2 3.3 3.2
Counties Like Us 4.1 4.7 4.5 4.6 4.9 4.6 4.0 4.2 5.0 7.0 4.1 4.6
Mason County 2.3 2.5 3.7 3.5 3.8 4.1 4.2 3.2 3.9 8.9 3.5 1.9
Arrests, 10-17 13 14 21 20 22 24 24 18 22 39 19 10
Adjusted Pop 10-17 5,669 5,578 5,654 5,727 5,743 5,793 5,771 5,673 5,579 4,362 5,475 5,413
Updated
10/7/2014
Go to Indicator Comparison Profile
0
1
2
3
4
5
6
7
8
9
10
Mason County National State Counties Like Us
Note: The arrests of adolescents (age 10-17) for drug law violations, per 1,000 adolescents (age 10-17). Drug law violations
include all crimes involving sale, manufacturing, and possession of drugs.
Denominators are adjusted by subtracting the population of police agencies that did not report arrests to UCR/NIBRS. In spite of
this population adjustment, when the non-reporting police jurisdiction is where much of the crime occurs, the rate for the county
will be lower than it would be if that jurisdiction was included. For percent subtracted, suppression code definitions and the
agencies not reporting, see the Technical Notes and the appendix on Non-Reporting Agencies and Population.
The crimes types used within this rate are represented in both Summary UCR and NIBRS systems and are not likely to be
substantially impacted by the system change.
State Source: Washington Association of Sheriffs and Police Chiefs (WASPC): Uniform Crime Report (UCR), National
Incident-Based Reporting System (NIBRS) Population Estimates: Washington State Office of Financial Management, Forecasting
Division
National Source: US Department of Justice, Bureau of Justice Statistics Sourcebook of Criminal Justice Statistics Online
52
Washington State Department of Social and Health Services
Research and Data Analysis Division
Community Outcome and Risk Evaluation Information System (CORE). Jul 2015.
Problem Outcomes: Substance Use
Clients of State-Funded Alcohol or Drug Services (Age 10-17)
Rate Per
1,000
2002 2003 2004 2005 2006 2007 2008 2009 2010 2011 2012 2013
National 4.8 4.8 4.8 4.4 4.3 4.2 4.7 4.6 4.2 3.7
State 11.4 11.2 11.1 10.6 10.2 10.6 11.3 11.0 11.1 11.5 11.4 11.1
Counties Like Us 16.4 16.5 15.6 16.2 16.7 16.7 17.7 16.8 16.2 19.0 19.3 19.1
Mason County 14.0 17.0 20.8 18.9 21.5 23.0 24.3 19.7 12.5 15.3 21.1 18.1
Admits, 10-17 81 98 120 110 126 136 143 114 72 86 119 101
Persons, 10-17 5,776 5,770 5,758 5,837 5,854 5,905 5,881 5,782 5,742 5,639 5,634 5,571
Updated
11/6/2014
Go to Indicator Comparison Profile
0
5
10
15
20
25
30
Mason County National State Counties Like Us
Note: The adolescents (age 10-17) receiving state-funded alcohol or drug services, per 1,000 adolescents 10-17. Counts of
clients are unduplicated so that those receiving services more than once during the year are only counted once for that year.
State-funded services include treatment, assessment, and detox. Persons in Department of Corrections treatment programs are
not included.
State Source: Department of Social and Health Services, Division of Behavioral Health and Recovery, Treatment and
Assessment Report Generation Tool (TARGET). Population Estimates: Washington State Office of Financial Management,
Forecasting Division
National Source: Office of Applied Studies, Substance Abuse and Mental Health Services Administration, Treatment Episode
Data Set (TEDS)
53
Washington State Department of Social and Health Services
Research and Data Analysis Division
Community Outcome and Risk Evaluation Information System (CORE). Jul 2015.
Technical Notes
Topics:
Population Denominators Used in This Report Rates – Why is Raw Data Converted to Rates?
Counting Alcohol- or Drug-related Deaths Standardization of CORE Indicators
Counties Like Us Graduation and Dropout Data Methodology Changes
Duplicated and Unduplicated Counts Where are the roadblocks to learning?
Transition Summary UCR to National Incident-Based Reporting System (NIBRS) Suppression Codes
Uniform Crime Report - Non-Reporting Police Jurisdictions
CORE Conversion Process and Weighted Reliability Index
Population Denominators Used in This Report
Counting Alcohol- or Drug-related Deaths
The tables on the following pages characterize the different diseases, injuries, and accidents by: name, ICD-9 or ICD-10 code, percent
attributable to alcohol or drugs, age of inclusion. Information sources are listed below.
Other contributory causes of death are related only sometimes to alcohol or drugs. For example, epidemiological studies have shown
that, among persons over 35 years of age, 60% of deaths due to chronic pancreatitis (ICD-9 code 577.1) and 75% of malignant
neoplasms of the esophagus (ICD-9 code 150) are alcohol-related. For persons of all ages, 42% of motor vehicle traffic and nontraffic
deaths (ICD-9 codes E810 through E825) are alcohol-related. The appropriate percentage of such indirectly attributable deaths are also
counted toward totals for AOD-related deaths.
The identified AOD-related causes of death may be either fully attributable or sometimes attributable to alcohol or drugs. Some
contributory causes of death are explicit in their mention of alcohol or drugs. Examples include alcoholic cirrhosis of the liver (ICD-9
code 571.2), alcohol and drug dependence syndromes (ICD-9 codes 303 and 304, respectively), and drug poisonings (ICD-9 codes E850
through E859). All deaths of this sort are fully, or 100%, attributable to alcohol or drug abuse and are considered direct AOD-related
deaths.
AOD deaths are identified by matching all the contributory causes of death from death certificate records to a list of causes that are
considered AOD-related. The deaths identified as AOD-related then may be summed to provide area totals. Dividing the total AOD-
related deaths by all deaths in an area gives the percent of all deaths that are alcohol and drug related. Lists of underlying causes of
death that are AOD-related have been developed in several studies. Citations for these studies are listed prior to the AOD attribution
tables. AOD-related deaths used in this report are determined using a comprehensive assembly of disease, accident, and injury codes
identified in those studies. The codes are based upon the International Classification of Diseases, Ninth Revision (ICD-9) from 1990 to
1998 or International Classification of Diseases, Tenth Revision (ICD-10) after 1998.
Population is updated as the data becomes available. If events for the numerator are available, but the population is not yet available
the population for the year previous is used for calculating rates. Those data years are marked with an asterisk, like this: 2011*. The
asterisk is removed when the population, and the rate are updated.
2. Rice D, et al. 1990. The Economic Costs of Alcohol and Drug Abuse and Mental Illness: 1985. Report submitted to the Office of
Financing and Coverage Policy of the Alcohol, Drug Abuse, and mental health Administration, U.S. Department of Health and Human
Services. San Francisco, CA: Institute for Health and Aging, University of California.
1. Schultz J, Rice D, & Parker D. 1990. Alcohol-related mortality and years of potential life lost - United States, 1987. Morbidity and
Mortality Weekly Report, 39, 173-178.
3. Fox K, Merrill J, Chang H, & Califano J. 1995. Estimating the Costs of Substance Abuse to the Medicaid Hospital Care Program.
American Journal of Public Health, 85(1), 48-54.
4. Seattle-King County HIV/AIDS Epidemiology Unit and Washington State Office of HIV/AIDS Epidemiology and Evaluation. 1994.
Washington State/Seattle-King County HIV/AIDS Epidemiology Report (2nd Quarter, 1994), p. 4.
54
Washington State Department of Social and Health Services
Research and Data Analysis Division
Community Outcome and Risk Evaluation Information System (CORE). Jul 2015.
Technical Notes
Disease Category ICD-10 Code ICD-9 Code Attrib Age
Diseases Directly Attributable to Alcohol
Alcoholic psychoses F10, F10.3-F10.9 291 100% >=15
Alcohol dependence syndrome F10.2 303 100% >=15
Alcoholic polyneuropathy G62.1 357.5 100% >=15
Alcoholic cardiomyopathy I42.6 425.5 100% >=15
Alcoholic gastritis K29.2 535.3 100% >=15
Alcoholic fatty liver K70.0 571.0 100% >=15
Acute alcoholic hepatitis K70.1, K70.4 571.1 100% >=15
Alcoholic cirrhosis of the liver K70.3 571.2 100% >=15
Alcoholic liver damage, other K70.2, K70.9, K70 571.3 100% >=15
Excessive blood level of alcohol,
toxic effect of alcohol
R78.0, T51 790.3. 980 100% >=0
Accidental poisoning by alcohol X45, Y15 E860 100% >=0
Nondependent abuse of Alcohol F10.1 305.0 100% >=0
Alcohol-induced pseudo-Cushing's sE24.4 Not Available in ICD-9 100% >=15
Degeneration of nervous system dueG31.2 Not Available in ICD-9 100% >=15
Alcoholic myopathy G72.1 Not Available in ICD-9 100% >=15
Maternal care for (suspected) damagO35.4 Not Available in ICD-9 100% >=15
Newborn affected by maternal use oP04.3 Not Available in ICD-9 100% >=0
Fetal alcohol syndrome (dysmorphicQ86.0 Not Available in ICD-9 100% >=0
Suicide attributable to alcohol X65 Not Available in ICD-9 100% >=0
Alcoholic Pellagra E52 265.2 100% >=0
Diseases Indirectly Attributable to Alcohol
Neoplasms
Breast C50, D05 174.0-174.9, 233.0 13% F >=35
Esophagus C15, D00.1 150.1-150.9, 230.1 75% >=35
Larynx C32 , D02.0 161.0-.161.9, 231.0 50%
M,
40% F
>=35
Lip, oral cavity, pharynx C00-C14, D00.0 140.1-141.9, 143.0-149.9, 230.0 50%
M,
40% F
>=35
Liver C22, D01.5 155.0-155.2, 230.8 29% >=35
Cardiovascular
Cardiomyopathy I42.0 - I42.2, I42.5, I42.7- I42.9 425.1, 425.4, 425.9 40%M >=35
Hypertension I10-113, O10-O14, O16 401.0-404.9, 642.0, 642.2, 642.9 11% >=35
Digestive System
Cirrhosis K71.7, K74.5-K74.6 571.5 74% >=35
Duodenal Ulcers K26 532.0-532.9 10% >=35
Pancreatitis, acute K85 577.0 47% >=35
Pancreatitis, chronic K86.1- K86.3, K86.9 577.1, 577.2, 577.9 72% >=35
Other Diseases or Conditions
Epilepsy G40.3,G40.4,G40.6,G40.9 345.1, 345.3, 345.9 30% >=15
Seizures R56 780.3 41% >=15
Tuberculosis A16-A19 011-013, 017, 018 25% >=15
Accident or Injury Causes : Motor
vehicle traffic and non-traffic
accidents
V02–V04, V09.0, V09.2, V12–V14,
V19.0–V19.2, V19.4–V19.6, V20–V79,
V80.3– V80.5, V81.0–V81.1, V82.0–V82.1,
V83–V86, V87.0–V87.8, V88.0–V88.8,
V89.0, V89.2
E810-E825 42% >=0
55
Washington State Department of Social and Health Services
Research and Data Analysis Division
Community Outcome and Risk Evaluation Information System (CORE). Jul 2015.
Technical Notes
Disease Category ICD-10 Code ICD-9 Code Attrib Age
Pedal cycle and other road vehicle
accidents
V01, V05–V06, V09.1, V09.3–V09.9,
V10–V11, V15–V18, V19.3, V19.8–V19.9,
V80.0–V80.2, V80.6–V80.9, V82.2–V82.9,
V87.9, V88.9, V89.1, V89.3, V89.9
E826-E829 20% >=0
Water transport accidents V90-V94 E830-E838 20% >=0
Air & space transport accidents V95-V97 E840-E845 16% >=0
Accidental falls W00-W19 E880-E888 35% >=15
Accidents caused by fire X00-X09 E890-E899 45% >=0
Accidental drowning and
submersion
W65-W74 E910 38% >=0
Homicide & other purposely
inflicted injury
X86–Y09, Y87.1 E960-E962, E962.1-E969 46% >=15
Other X31, W79, W50-W52, W20- W34, Y15-Y19 E901, E911, E917-E920, E922 25% >=15
Diseases Directly Attributable to Drugs
Drug psychoses F11-F16, F18-F19 292 100% >=0
Drug dependence syndrome F11-F16, F18-F19 304 100% >=0
Polyneuropathy due to drugs G62.0 357.6 100% >=15
Drug dependence during F11-F16, F18-F19 648.3 100% >=0
Suspected damage to fetus from
drugs
O35.5, 655.5 100% >=0
Noxious influences affecting fetus P04.4 760.7 100% >=0
Drug reactions, intox., withdrawal
specific to newborn
P96.1 779.4, 779.5 100% >=0
Selected drug poisonings R78,R78.1-R78.6, T38 ; excludes Y40-59.9
(therapeutic use)
962, 965, 967-971, 977 excludes
E930-949
100% >=0
Selected accidental drug
poisonings
X40-X44 E850-E858 100% >=0
Accidental Poisonings (magic
mushrooms, huffing and other
drug use)
X46-X49 E861-E869 100% >=0
Nondependent abuse of drugs F11-F16, F18-F19 305.2-305.9 100% >=0
Assault by poisoning using drugs
and medicaments
x85 E962.0 100% >=0
Drug induced myopathy G72.0 Not Available in ICD-9 100%
Poisoning by drugs, accidentally or
purposely inflicted
Y10-Y14 E980.0-E980.5 100% >=0
Suicides attributable to drugs x60-64 E950.0-E950.5 100% >=0
Diseases Indirectly Attributable to Drugs
AIDS (from IV drug use exposure) B20-B24 042.0-044.9 5% >=15
Cardiovascular
Endocarditis I33.0, I33.9 421.0, 421.9 75% >=15
Other
Hepatitis A B15.9 70.1 12% >=15
Hepatitis B B16-B16.9 70.2, 70.3 36% >=15
Hepatitis C B17-B19.9 70.5, 70.9 10% >=15
Suicides due to alcohol or drugs are now considered direct AOD-related deaths, other suicides are not apportioned. This brings our
definitions into compliance with NCHS definitions.
Other category includes: Excessive cold, Choking on food in airway; Striking against or struck accidentally by objects or persons;
Caught accidentally in or between objects; Accidents caused by machinery; Accidents caused by cutting and piercing instruments.
56
Washington State Department of Social and Health Services
Research and Data Analysis Division
Community Outcome and Risk Evaluation Information System (CORE). Jul 2015.
Technical Notes
Counties Like Us
The groupings for “Counties Like Us” are as follows:
Urban A* – King County
Urban B* – Pierce, Snohomish, and Spokane
Urban C – Benton, Clark, Kitsap, Thurston, Whatcom, and Yakima
Rural A – Ferry, Franklin, Grant, Klickitat, Okanogan, Pend Oreille, and Skamania
Rural B – Adams, Asotin, Chelan, Columbia, Douglas, Garfield, Kittitas, Lincoln,
Stevens, Walla, and Whitman
Rural C – Clallam, Cowlitz, Grays Harbor, Island, Jefferson, Lewis, Mason, Pacific,
San Juan, Skagit, Wahkiakum
Duplicated and Unduplicated Counts
Transitioning from Uniform Crime Reporting (UCR) to National Incident-Based Reporting System (NIBRS)
Over 80 years ago, standards were established for the Uniform Crime Reporting (UCR) Program so agencies could report their crime
and arrest information in the same format and at the same level of detail and accuracy. Under the traditional UCR system agencies
report monthly of the eight (8) "Part One" offenses and values of property stolen, as well as counts of arrests. The FBI Crime Index
reports only designated Part One Crimes. These are criminal homicide, forcible rape, robbery, aggravated assault, burglary, larceny,
motor vehicle theft and arson. This is now referred to as Summary UCR. Most law enforcement agencies report arrest and offense data
to the Washington Association of Sheriffs and Police Chiefs (WASPC), which in turn provides data to the FBI’s Uniform Crime
Reporting Program (UCR).
In 1989, the FBI instituted a new crime-reporting system called the National Incident-Based Reporting System (NIBRS) to provide a
more detailed and comprehensive view of crime in the United States. While Summary UCR collects only counts on eight (8) offense
types, NIBRS collects information on twenty-three (23) different offenses. Some of the additional offenses in NIBRS are forcible and
non-forcible sex offenses, fraud, kidnapping, and drug violations.
* For comparison, King County is compared to Urban B, but average scores for the indicators in Urban B do not include King County.
In an unduplicated person count, each person is counted only once in a year for the specified activity or service type, even if they receive
that service multiple times during the year. Examples include Temporary Assistance to Needy Families (TANF) Child Recipients, Food
Stamp Recipients, and alcohol or drug treatment. Duplicated counts are made of events such as prison admissions, child victims in
accepted referrals, or admission to a hospital for attempted suicide. For instance, for each identified child victim in an accepted referral,
that “event” is counted. Therefore, a child identified as a victim in more than one referral during the year is included more than once.
Additionally more than one victim can be identified in a single accepted referral. Both the victims and the referrals are duplicated.
Knowing that your county has a particular rate for one of the indicators does not help you evaluate the importance of that indicator to
your risk profile. You do not know if it is higher or lower than you could reasonably expect. It is more useful to compare your county
rate to the state rate, which is the average for the whole state, and to other counties, especially counties that have some characteristics in
common with your county. This is especially important when urban rates differ substantially from rural rates. The comparison we
present is for a group of counties that are similar in characteristics related to prevention planning: population of young people (aged 10-
24), the percentage of deaths in the county that are alcohol and drug-related, and a simple geographic division into Eastern and Western
Washington. For each indicator the Counties Like Us rate is the average rate across all of the counties in the cluster.
Washington State has transitioned to the NIBRS system for reporting. This was a costly staged process which was particularly difficult
for smaller communities. Washington State became certified to begin submitting NIBRS data to the FBI in December 2006. Summary
reporting was phased out and all reporting agencies began submitting NIBRS data by January 1, 2012. The rates for Part One offenses
we previously reported should show no impact of the system change. However, the rates fortotal arrests by age group include all arrests
for offenses reported which now cover the twenty-three offense categories rather than the previous eight categories. Care must be taken
when interpreting the yearly trend of "total arrest" rates for an area. In areas where large amounts of arrests are likely for crimes not
previously reported, a substantial increase in total arrests could to be expected starting with the 2012 data.
57
Washington State Department of Social and Health Services
Research and Data Analysis Division
Community Outcome and Risk Evaluation Information System (CORE). Jul 2015.
Technical Notes
Uniform Crime Report - Non-Reporting Police Jurisdictions
CORE Conversion Process and Weighted Reliability Index
CORE obtains data from many government agency sources. The data are represented as events (e.g. # of teen births, # of crimes, # of
clients) occurring within a given geographic unit. This geographic unit is generally the smallest that can be obtained from the agency
source. For example, data may be available by school district, by zip code, by census tract or by police jurisdictions. CORE calls these
geographic units the “source geography.”
CORE data is usually reported at the geographic level of county or community – called in the rest of this report the "destination
geography." Therefore, data usually needs to be converted from the “source geographies” to the “destination geography.”
However when both types of events happen, only the victim incidents are reported as offenses. Offenses focus on the nature of the
crime, while arrests focus on the apprehended accused perpetrator. Many offenses occur without arresting perpetrators. Sometimes
charges are dropped and sometimes no perpetrator is ever found. No perpetrator age can be assigned to offence data so the entire age
range of population is used as the denominator. Prior to 2012 data reported to WASPC in NIBRS format, which was not yet compatible
with UCR output reports, was only included in their reports to the FBI. We listed those jurisdictions as non-reporting in UCR although
WASPC considered them to have reported. Only part one offenses are reported in the Uniform Crime Report, some agencies have no
part one crimes to report. Those agencies are listed with zero events, not as non-reporting.
Due to the uneven geographic distribution of crime, missing police data can cause spikes or dips in the trend data comparison of
multiple consecutive years. We do not run into this problem in the state report because the county rates there (as opposed to the
individual county reports) only report 5-year averages. However for individual county reports and reports for smaller areas like locales
or districts the trend data can become unstable due to non-reporting. Alternately, the conversion of data from certain police
jurisdictions to other areas like locales may not apportion directly causing too much of the data to be apportioned based on population
rather than clearly assigned to one area. We use a weighted reliability index (WRI) to determine when the conversion is no longer
reliable. An explanation of that process follows. We have tried to compensate for these and other issues by suppressing data which is
likely to be affected.
Most law enforcement agencies report arrest and offence data to the Washington Association of Sheriffs and Police Chiefs (WASPC),
which in turn provides data to the FBI’s Uniform Crime Reporting Program. This is the source of our data. Some jurisdictions do not
report all arrests and offenses, some report partial years, and some withhold certain categories of arrests or offenses. Reporting is
voluntary for arrests and offenses. Offenses are more likely to be reported since some funding is associated with reporting. Offenses are
incidence reporting. When more than one victim is involved an offence is filed for each victim. Multiple property violations performed
at the same incident are counted as one offence.
In order to compensate for missing police reports, we have adjusted the denominator in the rate calculation so that it reflects only the
proportion of the area for which we do have data. For instance, say area A, with a population of 40,000, has eight police districts. Now,
if one of the police districts in the area did not report their arrests, the number of arrests would not be representative of the whole area.
Therefore, we would not want to use the population of the whole area in the denominator because that would make the rate lower than it
should be. The solution used in this report is to subtract the population of that missing police district from the area population. We
follow the same procedure for police districts that report partial years: if they report only six months, we use only half of the population
to calculate the rate.
Information on the Non-reporting Population and Non-reporting Agencies are available only in the individual county, district, and
locale level reports. Each area report shows how and when that area's police jurisdictions reported data to the Washington Association
of Sheriff's and Police Chiefs. If your area is one with jurisdictions having a significant amount of incomplete data, be very careful that
you adjust your risk assessment to reflect this. In other words, the reported arrest rates may not adequately reflect the entire area. This
will be true especially in those cases where the non-reporting police jurisdictions have either very high or very low arrest rates,
compared to the rest of the area.
58
Washington State Department of Social and Health Services
Research and Data Analysis Division
Community Outcome and Risk Evaluation Information System (CORE). Jul 2015.
Technical Notes
Example 1
The following statements refer to the first example:
Example 2
For example, see the situation depicted in Example 2 below. Here we are trying to estimate the number of events contained in two very
small destination geographies (the ovals). Could this synthetic estimate be reliable? Perhaps, if the small area within the ovals really is
representative of the whole area -- but more likely not.
These events are split by age, race and gender subgroups whenever possible, as are the populations. So the synthetic estimation is
broken down that way also. If 40% of the young White population of the suburban school district lives in the destination geography,
then 40% of the events occurring to young White people are attributed there. If, on the other hand, only 10% of the young American
Indian population of the suburban school district lives in the destination geography, then only 10% of the events occurring to young
American Indian people are attributed there.
Data being converted from a smaller geography (source geography) like school district to a larger geography (like a county) is usually
fairly reliable because most of the smaller pieces fit neatly and wholly into the new geography. (See example 1).
While we can develop an algorithm to distribute all source geography populations to all destination geography populations, that
distribution will not always be reliable.
The rectangles represent two possible data source geographies (one densely populated school district – Urban School District -- and one
thinly populated school district – Suburban School District -- surrounding it). The large oval represents a report's destination geography
such as county, locale or network.
All of the events occurring in the urban school district can be attributed
entirely to the destination geography.
The events occurring in the split source geography (suburban school district, in
this example) are distributed to the destination geography in the same
proportion as the underlying population is distributed. If 40% of the suburban
school district population lies within the destination geography, then 40% of its
events are attributed to the destination geography.
The conversion is based on an overlay process, in which the events occurring in small source geographies that are totally contained
within the destination are combined with synthetic estimates of events occurring in source geographies that are partly within and partly
outside the destination geography. The synthetic estimation is weighted by the population distribution between the source and
destination areas. Therefore, it requires a small-scale count of the population underlying both source and destination geographies. This
process is explained below through examples.
Thinly
Populated
Densely
Populated
Urban
Suburban
Output Geography
InputGeography
InputGeography
59
Washington State Department of Social and Health Services
Research and Data Analysis Division
Community Outcome and Risk Evaluation Information System (CORE). Jul 2015.
Technical Notes
The key underlying assumption behind the CORE Weighted Reliability Index is as follows:
Example 3
Percent of source population attributed to
destination
Multiplied by the population
attributed to the destination
zip code 1 10/80 = 12.5% * 10
zip code 2 900/1000 = 90% * 900
Total for Destination 910
810.00
In the above example, the Weighted Reliability Index for Destination City is 811.25 / 910 = 89%. Basically, 89% of the event
locations were directly attributed to the area they occurred. Along with the WRI a cut point for reliable reporting is needed. When
half or more of the events have been imputed to the destination geography, rather than directly attributed from the source geography, the
data is considered unreliable and rates are suppressed.
A statistic is needed to assist researchers in determining when a destination geography's events cannot be reliably estimated using these
processes. For CORE, that statistic is the Weighted Reliability Index (WRI).
The amount of overlap between source and destination populations can vary from less than 1% to 99% -- only a little of a source
population can live in a destination, or almost all of the source population can live in a destination.
1.25
811.25
When most of the population for the source geography is also in the destination geography, we can be more certain of the
reliability of the estimation process.
Therefore, the weighting process lets us calculate, for each source-geography/destination-geography combination, the reliability of each
destination geography's estimate.
In the figure for Example 3, for zip code 2 the source area population is mostly in the destination oval (encased in the dashed line), but
the majority population from the other contributing source area is not.
The oval represents the destination geography boundary -- the edge of a destination city. The rectangles represent the source geography
boundaries for two zip codes. The numbers are population of people living in each place: 10 people live both in Destination City and in
the first source (Zip code 1), and 900 people live both in Destination City and in the second source (Zipcode2).
The formula for Weighted Reliability Index for a single destination is the total weighted destination population as a percent of total
population. To understand this formula, see the calculations below.
Amount of
destination
Zip code 2
Zip code 1
100
900
10
70
60
Washington State Department of Social and Health Services
Research and Data Analysis Division
Community Outcome and Risk Evaluation Information System (CORE). Jul 2015.
Technical Notes
WRI for Areas with Non-Reporting of Data
Example 4
The second test of reliability is to determine whether the population for the rate is adequately represented. In this example, allow the
numbers inside the oval to represent a population of 100 allocated to the destination geography. Two source jurisdictions are entirely
located in the destination geography represented by the oval. Their events when reported would be directly attributed. The non-
reporting jurisdiction would have its population of 50 excluded from the calculation for WRI, while the reporting jurisdiction would
have its population included in the calculation. In this case the completely contained reporting jurisdiction would represent 30 of the
remaining 50 population (60%) in the destination oval. The imputed portion is 40% allowing the destination geography to pass the first
test for WRI.
The reliability of arrest rates is calculated each year based on non-reporting. For five year rates, three out of five data years must be
considered reliable by both tests and the average of the yearly WRI for all five years must reach the WRI cut point value.
Partial Reporting, part of a year or part of a population, is also taken into consideration when computing the percentage of non-
reporting in a destination geography. Adult and juvenile rates are evaluated separately. Some areas may pass for one, but not for the
other due to their reporting habits. For partial year reporting the percentage of the year with data reported is used to evaluate each
category.
CORE also requires that the excluded non-reporting jurisdiction population (50 of 100) are less than 50% of the total population for the
destination geography. With an exclusion rate of 50%, this destination geography would fail the reliability criteria.
There is a second way that data may become unreliable. Some police jurisdictions do not report data to the state sources, use a reporting
method which cannot be included in our files, fail to report for either adults or juveniles, or report for only part of a year. This is
particularly true for court data – arrests or offenses. In order to accurately evaluate the reliability of data conversions for destination
geographies containing those jurisdictions, non-reporting jurisdiction populations were excluded from the calculations for WRI and the
non-reporting jurisdiction issue is evaluated separately.
Non-reporting Jurisdiction
reporting
jurisdiction
50
3 4
3
30
2
5
3
61
Washington State Department of Social and Health Services
Research and Data Analysis Division
Community Outcome and Risk Evaluation Information System (CORE). Jul 2015.
Technical Notes
Rates: why is “raw data” converted to rates?
For instance:
County A: # of licenses – 42, # of persons (all ages) – 14, 297
County B: # of licenses – 399, # of persons (all ages) – 186,185
To calculate the rate per 1,000:
42 / 14,297 = .002937 .002937 X 1,000 = 2.94
399 / 186,185 = .002143 .002143 X 1,000 = 2.14
Standardization of CORE Indicators
The preferred way to compare different indicators is to find out how much each individual indicator varies from some common point; in
CORE reports the point we use is the indicator’s value for the state. In more technical terms, we transform the original absolute rates to
a common scale: the relative deviation from the state rate. This is called a standardized score, and is based on the mathematical
calculation of the standard deviation. For a particular indicator, the county (school district, locale) with the highest absolute rate will
have the highest standardized score. A standardized score of 1.2, for instance, means that the county’s rate is 1.2 standard deviations
above the state rate, and a –1.2 would be 1.2 standard measures below the state rate. Approximately 95% of all counties (school
districts, locales) in the state will fall between +2 and –2 standard deviations from the state rate.
An individual indicator by itself is interesting because you can compare your county (school district, locale) to all other counties (school
districts, locales), and to the state. You can also look at how the indicator changes over time. But it is more difficult to compare several
indicators to each other, for example, if you want to see which indicator of risk is extremely high and which is just average. For
instance, you cannot directly compare the number (or rate) of alcohol retail licenses to the number (or rate) of Food Stamp recipients---
this would be like comparing apples and oranges and would not be meaningful.
So the rate of alcohol retail licenses is 2.94 per 1,000 people in County A, and 2.14 per 1,000 people in County B.
In order to make comparisons between counties and the state, and between counties that have different sizes, we use rates to describe an
event in terms of a standard size population---either per 100 (percent), per 1,000 or per 100,000. For instance, what does it mean if
County A has 42 alcohol retail licenses, and County B has 399? Does it mean that based on this indicator, the risk factor (Availability)
is much higher in County B than it is County A? No, not if County B is a much bigger county. If County B is bigger, then the “rate” of
liquor licenses per population might be the same or even lower. The only way to compare them is to convert the raw numbers to rates,
based on the same population factor.
CORE standardized indicators for counties are calculated using the following formula. The same formula is used for locales and for
districts, by substituting locale or district rates for county rates in the formula.
CORE indicators are standardized using a formula similar to the calculation of a z-score. A typical z-score for an observation (a county,
a locale, a school district) is calculated as a difference between an observation and the mean (average) of all observations, divided by the
standard deviation for all observations. A CORE standardized score for a county (school district, locale) is instead calculated using the
state rate in place of the mean for all counties (school districts, locales). A standardized CORE indicator avoids the problem of using an
unweighted mean of all counties (school districts, locales) that would give counties of very different size equal weight, and therefore
provides a more meaningful comparison.
Here is an example. Let’s say an indicator for extreme family economic deprivation (Food Stamp recipients per 100 people) has a
standardized score of 2.5 and an indicator for availability of drugs (alcohol retail licenses per 1,000 people) has a score of 1.2. We can
say that, other things being equal, the county (school district, locale) in question has a higher risk for extreme family economic
deprivation than for availability of drugs.
N
statecounty
statecounty
scorestdiz
N
i
rateirate
raterate
=
−
−
=
1
2
, )(
_
62
Washington State Department of Social and Health Services
Research and Data Analysis Division
Community Outcome and Risk Evaluation Information System (CORE). Jul 2015.
Technical Notes
Graduation and Dropout Data Methodology Change
How do the methods differ?
Where are the roadblocks to learning in our communities?
Academic Achievement:
The CORE measures academic achievement using three groups of indicators:
1. Student assessment on statewide tests;
2. Students who graduate from high school;
3. Students who drop out of high school, failing to complete their education.
Student Assessment
Graduating from High School
Two types of high school graduation rates are listed in the CORE reports, On-time Graduation and Extended Graduation.
The indicators for Poor Academic Performance , are available for grades 4, 7 and 10. The indicators are calculated as a percentage of
students tested in each grade assessment. Earlier years of information are from the Washington Assessment of Student Learning
(WASL). In 2009-10 the WASL was replaced by the Measurements of Student Progress (MSP) for grades 3 through 8 and the High
School Proficiency Exam (HSPE) for grade 10. Some districts have chosen to test students in both grades 9 and 10 for the 10th grade
assessment, giving freshmen a second chance to pass the test. Passing the HSPE is essential for high-school graduation. Ninth graders
who were tested are included with the tenth graders in the calculation of the Academic Achievement indicator for grade 10.
2011-2012 and beyond
May adjust for deficient credits.
Estimated Cohort (old method)
Prior to 2011-2012 school year
Is a composite cohort. Uses dropout rates for all grades within one school year to
determine an estimate of the number of students graduating.
Allows for alternate expected graduation year for students in special education or
ELL programs.
Beginning with the 2011-2012 school year major changes were made in how to measure dropouts and graduation for students in
Washington State. "Graduation Rate Calculations in Washington State" , a March 2012 publication by the Office of Superintendent of
Public Instruction, does an excellent job of explaining these changes. The following chart is an extract from that document (page 4).
For On-time Graduation , a student must graduate within four years by completion of the graduation requirements. The Estimated
Cohort (old method)On-Time Graduation rate formula uses dropout rates discussed below; the formula is: 100*(1-grade 9 dropout
rate)*(1-grade 10 dropout rate)*(1-grade 11 dropout rate)*(1-grade 12 dropout rate-grade 12 continuing rate). The on-time graduation
rate is the inverse of the cumulative dropout rate with the senior class adjusted to remove those students who stay in school for more
than four years from the calculation. The Adjusted Cohort (new method)rate divides the number of students graduating in their
fourth year by the adjusted freshman cohort for those students.
Is an actual cohort; individuals are tracked over 4
years with adjustments made for transfers in/out.
Imposes concept of four-year timespan. There are no
adjustments for Special Ed or Limited English
students who are expected to take longer.
All students are expected to graduate four years after
first entering 9th grade. Transfers from out of state
or other districts who are credit deficient may not be
reclassified into a lower grade.
Adjusted Cohort (new method)
63
Washington State Department of Social and Health Services
Research and Data Analysis Division
Community Outcome and Risk Evaluation Information System (CORE). Jul 2015.
Technical Notes
Dropping Out of High School
School Climate:
Extreme Family Economic Deprivation:
The High School Cohort Dropout rate (may also be referred to as the longitudinal, cumulative, or freshmen cohort dropout rate)
measures what happens to a single group (or cohort) of students over a period of time. This rate is most useful for seeing the long-term
impact on the community. The Estimated Cohort (old method)Cohort (Cumulative) Dropout rate formula is: 100-(100*(1-grade 9
dropout rate)*(1-grade 10 dropout rate)*(1-grade 11 dropout rate)*(1-grade 12 dropout rate)). The cohort rate is significantly higher
than the annual rate for the same area as it measures the cumulative effect of the multiyear loss of students from their freshmen cohort.
The Adjusted Cohort (new method)rate is the number of students dropping out prior to graduation divided by the adjusted cohort for
the freshman class of the graduates.
Indicators listed under School Climate give an idea of how safe students may feel in their school or how committed they and their fellow
students are to learning. These indicators are Weapons Incidents in School (rate per 1,000 students) and Unexcused Absences for
Students in Grades 1 to 8 (as a percentage of total student days possible in the school year, which equals the number of students times
teaching days). When weapons incidents are common or it is acceptable for young students to frequently miss school without
explanation the school climate is not conducive to learning.
Hungry students find it difficult to focus their attention long enough to learn. Those with inadequate housing or clothing may find it
difficult to interact with their peers. There are three indicators which evaluate levels of poverty.
Child Recipients of TANF (Temporary Assistance for Needy Families) gives the rate of children from birth to 17 who receive income
assistance. The child must be a citizen or legal alien and their caregiver must not have exceeded the 60 month maximum. There is a
requirement for the adults to seek work and an income evaluation. Teen parents must attend school.
Supplemental Nutrition Assistance Program (SNAP) Recipients. The SNAP program was formerly called the Food Stamps program,
and shows a more generalized level of need. While the persons must be citizens or legal aliens who seek work and meet the income
guidelines there is no cutoff time limit for benefits.
Extended Graduation requires more resources and dedication from district staff. It includes those students who stay in school after their
senior year and complete the graduation requirements. Districts which have high extended graduation rates may also have higher
dropout rates since the students attempting extended graduation are also at highest risk of again dropping out. A large difference in the
size of the on-time and extended graduation rates may indicate that a district or school is working hard to keep students in school or to
have dropouts return to school and attempt to graduate. The Estimated Cohort (old method)Extended Graduation rate formula is:
(the number of on-time and late graduates)/(the number of on-time graduates divided by the on-time graduation rate). The Adjusted
Cohort (new method) rate is the number of students graduating within five years divided by the adjusted cohort for the freshman class
of the graduates.
Two types of high school dropout rates are listed in the CORE reports, Annual (Event) Dropouts and High School Cohort (Cumulative)
Dropouts.
The Annual Dropout rate measures the proportion of students enrolled in grades 9-12 who drop out in a single year without completing
high school as a percentage of all students in grades 9 through 12 that year. When districts try new policies or projects to keep students
in school the impact of those actions will be more immediately visible in this rate. This rate is much more difficult for the data provider
to compute from data stored within the new cohort designations for students as it draws information from four separate cohorts. Data
production during the transition to the new method will likely have at least one year of data which will probably never be produced.
The formula and the data for this rate have not been changed by the new methodology.
64
Washington State Department of Social and Health Services
Research and Data Analysis Division
Community Outcome and Risk Evaluation Information System (CORE). Jul 2015.
Technical Notes
Suppression Codes for Yearly Trend Data
SN=Small Number Sample. Geography has less than 30 events in the denominator. More reliable at 5 year level or for larger area.
NR=Not reliable due to non-reporting of police jurisdictions data. Fifty percent or more of the population is not represented by the data
due to non-reporting jurisdictions.
UN=Unreliable conversion of events to report geography, failure of weighted reliability index (WRI). The WRI evaluation
process is further explained in the section labeled ‘CORE Conversion Process and Weighted Reliability Index’.
SP=Suppressed by agreement with data provider when denominator is below agreed level and may compromise a person's rights to
confidentiality.
However, there are other ways to qualify. Many persons earning a gross income up to 200% of the Federal Poverty Level apply for
income assistance because their children are automatically eligible for free school lunch if they meet the adjusted income guidelines.
These are sometimes called $0 grants. Households receiving assistance under SNAP, TANF for their children, Food Distribution
Program on Indian Reservations (FDPIR) or, with children who are homeless, fostered, runaway, migrant, or in Head Start Programs
are eligible for free benefits. If any child or household member receives benefits under Assistance Programs all children who are
members of the household are eligible for free school meals.
Students Eligible for Free or Reduced Price Lunch gives a much broader look at poverty in your area. Children of people who are
“working poor”, who have exceeded 60 months in benefits, are not legal aliens, or are not seeking work can still receive meals and free
milk. The free guidelines are at or below 130 percent of the Federal poverty guidelines and the reduced price guidelines are between 130
and at or below 185 percent of the Federal poverty guidelines.
65
Washington State Department of Social and Health Services
Research and Data Analysis Division
Community Outcome and Risk Evaluation Information System (CORE). Jul 2015.
Population of Areas Not Reporting Arrests or Offenses
Mason County Mason
Populations subtracted for police agencies not reporting
All Arrests for 10-14 year olds have 5 year rates which represent 93.13 % of the population.
2003 2004 2005 2006 2007 2008 2009 2010 2011 2012 2013
% Subtracted 3.33 1.78 1.96 2.00 2.03 2.03 2.05 3.13 22.97 3.09 3.11
Subtracted, 10-14 118 63 70 71 72 72 72 110 813 109 109
Persons, 10-14 3,548 3,531 3,576 3,550 3,553 3,548 3,517 3,513 3,539 3,530 3,507
Adjusted Pop 10-14 3,430 3,468 3,506 3,479 3,481 3,476 3,445 3,403 2,726 3,421 3,398
All Arrests for 10-17 year olds have 5 year rates which represent 93.39 % of the population.
2003 2004 2005 2006 2007 2008 2009 2010 2011 2012 2013
% Subtracted 3.33 1.81 1.88 1.90 1.90 1.87 1.89 2.84 22.65 2.82 2.84
Subtracted, 10-17 192 104 110 111 112 110 109 163 1,277 159 158
Persons, 10-17 5,770 5,758 5,837 5,854 5,905 5,881 5,782 5,742 5,639 5,634 5,571
Adjusted Pop 10-17 5,578 5,654 5,727 5,743 5,793 5,771 5,673 5,579 4,362 5,475 5,413
All Arrests for adults have 5 year rates which represent 94.46 % of the population.
2003 2004 2005 2006 2007 2008 2009 2010 2011 2012 2013
% Subtracted 2.55 1.19 1.13 1.11 1.08 1.05 1.04 1.48 22.36 1.42 1.42
Subtracted, 18+ 990 468 483 489 494 495 498 713 10,931 701 704
Persons, 18+ 38,813 39,426 42,643 44,007 45,647 47,010 47,791 48,322 48,896 49,247 49,609
Adjusted Pop 18+ 37,823 38,958 42,160 43,518 45,153 46,515 47,293 47,609 37,965 48,546 48,905
All Offenses for persons have 5 year rates which represent 98.45 % of the population.
2003 2004 2005 2006 2007 2008 2009 2010 2011 2012 2013
% Subtracted 1.38 1.36 1.27 1.24 1.22 1.19 1.17 1.68 1.63 1.63 1.62
Subtracted, 18+ 694 691 692 696 706 709 702 1,019 998 1,000 1,002
Persons, 18+ 50,200 50,800 54,551 56,063 57,951 59,459 60,199 60,699 61,096 61,441 61,786
Adjusted Pop 18+ 49,506 50,109 53,859 55,367 57,245 58,750 59,497 59,680 60,098 60,441 60,784
Adjustments for Non-reporting Arrests (age 10-14)
Adjustments for Non-reporting Arrests (age 10-17)
Adjustments for Non-reporting Arrests (age 18+)
Adjustments for Non-reporting Offenses
Police agencies are not required to report arrests or offences to UCR/NIBRS, they do so voluntarily. For a variety of
reasons, a jurisdiction may report part or none of the arrests or offences for a year. In these cases, the denominator is the
population of the areas that did report. For example, if juvenile arrests for one agency are not reported, the juveniles for that
jurisdiction are not included in the population denominator either.
The tables below show the values that comprise the adjustment for your county for each age range we report. "%
Subtracted" is the percent of the county's population subtracted for non-reporting. "Subtracted" is the amount subtracted.
"Persons" is the locale's population. "Adjusted Pop" is the denominator used to calculate indicator rates.
Nevertheless, rates can differ markedly from year to year particularly if a jurisdiction, where most of the crime in the county
occurs, did not report. When 50% or more of the population is not reported the yearly rate is suppressed. Jurisdictions
crossing county boundary lines are apportioned to each area by age, and sex of the population. When more than 40% of the
reported events have been apportioned, "synthetically estimated", the yearly rate is suppressed.
66
Washington State Department of Social and Health Services
Research and Data Analysis Division
Community Outcome and Risk Evaluation Information System (CORE). Jul 2015.
Agencies Not Reporting Arrests and/or Offenses
Mason County
Percent of Adult Arrests Not Reported to UCR/NIBRS by Year
Jurisdictions 2003 2004 2005 2006 2007 2008 2009 2010 2011 2012 2013
Mason CO 25.0
Shelton PD 8.0
Skokomish Squaxin Island Tribal PD 100.0 100.0 100.0 100.0 100.0 100.0 100.0 100.0 100.0 100.0 100.0
Back to Population Deducted
Police agency jurisdictions which are located at least partially in your county are listed below. The table shows the
percentage of non-reporting by jurisdiction for each year.
67
Washington State Department of Social and Health Services
Research and Data Analysis Division
Community Outcome and Risk Evaluation Information System (CORE). Jul 2015.
Agencies Not Reporting Arrests and/or Offenses
Mason County
Percent of Juvenile Arrests Not Reported to UCR/NIBRS by Year
Jurisdictions 2003 2004 2005 2006 2007 2008 2009 2010 2011 2012 2013
Mason CO 25.0
Shelton PD 8.0
Skokomish Squaxin Island Tribal PD 100.0 100.0 100.0 100.0 100.0 100.0 100.0 100.0 100.0 100.0 100.0
Back to Population Deducted
Police agency jurisdictions which are located at least partially in your county are listed below. The table shows the
percentage of non-reporting for juvenile arrests each year.
68
Washington State Department of Social and Health Services
Research and Data Analysis Division
Community Outcome and Risk Evaluation Information System (CORE). Jul 2015.
Agencies Not Reporting Arrests and/or Offenses
Mason County
Percent of Offenses Not Reported to UCR/NIBRS by Year
Jurisdictions 2003 2004 2005 2006 2007 2008 2009 2010 2011 2012 2013
Mason CO
Shelton PD
Skokomish Squaxin Island Tribal PD 100.0 100.0 100.0 100.0 100.0 100.0 100.0 100.0 100.0 100.0 100.0
Back to Population Deducted
Police agency jurisdictions which are located at least partially in your county are listed below. The table shows the
percentage of non-reporting for offenses each year.
69
Washington State Department of Social and Health Services
Research and Data Analysis Division
Community Outcome and Risk Evaluation Information System (CORE). Jul 2015.

Substance Abuse Mason, Michigan

  • 1.
    July, 2015 Risk andProtection Profile for Substance Abuse Prevention in Mason County 4.47-23:2015 Research & Data Analysis Division Vera Barga, B.S. Irina V. Sharkova, Ph.D. David Mancuso, Ph.D. in conjunction with the Division of Behavioral Health and Recovery Chris Imhoff, Director
  • 2.
    Mason County Table ofcontents: (Resize document window to access navigation tabs) Cover page Introduction Indicator Comparison Profiles: (A comparison of standardized five-year rates at county and 'county like us' levels by domain, factor, and indicator) Community: Family: Schools: Individual/Peer: Problem Outcomes: Appendices i19. Police Agencies that did not Report Arrests to UCR 15. Criminal Justice 12. School Climate 11. Academic Achievement 13. Early Criminal Justice Involvement 14. Child and Family Health 4. Indicator Profile 4 5. Availability of Drugs 17. Technical Notes 18. Populations Subtracted for Police Agencies not Reporting Arrests to UCR 8. Antisocial Behavior of Community Adults 9. Low Neighborhood Attachment and Community Disorganization 10. Family Problems 16. Substance Use 6. Extreme Economic & Social Deprivation 7. Transitions & Mobility 2. Indicator Profile 2 3. Indicator Profile 3 Interpreting Annual Trend Charts: 1. Indicator Profile 1 These tables provide a comprehensive update of data published in previous Profiles . They are among the timeliest data available to planners for understanding the risks of substance abuse among youth in their counties. Community, family, peer, and school-related factors are presented within the Hawkins and Catalano risk and protective factor framework that is used by many substance abuse prevention planners across the country. For more information about the data, framework, definitions, and other topics, see the 1997 Profile on Risk and Protection for Substance Abuse Prevention Planning in Washington State, (Report 4.15-40). That report and subsequent years’ Profiles are available on the RDA website at: https://www.dshs.wa.gov/sesa/rda/core-profile-archive. Interpreting Indicator Profiles:
  • 3.
    How To InterpretIndicator Profiles Domain/Factor Indicators Community Domain Availability of Drugs Alcohol Retail Licenses Availability of Drugs Tobacco Retail And Vending Machine Licenses Extreme Family Economic Deprivation Food Stamp Recipients (All Ages) Extreme Family Economic Deprivation Temporary Assistance to Needy Families (TANF), Child Recipients Extreme Family Economic Deprivation Unemployed Persons (Age 16+) Transitions and Mobility Net Migration, 3 Year Moving Average Transitions and Mobility Existing Home Sales Transitions and Mobility New Residence Construction Antisocial Behavior of Community Adults Alcohol- Or Drug-Related Deaths AOD Problems Clients Of State-Funded Alcohol or Drug Services (Age 18+) AOD Problems Arrests, Alcohol-Related (Age 18+) AOD Problems Arrests, Drug Law Violation (Age 18+) Arrests, Violent Crime (Age 18+) lower state rate higher The Indicator Profile compares rates for your County, and Counties Like Us to the state. The Profile displays standardized scores to allow comparison between indicators. See Technical Notes for a definition of a standardized score and of Counties Like Us. To see all 39 counties ranked from the highest to the lowest for each indicator, go to https://www.dshs.wa.gov/data/research/research-4.47-state.pdf 0.51 -0.74 -0.53 0.72 -0.11 0.15 -1.43 0.20 0.20 0.30 0.46 -0.57 -0.46 0.03 -0.42 -0.83 0.08 -0.05 1.18 -0.82 1.94 0.00 0.27 -0.58 -0.43 -4 0 4 Standardized Scores for Cascadia County Counties Like Us Each risk factor is described by 1 to 8 indicators Suppressed rates are blank, while zero rates are labeled. ii Washington State Department of Social and Health Services Research and Data Analysis Division Community Outcome and Risk Evaluation Information System (CORE). Jul 2015.
  • 4.
    How To InterpretCounty Trend Charts iii Understanding the CORE Trend Charts and Tables The presentation of risk factor data in the CORE reports is organized by domain (Community, Family, School, and Individual/Peer) and by risk factor within domains. Each risk factor may include one or more indicators. Knowing that your county has a particular rate for one of the indicators does not help you evaluate the importance of that indicator to your risk profile. You do not know if it is higher or lower than you could reasonably expect. It is more useful to compare your county rate to the state rate, which is the average for the whole state, and to other counties, especially counties that have some characteristics in common with your county. This is especially important when urban rates differ substantially from rural rates. The comparison we present is for a group of counties that are similar in characteristics related to prevention planning: population of young people (aged 10-24), the percentage of deaths in the county that are alcohol and drug-related, and a simple geographic division into Eastern and Western Washington. For each indicator the Counties Like Us rate is the average rate across all of the counties in the cluster. For more information on Counties Like Us see the Technical Notes. Please note these IMPORTANT ISSUES: The tabs are labeled with the name of the risk factor. Each risk factor may in turn include several indicators. Be sure to scroll down the page to review all of the available indicators for a given risk factor. The workbook is designed to print with one indicator on each page. Understanding the chart scales: Users should be careful to interpret the chart scales correctly. The chart scales are automatically adjusted to enhance differences between the indicators at each geographic level. Users should consider whether the differences they observe between geographic areas or across years are significant. The unit of measurement is displayed at the left of each chart scale. Often the unit of measurement is a rate expressed as the number of events or a count of individuals per 100 population (or, "percent"), or sometimes per 1,000 or 100,000 population. Review the example: On the following page (below, scroll down) is an example indicator for Alcohol Retail Licenses in "Cascadia County" . The number of alcohol retail licenses is expressed as a rate per 1,000 population. Washington State Department of Social and Health Services Research and Data Analysis Division Community Outcome and Risk Evaluation Information System (CORE). Jul 2015.
  • 5.
    How To InterpretCounty Trend Charts Alcohol Retail Licenses Rate Per 1,000 2002 2003 2004 2005 2006 2007 2008 2009 2010 2011 2012 2013 National Comparable National Data Not Available State 2.12 2.06 2.03 2.01 2.01 2.01 2.00 1.98 1.96 1.91 1.91 1.91 Counties Like Us 3.27 3.12 3.11 3.08 2.98 3.00 2.96 2.88 2.77 3.17 3.17 3.17 Cascadia County 5.08 5.23 5.22 5.22 5.29 5.35 4.86 4.99 4.32 5.93 5.93 5.93 Licenses 32 34 35 36 37 38 35 35 31 43 43 43 All Persons 6,295 6,497 6,703 6,899 7,000 7,103 7,198 7,012 7,177 7,250 7,250 7,250 Updated 1/27/2015 iv Go To Standardized Five-Year Rate Indicator Comparison Profile Back to Table of Contents 0 1 2 3 4 5 6 7 Cascadia County State Counties Like Us Note: The State and County rate are the annual number of alcohol retail licenses active during the year, per 1,000 persons (all ages). Retail licenses include restaurants, grocery stores, and wine shops but do not include state liquor stores and agencies. Retail alcohol facilities on military bases and reservations are not licensed by the State and therefore are not included in these data. State Source: Washington State Liquor Control Board, Annual Operations Report Population Estimates: Washington State Office of Financial Management, Forecasting Division Pay close attention to these scales. The differences between the rates may appear more or less important depending on the scale used. This is the factor. Different rates use different factors- some per 100 (percent), 1,000 or 100,000. Each indicator graph is followed by data source and rate definitions as well as any special information for the data. When the newest data was added. --Rate Formula-- Rate = (numerator / denominator) x factor Example in 2002: (32 / 6,295) x 1,000 = 5.08 Read the rate as 5.08 licenses per 1,000 people. Each risk factor is on its separate tab. Each risk factor may include several indicators, so remember to page down. For example, the risk factor Availability of Drugs has two indicators: Alcohol Retail Licenses (shown below) and Tobacco Retail And Vending Machine Licenses. Washington State Department of Social and Health Services Research and Data Analysis Division Community Outcome and Risk Evaluation Information System (CORE). Jul 2015.
  • 6.
    Standardized Five-Year IndicatorProfile Domain/Factor Indicators Community Domain Availability of Drugs Alcohol Retail Licenses Tobacco Retail and Vending Machine Licenses Extreme Family Economic Deprivation Supplemental Nutritional Assistance Program (SNAP) Temporary Assistance to Needy Families (TANF), Child Recipients Unemployed Persons (Age 16+) Transitions and Mobility Free or Reduced Price Lunch Eligibility Net Migration, 3 Year Moving Average Existing Home Sales Antisocial Behavior of Community Adults New Residence Construction Alcohol- or Drug-Related Deaths Clients of State-Funded Alcohol or Drug Services (Age 18+) Arrests, Alcohol-Related (Age 18+) Arrests, Drug Law Violation (Age 18+) Arrests, Violent Crime (Age 18+) lower state rate higher -0.09 0.43 -1.04 1.70 0.02 -0.37 1.68 0.57 0.66 1.83 1.48 0.87 1.62 1.52 0.51 -0.53 -1.21 1.03 1.04 -0.14 0.46 1.31 1.07 0.91 1.47 0.51 0.11 0.03 -5 -3 -1 1 3 5 Mason County Counties Like Us 1 Washington State Department of Social and Health Services Research and Data Analysis Division Community Outcome and Risk Evaluation Information System (CORE). Jul 2015.
  • 7.
    Standardized Five-Year IndicatorProfile Domain/Factor Indicators Community Domain (continued) Prisoners in State Correctional Systems (Age 18+) Population Not Registered to Vote Registered and Not Voting in the November Election Family Domain Family Problems Divorce Victims of Child Abuse and Neglect in Accepted Referrals School Domain Academic Achievement Poor Academic Performance, Grade 10 (Age 15) Poor Academic Performance, Grade 7 (Age 12) Poor Academic Performance, Grade 4 (Age 9) High school Cohort (Cumulative) Dropouts Annual (Event) Dropouts On-time Graduation Extended Graduation lower state rate higher Low Neighborhood Attachment and Community Disorganization 2.05 2.09 2.16 1.96 1.02 0.88 0.75 2.04 0.07 -1.86 -0.40 2.08 -0.08 0.48 0.12 0.01 1.39 1.36 1.23 1.18 -0.05 -0.78 0.24 0.09 -7 -5 -3 -1 1 3 5 7 Mason County Counties Like Us 2 Washington State Department of Social and Health Services Research and Data Analysis Division Community Outcome and Risk Evaluation Information System (CORE). Jul 2015.
  • 8.
    Standardized Five-Year IndicatorProfile Domain/Factor Indicators School Domain (Continued) School Climate Weapons Incidents at School Unexcused Absence Individual/Peer Domain Early Criminal Justice Involvement Arrests, Alcohol- or Drug-Related (Age 10-14) Arrests, Vandalism (Age 10-14) Total Arrests (Age 10-14) Problem Outcomes Child and Family Health Child Injury and Accident Hospitalizations Infant Mortality (Under 1 Year) Child Mortality (Ages 1-17) Births to School-Age (10-17) Mothers Sexually Transmitted Disease Cases (Birth-19) Suicide and Suicide Attempts (Age 10-17) Low Birth Weight Babies Women Injury and Accident Hospitalizations lower state rate higher 0.64 -1.37 -0.40 -0.08 0.32 1.13 -0.01 -0.10 1.34 1.24 1.72 0.31 0.26 0.78 -0.20 -0.21 0.24 0.97 0.49 -0.21 0.29 -0.11 -0.09 0.10 0.78 1.89 -5 -3 -1 1 3 5 Mason County Counties Like Us 3 Washington State Department of Social and Health Services Research and Data Analysis Division Community Outcome and Risk Evaluation Information System (CORE). Jul 2015.
  • 9.
    Standardized Five-Year IndicatorProfile Domain/Factor Indicators Problem Outcomes Criminal Justice Offenses, Domestic Violence Total Arrests, (Age 10-17) Arrests, Property Crime (Age 10-14) Arrests, Property Crime (Age 10-17) Arrests, Property Crime (Age 18+) Arrests, Violent Crime (Age 10-17) Substance Use Alcohol-Related Traffic Fatalities Per All Traffic Fatalities Arrests, Alcohol Violation (Age 10-17) Arrests, Drug Law Violation (Age 10-17) Clients of State-Funded Alcohol or Drug Services (Age 10-17) lower state rate higher Note: Check other Domains for substance use of community adults and early teens. 2.29 0.97 1.57 -0.58 -0.56 1.51 1.46 1.08 1.23 0.62 1.02 -0.02 -0.42 -0.72 0.09 -0.62 -0.84 -0.56 -0.33 -0.49 Mason County Counties Like Us 4 Washington State Department of Social and Health Services Research and Data Analysis Division Community Outcome and Risk Evaluation Information System (CORE). Jul 2015.
  • 10.
    Community Domain: Availabilityof Drugs Alcohol Retail Licenses Rate Per 1,000 2002 2003 2004 2005 2006 2007 2008 2009 2010 2011 2012 2013 State 1.9 1.9 2.0 2.0 1.9 2.0 2.0 2.0 2.2 2.0 2.2 2.2 Counties Like Us 2.6 2.6 2.7 2.6 2.6 2.5 2.5 2.5 2.7 2.8 3.0 3.0 Mason County 2.4 2.4 2.4 2.3 2.2 2.1 2.1 2.1 2.2 2.1 2.2 2.2 Licenses 117 120 122 123 125 121 124 126 135 126 135 135 All Persons 49,799 50,200 50,800 54,551 56,063 57,951 59,459 60,199 60,699 61,096 61,441 61,786 Updated 3/24/2014 Go to Indicator Comparison Profile 0.0 0.5 1.0 1.5 2.0 2.5 3.0 3.5 Mason County State Counties Like Us Note: The alcohol retail licenses active during the year, per 1,000 persons (all ages). Retail licenses include restaurants, grocery stores, and wine shops but do not include state liquor stores and agencies. Retail alcohol facilities on military bases and reservations are not licensed by the State and therefore are not included in these data. Policies on licensing distributors, taxing the proceeds, and determining who can sell alcohol vary substantially from state to state. Consequently, there is no consistent comparable source for national data. Data from 1999 to present is now geocoded from the facility address, rather than apportioned from zip code. This results in a more accurate, but different data total per county. State Source: Washington State Liquor Control Board, Annual Operations Report Population Estimates: Washington State Office of Financial Management, Forecasting Division 5 Washington State Department of Social and Health Services Research and Data Analysis Division Community Outcome and Risk Evaluation Information System (CORE). Jul 2015.
  • 11.
    Community Domain: Availabilityof Drugs Tobacco Retail and Vending Machine Licenses Rate Per 1,000 2002 2003 2004 2005 2006 2007 2008 2009 2010 2011 2012 2013 State 1.4 1.4 1.3 1.3 1.1 1.3 1.1 1.0 1.0 1.0 0.9 0.9 Counties Like Us 1.8 1.7 1.7 1.6 1.4 1.5 1.4 1.1 1.2 1.3 1.3 1.3 Mason County 1.8 1.7 1.6 1.5 1.4 1.5 1.4 1.0 1.2 1.1 0.9 0.9 Licenses 87 85 83 82 76 86 83 62 71 65 58 57 All Persons 49,799 50,200 50,800 54,551 56,063 57,951 59,459 60,199 60,699 61,096 61,441 61,786 Updated 3/24/2014 Go to Indicator Comparison Profile 0.0 0.2 0.4 0.6 0.8 1.0 1.2 1.4 1.6 1.8 2.0 Mason County State Counties Like Us Note: The tobacco retailer and vending machine licenses active during the year, per 1,000 persons (all ages). Tobacco retailers on military bases and reservations are not licensed by the State and therefore are not included in these data. Tobacco sales licenses include tobacco retailer licenses (stores that sell tobacco products) and tobacco vending machines. No source of comparable national data was obtained. State Source: Department of Health (from the Department of Licensing), Tobacco Prevention Program, Tobacco Statistics Population Estimates: Washington State Office of Financial Management, Forecasting Division 6 Washington State Department of Social and Health Services Research and Data Analysis Division Community Outcome and Risk Evaluation Information System (CORE). Jul 2015.
  • 12.
    Community Domain: ExtremeFamily Economic Deprivation Supplemental Nutritional Assistance Program (SNAP) Percent 2002 2003 2004 2005 2006 2007 2008 2009 2010 2011 2012 2013 National 6.6 7.4 8.2 8.7 8.9 8.8 9.4 11.2 13.0 14.4 14.9 State 9.5 10.4 11.3 11.9 12.1 12.1 12.6 15.1 18.0 20.4 21.4 21.5 Counties Like Us 11.8 12.8 13.8 14.7 14.9 14.9 18.8 18.6 21.8 24.1 25.2 25.5 Mason County 12.4 12.7 14.0 14.1 14.6 14.2 15.1 17.4 20.9 23.2 24.9 25.3 Recipients 6,153 6,358 7,117 7,704 8,182 8,220 8,969 10,488 12,662 14,191 15,287 15,623 All Persons 49,799 50,200 50,800 54,551 56,063 57,951 59,459 60,199 60,699 61,096 61,441 61,786 Updated 11/10/2014 Go to Indicator Comparison Profile 0 5 10 15 20 25 30 Mason County National State Counties Like Us Note: The persons (all ages) receiving food stamps in the fiscal year, per 100 persons (all ages). The population used is for the calendar year which ends the fiscal period. National rates use counts of all yearly recipients. Suppression code definitions for yearly rates are explained in Technical Notes. State Source: Department of Social and Health Services, Research and Data Analysis, Automated Client Eligibility System and Warrant Roll. Population Estimates: Washington State Office of Financial Management, Forecasting Division National Source: US Census Bureau, Statistical Abstract of the US; Federal Food Stamp Programs by State 7 Washington State Department of Social and Health Services Research and Data Analysis Division Community Outcome and Risk Evaluation Information System (CORE). Jul 2015.
  • 13.
    Community Domain: ExtremeFamily Economic Deprivation Temporary Assistance to Needy Families (TANF), Child Recipients Percent 2002 2003 2004 2005 2006 2007 2008 2009 2010 2011 2012 2013 National 5.3 5.1 4.9 4.7 4.4 4.1 3.9 4.2 4.5 4.5 4.6 State 10.6 10.3 10.4 10.2 9.7 9.0 8.8 9.7 10.3 11.0 9.6 8.2 Counties Like Us 12.8 12.7 13.1 12.8 12.3 11.3 11.3 12.7 13.4 14.2 12.8 11.3 Mason County 15.8 15.3 16.5 13.8 12.5 11.1 11.2 13.2 15.4 16.5 16.2 13.9 TANF Children 1,807 1,737 1,881 1,641 1,511 1,365 1,394 1,636 1,911 2,018 1,970 1,691 Children, birth-17 11,455 11,387 11,373 11,908 12,056 12,305 12,449 12,408 12,377 12,200 12,194 12,177 Updated 11/10/2014 Go to Indicator Comparison Profile 0 2 4 6 8 10 12 14 16 18 Mason County National State Counties Like Us Note: The children (age birth-17) participating in Aid to Families (AFDC/TANF) programs in the fiscal year, per 100 children (age birth-17). The population used is for the calendar year which ends the fiscal period. National TANF child recipients are defined as children 0-19 with almost no children of age 19, therefore national denominators are for children 0-18. Suppression code definitions for yearly rates are explained in Technical Notes. State Source: Department of Social and Health Services, Research and Data Analysis, Automated Client Eligibility System and Warrant Roll. Population Estimates: Washington State Office of Financial Management, Forecasting Division National Source: U.S. Department of Health & Human Services, Administration for Children and Families, Office of Planning Research and Evaluation: Characteristics and Financial Circumstances of TANF Recipients Table I-29 8 Washington State Department of Social and Health Services Research and Data Analysis Division Community Outcome and Risk Evaluation Information System (CORE). Jul 2015.
  • 14.
    Community Domain: ExtremeFamily Economic Deprivation Unemployed Persons (Age 16+) Percent 2002 2003 2004 2005 2006 2007 2008 2009 2010 2011 2012 2013 National 5.8 6.0 5.5 5.1 4.6 4.6 5.8 9.3 9.6 8.9 8.1 7.4 State 7.3 7.4 6.3 5.5 5.0 4.5 5.3 8.9 9.6 9.2 8.2 7.0 Counties Like Us 8.7 8.6 7.3 6.6 6.0 5.7 6.8 10.7 11.3 11.1 10.2 9.5 Mason County 8.3 8.5 7.3 6.5 5.9 5.7 7.0 10.3 11.1 11.2 10.4 9.8 Unemployed, 16+ 1,810 1,950 1,730 1,560 1,450 1,440 1,800 2,610 2,820 2,750 2,500 2,290 Labor Force,16+ 21,850 22,910 23,790 24,110 24,540 25,110 25,690 25,440 25,380 24,530 24,050 23,480 Updated 5/20/2014 Go to Indicator Comparison Profile 0 2 4 6 8 10 12 Mason County National State Counties Like Us Note: The unemployed persons (age 16 and over) per 100 persons in the civilian labor force. Unemployed persons are individuals who are currently available for work have actively looked for work, and do not have a job. The civilian labor force includes persons who are working or looking for work. The monthly numbers are a snapshot in time done approximately the 12th of each month. A yearly estimate is then produced by averaging the monthly numbers. Historical data has been updated. Data for the latest year should be considered preliminary. Suppression code definitions for yearly rates are explained in Technical Notes. State Source: Employment Security Department, Labor Market and Economic Analysis, County Unemployment File National Source: U.S. Department of Labor Bureau of Labor Statistics Labor Force Statistics from the Current Population Survey 9 Washington State Department of Social and Health Services Research and Data Analysis Division Community Outcome and Risk Evaluation Information System (CORE). Jul 2015.
  • 15.
    Community Domain: ExtremeFamily Economic Deprivation Students Eligible for Free or Reduced Price Lunch Percent 2003 2004 2005 2006 2007 2008 2009 2010 2011 2012 2013 2014 National 30.8 31.8 37.4 42.0 41.7 42.0 44.6 47.5 47.9 43.3 43.5 State 34.8 36.2 37.1 37.7 36.8 38.0 39.0 42.2 43.8 45.2 45.9 45.5 Counties Like Us 38.7 40.6 41.9 43.0 40.5 43.0 44.0 48.2 49.6 51.4 53.5 53.3 Mason County 44.8 47.6 43.1 46.1 46.3 48.1 48.8 53.9 56.3 56.8 61.0 63.1 Eligible Students 3,662 3,911 3,513 3,808 3,865 3,944 3,947 4,324 4,530 4,484 4,742 4,900 Enrolled Students 8,176 8,209 8,152 8,254 8,354 8,208 8,091 8,027 8,041 7,895 7,770 7,762 Updated 4/10/2014 Go to Indicator Comparison Profile 0 10 20 30 40 50 60 70 Mason County National State Counties Like Us Note: The students eligible for free or reduced price lunch per 100 students enrolled. Eligibility requirements are discussed in Technical Notes. State Source: Office of Superintendent of Public Instruction 10 Washington State Department of Social and Health Services Research and Data Analysis Division Community Outcome and Risk Evaluation Information System (CORE). Jul 2015.
  • 16.
    Community Domain: Transitionsand Mobility Net Migration, 3 Year Moving Average Rate Per 1,000 2003 2004 2005 2006 2007 2008 2009 2010 2011 2012 2013 2014 State 7.0 7.3 7.1 9.6 10.3 9.5 6.3 3.7 2.0 1.4 2.2 4.2 Counties Like Us 8.9 9.4 10.1 13.0 13.2 11.9 8.6 5.1 3.2 2.8 3.4 3.7 Mason County 16.1 20.4 22.2 24.7 27.3 26.2 21.4 13.0 7.5 5.9 5.5 4.1 Net Migration 808 1,036 1,209 1,386 1,584 1,558 1,287 790 456 360 341 253 All Persons 50,200 50,800 54,551 56,063 57,951 59,459 60,199 60,699 61,096 61,441 61,786 61,985 Updated 11/12/2014 Go to Indicator Comparison Profile 0 5 10 15 20 25 30 Mason County State Counties Like Us Note: Net migration is the annual number of new residents that moved into an area minus the number of residents that moved out of an area. In Washington, the Office of Financial Management estimates annual net migration for twelve months ending on March 31st of a given year. For example, annual net migration in 2009 refers to the period from April 1, 2008 through March 31, 2009. Net migration can change a lot from year to year; calculating a 3-year moving average smoothes net migration. The net migration rate in Year 3 is equal to the average of net migration in Years 1, 2, and 3, divided by the total population in Year 3. The result is then multiplied by 1,000 to measure net migration rate per 1,000 persons. State Source: Office of Financial Management, Net Migration Data 11 Washington State Department of Social and Health Services Research and Data Analysis Division Community Outcome and Risk Evaluation Information System (CORE). Jul 2015.
  • 17.
    Community Domain: Transitionsand Mobility Existing Home Sales Rate Per 1,000 2001 2002 2003 2004 2005 2006 2007 2008 2009 2010 2011 2012 National 18.7 19.6 21.5 23.2 24.0 21.7 18.8 16.2 16.8 13.5 13.7 14.8 State 18.2 19.3 22.4 24.0 25.3 22.5 18.5 12.9 12.7 12.6 12.9 11.7 Counties Like Us 21.3 24.4 29.0 33.0 35.3 30.4 24.0 16.7 15.3 15.7 16.2 11.5 Mason County 26.2 28.5 34.3 34.8 38.0 33.5 24.7 17.2 15.3 14.5 15.2 11.7 Sales 1,300 1,420 1,720 1,770 2,070 1,880 1,430 1,020 920 880 930 720 All Persons 49,600 49,799 50,200 50,800 54,551 56,063 57,951 59,459 60,199 60,699 61,096 61,441 Updated 12/19/2013 Go to Indicator Comparison Profile 0 5 10 15 20 25 30 35 40 Mason County National State Counties Like Us Note: The previously-owned homes sold, per 1,000 persons (all ages). Previously-owned homes sold is rounded to the tens. Existing homes sold are estimated based on data from multiple listing services, firms that monitor deeds, and local Realtors associations. Adjustments were made by the data provider to remove refinanced, rather than sold homes from the counts of sales. State Source: Washington Center for Real Estate Research, Washington State University, Washington State's Housing Market: A Supply/Demand Assessment. Population Estimates: Washington State Office of Financial Management, Forecasting Division National Source: US Census Bureau, Statistical Abstract of the US; Existing One-family Houses Sold 12 Washington State Department of Social and Health Services Research and Data Analysis Division Community Outcome and Risk Evaluation Information System (CORE). Jul 2015.
  • 18.
    Community Domain: Transitionsand Mobility New Residence Construction Rate Per 1,000 2001 2002 2003 2004 2005 2006 2007 2008 2009 2010 2011 2012 National 5.7 6.1 6.4 6.1 5.6 6.2 4.7 3.1 1.9 2.0 2.0 2.6 State 6.4 6.7 7.1 8.2 8.5 7.8 7.3 4.4 2.6 3.1 1.9 2.4 Counties Like Us 5.6 6.4 7.2 7.9 9.0 8.2 7.5 4.1 2.5 2.6 1.8 2.1 Mason County 7.9 8.6 9.6 10.7 11.6 9.8 7.5 4.2 2.7 2.3 2.2 2.0 New Residences 393 429 482 542 633 550 435 250 160 140 134 121 All Persons 49,600 49,799 50,200 50,800 54,551 56,063 57,951 59,459 60,199 60,699 61,096 61,441 Updated 12/19/2013 Go to Indicator Comparison Profile 0 2 4 6 8 10 12 14 Mason County National State Counties Like Us Note: The new building permits issued for single and multi-family dwellings, per 1,000 persons (all ages). Each unit in a multi-family dwelling (for example, each apartment in a building) has a separate building permit. State Source: Washington Center for Real Estate Research, Washington State University, Washington State's Housing Market: A Supply/Demand Assessment. Population Estimates: Washington State Office of Financial Management, Forecasting Division National Source: US Census Bureau, Statistical Abstract of the US; New Privately Owned Housing Units Started 13 Washington State Department of Social and Health Services Research and Data Analysis Division Community Outcome and Risk Evaluation Information System (CORE). Jul 2015.
  • 19.
    Community Domain: AntisocialBehavior of Community Adults Alcohol- or Drug-Related Deaths Percent 2002 2003 2004 2005 2006 2007 2008 2009 2010 2011 2012 2013 State 9.8 10.2 11.1 10.1 11.7 11.8 11.7 12.4 12.5 12.7 12.8 10.8 Counties Like Us 9.7 9.8 11.2 10.8 11.8 11.4 11.6 12.8 12.3 12.5 13.0 10.8 Mason County 12.0 11.1 12.1 12.3 13.8 10.7 11.7 14.5 15.1 12.0 16.3 11.9 AOD-related 57 59 65 72 81 64 67 80 87 74 99 77 Deaths 476 533 539 586 586 601 575 552 577 617 606 649 Updated 9/8/2014 Go to Indicator Comparison Profile Note: The deaths, with alcohol- or drug-related causes, per 100 deaths. Evaluation is based on all contributory causes of death for direct and indirect associations with alcohol and drug abuse. For a complete explanation of the codes and methods used please see Technical Notes: Counting Alcohol- or Drug-related Deaths. Suppression code definitions for yearly rates are explained in Technical Notes. Rates are not reported when fewer than 100 deaths occurred in an area. State Source: Department of Health, Center for Health Statistics, Death Certificate Data File 0 2 4 6 8 10 12 14 16 18 Mason County State Counties Like Us 14 Washington State Department of Social and Health Services Research and Data Analysis Division Community Outcome and Risk Evaluation Information System (CORE). Jul 2015.
  • 20.
    Community Domain: AntisocialBehavior of Community Adults Clients of State-Funded Alcohol or Drug Services (Age 18+) Rate Per 1,000 2002 2003 2004 2005 2006 2007 2008 2009 2010 2011 2012 2013 National 8.0 7.9 7.9 7.8 7.6 7.7 8.1 7.8 7.7 7.0 State 11.8 12.0 12.7 13.4 13.5 13.8 14.4 14.3 13.4 12.9 12.0 12.1 Counties Like Us 14.6 15.9 16.1 16.6 17.4 18.1 19.1 19.5 18.5 17.5 16.8 17.2 Mason County 19.9 20.8 21.5 19.1 18.7 19.3 19.9 21.1 17.4 17.5 16.9 18.6 Admits, 18+ 762 806 848 814 823 880 935 1,006 841 855 834 924 Persons, 18+ 38,344 38,813 39,426 42,643 44,007 45,647 47,010 47,791 48,322 48,896 49,247 49,609 Updated 11/6/2014 Go to Indicator Comparison Profile 0 5 10 15 20 25 Mason County National State Counties Like Us Note: The adults (age 18 and over) receiving state-funded alcohol or drug services, per 1,000 adults. Counts of adults are unduplicated so that those receiving services more than once during the year are only counted once for that year. State-funded services include treatment, assessment, and detox. Persons in Department of Corrections treatment programs are not included. State Source: Department of Social and Health Services, Division of Behavioral Health and Recovery, Treatment and Assessment Report Generation Tool (TARGET). Population Estimates: Washington State Office of Financial Management, Forecasting Division National Source: Office of Applied Studies, Substance Abuse and Mental Health Services Administration, Treatment Episode Data Set (TEDS) 15 Washington State Department of Social and Health Services Research and Data Analysis Division Community Outcome and Risk Evaluation Information System (CORE). Jul 2015.
  • 21.
    Community Domain: AntisocialBehavior of Community Adults Arrests (Age 18+), Alcohol-Related Rate Per 1,000 2002 2003 2004 2005 2006 2007 2008 2009 2010 2011 2012 2013 National 13.0 11.2 11.0 10.6 11.0 10.9 11.1 10.6 10.1 9.0 8.9 7.9 State 11.3 11.8 11.8 10.6 10.7 10.4 9.6 9.9 9.3 9.4 7.3 6.7 Counties Like Us 9.5 9.5 8.1 6.7 6.5 6.6 6.9 6.5 5.3 4.8 3.0 3.7 Mason County 7.9 6.0 5.3 2.9 4.0 4.5 5.6 5.1 5.5 3.4 1.4 2.3 Arrests, 18+ 298 228 205 122 176 202 260 242 260 130 66 111 Adjusted Pop 18+ 37,879 37,823 38,958 42,160 43,518 45,153 46,515 47,294 47,609 37,965 48,546 48,906 Updated 10/7/2014 Go to Indicator Comparison Profile 0 2 4 6 8 10 12 14 Mason County National State Counties Like Us Note: The alcohol violations (age 18+), per 1,000 adults (age 18+). Alcohol violations include all crimes involving driving under the influence, liquor law violations, and drunkenness. DUI arrests by the Washington State Patrol are included in the state trend analysis. However, they are not included in the county rankings since WSP arrests are not assigned to counties. Denominators are adjusted by subtracting the population of police agencies that did not report arrests to WASPC. In spite of this population adjustment, when the non-reporting police jurisdiction is where much of the crime occurs, the rate for the county will be lower than it would be if that jurisdiction was included. For percent subtracted, suppression code definitions and the agencies not reporting, see the Technical Notes and the appendix on Non-Reporting Agencies and Population. The crimes types used within this rate are represented in both Summary UCR and NIBRS systems and are not likely to be substantially impacted by the system change. State Source: Washington Association of Sheriffs and Police Chiefs (WASPC): Uniform Crime Report (UCR), National Incident-Based Reporting System (NIBRS) Population Estimates: Washington State Office of Financial Management, Forecasting Division National Source: US Department of Justice, Bureau of Justice Statistics Sourcebook of Criminal Justice Statistics Online 16 Washington State Department of Social and Health Services Research and Data Analysis Division Community Outcome and Risk Evaluation Information System (CORE). Jul 2015.
  • 22.
    Community Domain: AntisocialBehavior of Community Adults Arrests (Age 18+), Drug Law Violation Rate Per 1,000 2002 2003 2004 2005 2006 2007 2008 2009 2010 2011 2012 2013 National 7.1 6.8 7.1 7.4 7.6 7.3 6.7 6.5 6.3 5.8 5.9 5.9 State 5.5 5.8 5.3 5.3 6.4 6.2 5.1 4.6 4.4 4.6 2.4 2.2 Counties Like Us 5.0 5.6 5.1 4.7 5.4 5.5 5.2 4.2 4.3 4.7 2.8 3.3 Mason County 4.7 4.1 5.1 5.2 4.3 5.5 6.6 3.9 2.9 3.4 1.8 2.2 Arrests, 18+ 179 155 197 220 187 246 305 182 140 128 89 109 Adjusted Pop 18+ 37,879 37,823 38,958 42,160 43,518 45,153 46,515 47,294 47,609 37,965 48,546 48,906 Updated 10/7/2014 Go to Indicator Comparison Profile 0 1 2 3 4 5 6 7 8 Mason County National State Counties Like Us Note: The arrests of adults (age 18+) for drug law violations, per 1,000 adults (age 18+). Drug law violations include all crimes involving sale, manufacturing, and possession of drugs. Denominators are adjusted by subtracting the population of police agencies that did not report arrests to WASPC. In spite of this population adjustment, when the non-reporting police jurisdiction is where much of the crime occurs, the rate for the county will be lower than it would be if that jurisdiction was included. For percent subtracted, suppression code definitions and the agencies not reporting, see the Technical Notes and the appendix on Non-Reporting Agencies and Population. The crimes types used within this rate are represented in both Summary UCR and NIBRS systems and are not likely to be substantially impacted by the system change. State Source: Washington Association of Sheriffs and Police Chiefs (WASPC): Uniform Crime Report (UCR), National Incident-Based Reporting System (NIBRS) Population Estimates: Washington State Office of Financial Management, Forecasting Division National Source: US Department of Justice, Bureau of Justice Statistics Sourcebook of Criminal Justice Statistics Online 17 Washington State Department of Social and Health Services Research and Data Analysis Division Community Outcome and Risk Evaluation Information System (CORE). Jul 2015.
  • 23.
    Community Domain: AntisocialBehavior of Community Adults Arrests (Age 18+), Violent Crime Rate Per 1,000 2002 2003 2004 2005 2006 2007 2008 2009 2010 2011 2012 2013 National 2.8 2.3 2.3 2.3 2.3 2.2 2.2 2.2 2.0 2.0 1.9 1.9 State 1.5 1.6 1.6 1.6 1.5 1.5 1.5 1.6 1.6 1.6 1.5 1.5 Counties Like Us 1.9 1.8 2.3 1.9 1.7 1.7 1.8 1.7 1.6 1.6 1.2 1.6 Mason County 2.6 1.9 2.5 2.4 2.5 2.8 2.2 2.4 1.8 2.3 1.3 1.7 Arrests, 18+ 97 70 98 100 108 127 102 112 85 88 61 81 Adjusted Pop 18+ 37,879 37,823 38,958 42,160 43,518 45,153 46,515 47,294 47,609 37,965 48,546 48,906 Updated 10/7/2014 Go to Indicator Comparison Profile 0 1 1 2 2 3 3 Mason County National State Counties Like Us Note: The arrests of adults (age 18+) for violent crime per 1,000 adults (age 18+). Violent crimes include all crimes involving criminal homicide, forcible rape, robbery, and aggravated assault. Simple assault is not defined as a violent crime. Denominators are adjusted by subtracting the population of police agencies that did not report arrests to WASPC. In spite of this population adjustment, when the non-reporting police jurisdiction is where much of the crime occurs, the rate for the county will be lower than it would be if that jurisdiction was included. For percent subtracted, suppression code definitions and the agencies not reporting, see the Technical Notes and the appendix on Non-Reporting Agencies and Population. The crimes types used within this rate are represented in both Summary UCR and NIBRS systems and are not likely to be substantially impacted by the system change. State Source: Washington Association of Sheriffs and Police Chiefs (WASPC): Uniform Crime Report (UCR), National Incident-Based Reporting System (NIBRS) Population Estimates: Washington State Office of Financial Management, Forecasting Division National Source: US Department of Justice, Bureau of Justice Statistics Sourcebook of Criminal Justice Statistics Online 18 Washington State Department of Social and Health Services Research and Data Analysis Division Community Outcome and Risk Evaluation Information System (CORE). Jul 2015.
  • 24.
    Community Domain: LowNeighborhood Attachment and Community Disorganization Prisoners in State Correctional Systems (Age 18+) Rate Per 100,000 2002 2003 2004 2005 2006 2007 2008 2009 2010 2011 2012 2013 National 476.0 482.0 486.0 491.0 501.0 506.0 504.0 502.0 497.0 492.0 480.0 478.0 State 143.1 198.1 291.9 346.6 366.6 411.3 403.0 400.1 400.4 367.9 401.6 465.7 Counties Like Us 168.4 209.1 253.0 343.0 377.7 446.3 415.4 437.4 493.3 523.3 633.8 761.1 Mason County 198.8 257.0 305.1 379.5 399.6 434.9 418.8 340.5 332.8 299.5 475.3 734.8 Prisoners, 18+ 99 129 155 207 224 252 249 205 202 183 292 454 All Persons 49,799 50,200 50,800 54,551 56,063 57,951 59,459 60,199 60,699 61,096 61,441 61,786 Updated 8/4/2014 Go to Indicator Comparison Profile 0 100 200 300 400 500 600 700 800 Mason County National State Counties Like Us Note: The adult (age 18 and over) admissions to prison, per 100,000 persons (all ages). Admissions include new admissions, re-admissions, community custody inmate violations, and parole violations. Counts of admissions are duplicated so that individuals admitted to prison more than once in a year are counted each time they are admitted. The admissions are attributed to the county where the conviction occurred. In 2003 prisoners being electronically monitored are included in the data. This causes a jump in numbers for counties which use this incarceration option. Suppression code definitions for yearly rates are explained in Technical Notes. State Source: Department of Corrections, Inmates File. Population Estimates: Washington State Office of Financial Management, Forecasting Division 19 Washington State Department of Social and Health Services Research and Data Analysis Division Community Outcome and Risk Evaluation Information System (CORE). Jul 2015.
  • 25.
    Community Domain: LowNeighborhood Attachment and Community Disorganization Population Not Registered to Vote Percent 2003 2004 2005 2006 2007 2008 2009 2010 2011 2012 2013 2014 National 34.1 38.4 37.4 34.9 28.8 State 29.8 24.5 29.1 32.9 33.6 27.8 29.7 30.0 29.6 25.5 26.2 27.1 Counties Like Us 28.9 22.1 26.7 27.6 29.1 25.1 26.2 26.9 26.6 24.3 24.8 25.7 Mason County 29.8 21.2 27.4 30.5 34.0 30.2 30.8 31.0 31.2 28.4 29.2 29.5 Not Registered 11,568 8,343 11,683 13,436 15,531 14,182 14,706 14,978 15,233 13,979 14,463 14,708 Persons, 18+ 38,813 39,426 42,643 44,007 45,647 47,010 47,791 48,322 48,896 49,247 49,609 49,838 Updated 1/5/2015 Go to Indicator Comparison Profile 0 5 10 15 20 25 30 35 40 45 Mason County National State Counties Like Us Note: The persons not registered to vote in the November elections, per 100 adults (age 18 and over). As part of the November Current Population Survey (the Voting and Registration Supplement), the Bureau of the Census collects data on voting and registration in years with presidential or congressional elections (i.e. every other year). State Source: Office of the Secretary of State, Elections Division, Registered Voters. Population Estimates: Washington State Office of Financial Management, Forecasting Division National Source: Calculated using data from U.S. Census Bureau, Statistical Abstract of the United States; "Voting-Age 20 Washington State Department of Social and Health Services Research and Data Analysis Division Community Outcome and Risk Evaluation Information System (CORE). Jul 2015.
  • 26.
    Community Domain: LowNeighborhood Attachment and Community Disorganization Registered And Not Voting in the November Election Percent 2003 2004 2005 2006 2007 2008 2009 2010 2011 2012 2013 2014 National 11.5 29.2 10.4 30.1 13.2 State 59.5 17.8 45.2 35.5 50.0 15.4 49.1 28.8 47.1 18.8 54.7 45.8 Counties Like Us 50.0 16.1 36.0 31.6 42.9 14.0 44.0 25.1 41.5 18.6 48.7 39.6 Mason County 56.7 16.9 37.2 29.7 38.5 12.6 43.5 24.0 40.7 18.6 48.8 40.5 Not Voting 15,441 5,247 11,518 9,067 11,607 4,130 14,404 7,997 13,684 6,555 17,133 14,227 Reg'd Voters 27,245 31,083 30,960 30,571 30,116 32,828 33,085 33,344 33,663 35,268 35,146 35,130 Updated 1/5/2015 Go to Indicator Comparison Profile 0 10 20 30 40 50 60 70 Mason County National State Counties Like Us Note: The persons registered to vote in the November elections but not voting, per 100 adults (age 18 and over) registered to vote. As part of the November Current Population Survey (the Voting and Registration Supplement), the Bureau of the Census collects data on voting and registration in years with presidential or congressional elections (i.e. every other year). State Source: Office of the Secretary of State, Elections Division, Registered Voters. Population Estimates: Washington State Office of Financial Management, Forecasting Division National Source: Calculated using data from U.S. Census Bureau, Statistical Abstract of the United States; "Voting-Age Population, Percent Reporting Registered, and Voted" 21 Washington State Department of Social and Health Services Research and Data Analysis Division Community Outcome and Risk Evaluation Information System (CORE). Jul 2015.
  • 27.
    Family Domain: FamilyProblems Divorce Rate Per 1,000 2002 2003 2004 2005 2006 2007 2008 2009 2010 2011 2012 2013 State 5.9 5.5 5.6 5.4 5.1 5.0 4.8 4.9 5.2 5.1 4.9 4.8 Counties Like Us 6.1 6.1 6.1 5.7 5.1 5.2 5.0 4.9 5.2 5.2 5.0 4.8 Mason County 6.1 6.2 6.1 6.1 4.7 5.0 4.8 4.9 5.1 5.0 4.6 5.1 Divorces 248 254 255 272 219 241 238 247 258 256 235 263 Persons, 15+ 40,568 41,035 41,653 44,904 46,311 47,998 49,343 50,056 50,551 50,996 51,351 51,673 Updated 11/13/2014 Go to Indicator Comparison Profile 0 1 2 3 4 5 6 7 Mason County State Counties Like Us Note: The divorces per 1,000 persons (age 15 and over). Divorce includes dissolutions, annulments, and unknown decree types; it does not include legal separations. Divorce data is reported by the woman's residence, if in Washington at the time of decree. If the woman lived outside Washington, the man's residence was used. If both parties residence was unknown the event is not assigned to a county, but is included in the state rate. The National rate is based on age 18 and over population. Suppression code definitions for yearly rates are explained in Technical Notes. State Source: Department of Health, Center for Health Statistics, Dissolution and Annulment Data. Population Estimates: Washington State Department of Health National Source: Calculated using Department of Health and Human Services, Centers for Disease Control and Prevention, National Center for Health Statistics, National Vital Statistics System, National Vital Statistics Reports Births, Marriages, Divorces, and Deaths, Provisional Data 22 Washington State Department of Social and Health Services Research and Data Analysis Division Community Outcome and Risk Evaluation Information System (CORE). Jul 2015.
  • 28.
    Family Domain: FamilyProblems Victims of Child Abuse and Neglect in Accepted Referrals Rate Per 1,000 2003 2004 2005 2006 2007 2008 2009 2010 2011 2012 2013 2014 National 46.3 47.7 48.3 47.9 47.2 49.4 48.1 44.5 41.9 52.1 State 40.9 38.1 35.0 34.1 34.0 31.6 32.0 31.8 33.9 34.3 34.4 32.4 Counties Like Us 63.4 54.7 53.8 45.7 44.7 40.3 42.0 45.1 46.1 49.2 51.3 47.5 Mason County 67.4 61.2 48.0 47.0 55.8 43.6 47.7 52.4 57.1 49.3 54.0 45.8 Accepted Victims 767 696 572 566 686 543 592 649 696 601 657 556 Persons, birth-17 11,387 11,373 11,908 12,056 12,305 12,449 12,408 12,377 12,200 12,194 12,177 12,147 Updated 6/15/2015 Go to Indicator Comparison Profile 0 10 20 30 40 50 60 70 80 Mason County National State Counties Like Us Note: The children (age birth-17) identified as victims in reports to Child Protective Services that were accepted for further action, per 1,000 children (age birth-17). Children are counted more than once if they are reported as a victim more than once during the year. A "referral" is a report of suspected child abuse which may have multiple listed victims. Numbers may differ due to corrections or changes in location definition made in the database extraction process. Child location is derived from the residence at the time of referral. Suppression code definitions for yearly rates are explained in Technical Notes. State Source: Department of Social and Health Services, Children's Administration FamLink Data Warehouse. Population Estimates: Washington State Office of Financial Management, Forecasting Division National Source: US Department of Health and Human Services Administration for Children and Families, Voluntary Cooperative Information System(VCIS), and estimates from Adoption, Foster Care Analysis Reporting System(AFCARS) 23 Washington State Department of Social and Health Services Research and Data Analysis Division Community Outcome and Risk Evaluation Information System (CORE). Jul 2015.
  • 29.
    School Domain: AcademicAchievement Poor Academic Performance, Grade 10 Percent 2002 2003 2004 2005 2006 2007 2008 2009 2010 2011 2012 2013 State 69.8 66.4 72.7 57.5 63.9 63.0 62.8 65.0 75.6 50.9 40.1 31.6 Counties Like Us 73.3 70.6 76.1 61.9 67.7 67.6 68.2 70.7 79.3 55.6 43.3 36.1 Mason County 69.6 71.5 81.2 64.2 66.4 68.0 71.8 74.9 85.9 56.9 46.6 41.4 Low Scorers 470 481 527 423 334 302 316 304 743 252 218 207 Tested, 10th grade 675 673 649 659 503 444 440 406 865 443 468 500 Updated 4/14/2014 Go to Indicator Comparison Profile 0 10 20 30 40 50 60 70 80 90 100 Mason County State Counties Like Us Note: The students tested who failed one or more content areas as a percent of all students tested at the 10th grade level. Some districts have chosen to test students in both grades 9 and 10 for the 10th grade assessment. All students being tested at the 10th grade level are included in these data regardless of their grade placement. Tests are given in the spring of the year. For example, data for 2008 is for students in the 10th grade during the school year 2007/2008. By contractual agreement data is suppressed when less than ten students were tested to avoid individual student identification. In 2009-10 the tenth grade WASL was replaced by the High School Proficiency Exam (HSPE). This test was built on the same framework as the WASL, but contain fewer questions. It is considered equivalent by OSPI. State Source: Office of Superintendent of Public Instruction, Instructional Programs, Curriculum and Assessment, Grade 10 Failing In One Or More Content Areas. 24 Washington State Department of Social and Health Services Research and Data Analysis Division Community Outcome and Risk Evaluation Information System (CORE). Jul 2015.
  • 30.
    School Domain: AcademicAchievement Poor Academic Performance, Grade 7 Percent 2002 2003 2004 2005 2006 2007 2008 2009 2010 2011 2012 2013 State 77.9 72.8 63.8 58.7 60.1 53.9 57.4 58.3 56.4 57.0 49.6 47.8 Counties Like Us 80.7 75.8 67.7 62.9 63.3 59.5 64.2 64.7 62.6 64.0 55.0 53.3 Mason County 84.2 80.1 72.1 69.0 73.9 66.6 68.6 74.4 68.0 70.7 57.5 57.2 Low Scorers 545 550 491 442 427 407 410 450 422 424 331 324 Tested, 7th grade 647 687 681 641 578 611 598 605 621 600 576 566 Updated 4/14/2014 Go to Indicator Comparison Profile 0 10 20 30 40 50 60 70 80 90 Mason County State Counties Like Us Note: The students tested who failed one or more content areas as a percent of all students tested at the 7th grade level. Tests are given in the spring of the year. Data for 2008 is for students in the 7th grade during the school year 2007/2008. By contractual agreement data is suppressed when less than ten students were tested to avoid individual student identification. In 2009-10 the 7th grade WASL was replaced by Measurements of Student Progress (MSP). This test was built on the same framework as the WASL, but contain fewer questions. It is considered equivalent by OSPI. State Source: Office of Superintendent of Public Instruction, Instructional Programs, Curriculum and Assessment, Grade 7 Failing In One Or More Content Areas. 25 Washington State Department of Social and Health Services Research and Data Analysis Division Community Outcome and Risk Evaluation Information System (CORE). Jul 2015.
  • 31.
    School Domain: AcademicAchievement Poor Academic Performance, Grade 4 Percent 2002 2003 2004 2005 2006 2007 2008 2009 2010 2011 2012 2013 State 70.9 65.6 56.4 54.8 52.8 54.1 56.5 58.3 59.8 55.0 54.3 51.7 Counties Like Us 76.6 71.0 63.1 61.2 59.2 61.8 64.1 65.7 68.4 63.4 62.9 60.4 Mason County 81.5 78.8 65.5 66.2 67.0 66.3 71.6 72.8 70.7 69.5 67.0 65.8 Low Scorers 486 464 387 391 356 380 408 420 442 391 374 360 Tested, 4th grade 596 589 591 591 531 573 570 577 625 563 558 547 Updated 4/14/2014 Go to Indicator Comparison Profile 0 10 20 30 40 50 60 70 80 90 Mason County State Counties Like Us Note: The students tested who failed one or more content areas as a percent of all students tested at the 4th grade level. Tests are given in the spring of the year. Data for 2008 is for students in the 4th grade during the school year 2007/2008. By contractual agreement data is suppressed when less than ten students were tested to avoid individual student identification. In 2009-10 the 4th grade WASL was replaced by Measurements of Student Progress (MSP). This test was built on the same framework as the WASL, but contain fewer questions. It is considered equivalent by OSPI. State Source: Office of Superintendent of Public Instruction, Instructional Programs, Curriculum and Assessment, Grade 4 Failing In One Or More Content Areas. 26 Washington State Department of Social and Health Services Research and Data Analysis Division Community Outcome and Risk Evaluation Information System (CORE). Jul 2015.
  • 32.
    School Domain: AcademicAchievement High school Cohort (Cumulative) Dropouts Percent 2003 2004 2005 2006 2007 2008 2009 2010 2011 2012 2013 2014 National 15.1 16.7 15.7 State 21.4 21.0 21.4 19.4 17.6 13.9 13.6 13.0 12.3 Counties Like Us 24.3 27.5 31.2 28.5 29.4 21.9 16.6 19.9 17.6 Mason County 27.1 26.5 29.8 20.3 17.7 14.6 14.0 12.2 12.2 204.00 196.00 228.00 136.00 106.00 . . . . 2,826 2,749 2,729 2,573 2,490 . . . . Updated 3/25/2015 Go to Indicator Comparison Profile 0 5 10 15 20 25 30 35 Mason County National State Counties Like Us Note: The percent of students dropping out prior to graduation. The High School Cohort Dropout rate (may also be referred to as the longitudinal, cumulative, or freshmen cohort dropout rate) measures what happens to a single group (or cohort) of students over a period of time. This rate is most useful for seeing the long-term impact on the community. The Estimated Cohort (old method) rate formula used data from multiple grades in a single year. The Adjusted Cohort (new method) rate is the number of students in the same freshman cohort dropping out prior to graduation divided by the adjusted freshman class cohort of the graduates. Beginning with the 9-grade cohort due to graduate in the 2010/2011 school year, OSPI has started using the actual cohort of students for their calculations. For more information on the changes in rate computation and cohort methodology, see the Technical Notes. State Source: Office of Superintendent of Public Instruction, Graduation and Dropout Statistics for Washington. Estimated Cohort Method Adjusted Freshman Cohort Method 27 Washington State Department of Social and Health Services Research and Data Analysis Division Community Outcome and Risk Evaluation Information System (CORE). Jul 2015.
  • 33.
    School Domain: AcademicAchievement Annual (Event) Dropouts Percent 2001 2002 2003 2004 2005 2006 2007 2008 2009 2010 2011 2012 National 3.9 4.4 4.1 4.1 State 5.7 5.6 5.6 5.1 4.6 4.4 4.1 Counties Like Us 6.5 7.5 8.7 7.9 8.2 7.9 7.7 Mason County 7.2 7.1 8.4 5.3 4.3 4.2 3.9 Dropouts 204 196 228 136 106 107 94 Students 2,826 2,749 2,729 2,573 2,490 2,525 2,424 Updated 3/25/2015 Go to Indicator Comparison Profile 0 1 2 3 4 5 6 7 8 9 10 Mason County National State Counties Like Us Note: The Annual Dropout rate measures the proportion of students enrolled in grades 9-12 who drop out in a single year without completing high school as a percentage of all students in grades 9 through 12 that year. When districts try new policies or projects to keep students in school the impact of those actions will be more immediately visible in this rate. This rate is much more time intensive to compute with the new cohort designations for students as it draws information from four separate cohorts. This indicator will have a break in data production while data collection transitions to using the adjusted cohort for most other calculations. The formula for this indicator has not changed. For more information on the changes in rate computation and cohort methodology, see the Technical Notes. State Source: Office of Superintendent of Public Instruction, Graduation and Dropout Statistics for Washington. 28 Washington State Department of Social and Health Services Research and Data Analysis Division Community Outcome and Risk Evaluation Information System (CORE). Jul 2015.
  • 34.
    School Domain: AcademicAchievement On-time Graduation Percent 2003 2004 2005 2006 2007 2008 2009 2010 2011 2012 2013 2014 National 73.4 73.9 74.7 75.5 76.3 State 70.5 72.5 72.0 73.5 76.5 76.6 77.2 76.0 77.2 Counties Like Us 66.2 65.5 60.8 61.6 66.8 67.0 71.6 67.2 70.0 Mason County 59.1 64.7 40.8 68.8 81.2 68.5 66.8 72.7 72.3 Updated 3/25/2015 Go to Indicator Comparison Profile 0 10 20 30 40 50 60 70 80 90 Mason County National State Counties Like Us Note: The percent of students who graduate in four years by completion of the graduation requirements. The Adjusted Cohort (new method) rate divides the number of students in the same freshman cohort graduating in their fourth year by the adjusted freshman cohort for those students. In this method there are no adjustments for Special Ed or Limited English students who are expected to take longer, and transfers from out of state or other districts who are credit deficient may not be reclassified into a lower grade. Prior to the 2011 the Estimated Cohort method used a complex formula to estimate the graduation rate from data for multiple grades during the graduation year. The differences in graduation rates from 2010 to 2011 is likely to be due to the change in computation method. For more information on the changes in rate computation and cohort methodology, see the Technical Notes. State Source: Office of Superintendent of Public Instruction, Graduation and Dropout Statistics for Washington. Estimated Cohort Method Adjusted Freshman Cohort Method 29 Washington State Department of Social and Health Services Research and Data Analysis Division Community Outcome and Risk Evaluation Information System (CORE). Jul 2015.
  • 35.
    School Domain: AcademicAchievement Extended Graduation Percent 2003 2004 2005 2006 2007 2008 2009 2010 2011 2012 2013 2014 State 75.1 77.5 77.1 79.2 82.6 78.2 78.9 78.8 79.9 Counties Like Us 71.0 70.4 65.3 66.4 73.1 69.8 69.7 68.8 72.1 Mason County 62.7 70.3 46.3 77.3 92.6 73.6 76.4 79.4 80.7 Updated 3/25/2015 Go to Indicator Comparison Profile 0 10 20 30 40 50 60 70 80 90 100 Mason County State Counties Like Us Note: The percent of students who graduate including those students who stay in school and take more than four years to complete their degree. The Estimated Cohort (old method) Extended Graduation rate formula is: (the number of on-time and late graduates in the same year)/(the number of on-time graduates divided by the on-time graduation rate). The Adjusted Cohort (new method) rate is the number of students graduating within five years divided by the adjusted freshman cohort for the graduates. The new method does not include graduates after year 5 to the extended graduation rate. For more information on the changes in rate computation and cohort methodology, see the Technical Notes. State Source: Office of Superintendent of Public Instruction, Graduation and Dropout Statistics for Washington. Estimated Cohort Method Adjusted Freshman Cohort Method 30 Washington State Department of Social and Health Services Research and Data Analysis Division Community Outcome and Risk Evaluation Information System (CORE). Jul 2015.
  • 36.
    Problem Outcomes: SchoolClimate Weapons Incidents in School Rate Per 1,000 2003 2004 2005 2006 2007 2008 2009 2010 2011 2012 2013 2014 State 2.9 2.8 3.0 3.3 3.1 2.9 2.9 2.8 2.7 2.6 2.0 1.9 Counties Like Us 3.5 3.5 3.5 3.5 3.4 3.7 3.3 3.1 2.6 2.6 2.1 1.9 Mason County 5.9 3.9 4.2 3.9 6.1 3.8 5.7 6.6 3.7 4.7 2.1 2.5 Incidents 48 32 34 32 51 32 47 54 30 38 17 20 Enrollment 8,176 8,209 8,152 8,254 8,354 8,331 8,242 8,174 8,198 8,100 7,965 7,974 Updated 5/8/2015 Go to Indicator Comparison Profile 0.0 1.0 2.0 3.0 4.0 5.0 6.0 7.0 Mason County State Counties Like Us Note: The reported incidents involving guns and other weapons at any grade level per 1000 students enrolled in October of all grades. State Source: Office of Superintendent of Public Instruction, Information Services, Safe and Drug-free Schools: Report to the Legislature on Weapons in Schools RCW 28A.320.130 31 Washington State Department of Social and Health Services Research and Data Analysis Division Community Outcome and Risk Evaluation Information System (CORE). Jul 2015.
  • 37.
    Problem Outcomes: SchoolClimate Unexcused Absences for Students in Grades 1 to 8 Rate Per 1,000 2002 2003 2004 2005 2006 2007 2008 2009 2010 2011 2012 2013 State 4.5 4.2 4.3 3.9 3.8 3.8 3.6 3.8 4.3 5.1 Counties Like Us 6.1 4.7 4.3 3.8 3.9 3.5 3.9 4.1 4.7 5.9 Mason County 11.4 5.0 5.7 6.8 5.0 5.6 7.3 4.8 5.5 5.6 Absences 9,392 4,030 4,566 5,418 3,989 4,406 5,934 3,787 4,365 4,261 Potential Days 825,182 801,825 797,097 802,347 803,384 788,759 812,486 792,412 791,541 761,503 Updated 10/16/2013 Go to Indicator Comparison Profile 0 2 4 6 8 10 12 Mason County State Counties Like Us Note: The unexcused absences for students in grades 1-8 per thousand potential school days. Potential school days are the number of days students were taught from the first day of school through May 31 in each school building multiplied by the net served students in grades 1-8 in that building. The definition of an unexcused absence is a local decision, so the definition differs among schools and districts. In general, a student who has an unexcused absence has not attended a majority of hours or periods in a school day, or has not complied with a more restrictive district policy, and has not met the conditions for an excused absence (see RCW 28A.225.020). State Source: Office of Superintendent of Public Instruction, Washington State Report Card, Unexcused Absence Files. 32 Washington State Department of Social and Health Services Research and Data Analysis Division Community Outcome and Risk Evaluation Information System (CORE). Jul 2015.
  • 38.
    Individual/Peer Domain: EarlyCriminal Justice Involvement Arrests (Age 10-14), Alcohol- or Drug-Related Rate Per 1,000 2002 2003 2004 2005 2006 2007 2008 2009 2010 2011 2012 2013 National 2.5 2.3 2.3 2.1 2.2 2.1 2.0 2.0 2.0 1.7 1.6 1.3 State 3.1 3.1 3.0 2.6 2.6 2.7 2.4 2.4 2.8 2.8 2.0 1.9 Counties Like Us 5.5 6.0 5.0 4.4 5.2 5.4 4.0 4.1 4.0 5.1 3.0 3.7 Mason County 3.4 3.8 2.9 2.3 3.2 8.9 5.8 3.5 2.6 4.8 1.8 0.6 Arrests, 10-14 12 13 10 8 11 31 20 12 9 13 6 2 Adjusted Pop 10-14 3,486 3,430 3,468 3,506 3,479 3,482 3,476 3,445 3,403 2,726 3,421 3,398 Updated 10/7/2014 Go to Indicator Comparison Profile 0 1 2 3 4 5 6 7 8 9 10 Mason County National State Counties Like Us Note: The arrests of younger adolescents (age 10-14) for alcohol and drug law violations, per 1,000 adolescents (age 10-14). Alcohol violations include all crimes involving driving under the influence, liquor law violations, and drunkenness. For children, arrests for liquor law violations are usually arrests for minor in possession. Drug law violations include all crimes involving sale, manufacturing, and possession of drugs. 1) Denominators are adjusted by subtracting the population of police agencies that did not report arrests to UCR/NIBRS. In spite of this population adjustment, when the non-reporting police jurisdiction is where much of the crime occurs, the rate for the county will be lower than it would be if that jurisdiction was included. For percent subtracted, suppression code definitions and the agencies not reporting, see the Technical Notes and the appendix on Non-Reporting Agencies and Population. 2) The DUI portion of this measure is likely understated, because arrests made by the State Patrol are not attributable to counties. State Patrol arrests are included in the state rates. The crimes types used within this rate are represented in both Summary UCR and NIBRS systems and are not likely to be substantially impacted by the system change. State Source: Washington Association of Sheriffs and Police Chiefs (WASPC): Uniform Crime Report (UCR), National Incident-Based Reporting System (NIBRS) Population Estimates: Washington State Office of Financial Management, Forecasting Division National Source: US Department of Justice, Bureau of Justice Statistics Sourcebook of Criminal Justice Statistics Online 33 Washington State Department of Social and Health Services Research and Data Analysis Division Community Outcome and Risk Evaluation Information System (CORE). Jul 2015.
  • 39.
    Individual/Peer Domain: EarlyCriminal Justice Involvement Arrests (Age 10-14), Vandalism Rate Per 1,000 2002 2003 2004 2005 2006 2007 2008 2009 2010 2011 2012 2013 National 2.3 2.1 2.0 2.0 2.2 2.2 2.1 1.7 1.4 1.2 1.1 0.9 State 2.3 2.4 2.4 2.2 2.2 2.4 2.4 1.7 1.6 1.6 1.2 1.0 Counties Like Us 2.8 3.0 2.9 2.8 3.1 3.3 3.4 2.3 2.2 2.9 1.0 1.5 Mason County 2.0 0.3 4.3 0.9 1.2 1.7 2.9 1.7 2.4 1.8 0.6 0.3 Arrests, 10-14 7 1 15 3 4 6 10 6 8 5 2 1 Adjusted Pop 10-14 3,486 3,430 3,468 3,506 3,479 3,482 3,476 3,445 3,403 2,726 3,421 3,398 Updated 10/7/2014 Go to Indicator Comparison Profile 0 1 1 2 2 3 3 4 4 5 5 Mason County National State Counties Like Us Note: The arrests of younger adolescents (age 10-14) for vandalism (including residence, non-residence, vehicles, venerated objects, police cars, or other) per 1,000 adolescents (age 10-14). Denominators are adjusted by subtracting the population of police agencies that did not report arrests to UCR/NIBRS. In spite of this population adjustment, when the non-reporting police jurisdiction is where much of the crime occurs, the rate for the county will be lower than it would be if that jurisdiction was included. For percent subtracted, suppression code definitions and the agencies not reporting, see the Technical Notes and the appendix on Non-Reporting Agencies and Population. The crimes types used within this rate are represented in both Summary UCR and NIBRS systems and are not likely to be substantially impacted by the system change. State Source: Washington Association of Sheriffs and Police Chiefs (WASPC): Uniform Crime Report (UCR), National Incident-Based Reporting System (NIBRS) Population Estimates: Washington State Office of Financial Management, Forecasting Division National Source: US Department of Justice, Bureau of Justice Statistics Sourcebook of Criminal Justice Statistics Online 34 Washington State Department of Social and Health Services Research and Data Analysis Division Community Outcome and Risk Evaluation Information System (CORE). Jul 2015.
  • 40.
    Individual/Peer Domain: EarlyCriminal Justice Involvement Total Arrests of Adolescents (Age 10-14) Rate Per 1,000 2002 2003 2004 2005 2006 2007 2008 2009 2010 2011 2012 2013 National 36.8 32.3 32.6 32.5 30.9 29.6 28.4 25.4 21.2 18.9 17.3 14.8 State 27.8 27.9 26.6 23.2 22.1 21.3 20.0 17.8 17.8 16.8 12.4 11.9 Counties Like Us 39.6 39.2 35.8 29.0 30.7 29.5 29.1 25.7 22.4 25.0 14.1 16.9 Mason County 27.0 27.4 40.4 31.7 34.8 34.8 30.8 20.9 16.5 19.4 9.1 7.4 Arrests, 10-14 94 94 140 111 121 121 107 72 56 53 31 25 Adjusted Pop 10-14 3,486 3,430 3,468 3,506 3,479 3,482 3,476 3,445 3,403 2,726 3,421 3,398 Updated 10/7/2014 Go to Indicator Comparison Profile 0 5 10 15 20 25 30 35 40 45 Mason County National State Counties Like Us Note: The arrests of adolescents (age 10-14) for any crime, per 1,000 adolescents (age 10-14). Washington State has transitioned from Summary UCR to the NIBRS system for reporting. Summary UCR collects eight (8) Part One Crime offenses: criminal homicide, forcible rape, robbery, aggravated assault, burglary, larceny, motor vehicle theft and arson. NIBRS collects information on twenty-three (23) different offenses, including all Part One Crimes plus others including forcible and non-forcible sex offenses, fraud, kidnapping, and drug violations. Care must be taken when interpreting the yearly trend of "total arrest" rates for an area. In areas where large amounts of arrests are likely for crimes not previously reported, a substantial increase in total arrests could be expected starting with the 2012 data. Denominators are adjusted by subtracting the population of police agencies that did not report arrests to WASPC. For more information, see the Technical Notes and the appendix on Non-Reporting Agencies and Population. State Source: Washington Association of Sheriffs and Police Chiefs (WASPC): Uniform Crime Report (UCR), National Incident-Based Reporting System (NIBRS) Population Estimates: Washington State Office of Financial Management, Forecasting Division National Source: US Department of Justice, Bureau of Justice Statistics Sourcebook of Criminal Justice Statistics Online Summary UCR NIBRS 35 Washington State Department of Social and Health Services Research and Data Analysis Division Community Outcome and Risk Evaluation Information System (CORE). Jul 2015.
  • 41.
    Problem Outcomes: Childor Family Health Injury or Accident Hospitalizations for Children Percent 2002 2003 2004 2005 2006 2007 2008 2009 2010 2011 2012 2013 State 3.7 3.3 3.9 4.2 4.0 3.9 4.0 4.1 4.2 4.3 4.5 4.4 Counties Like Us 4.4 4.0 4.6 4.9 4.4 4.2 4.1 4.2 4.1 4.2 4.4 4.4 Mason County 6.1 4.3 5.1 5.6 5.5 5.2 4.2 4.9 3.6 3.7 5.8 5.7 Injuries 48 35 41 52 50 47 37 49 30 31 53 45 Hospitalizations 790 808 801 928 910 907 880 1,010 844 832 913 788 Updated 8/24/2014 Go to Indicator Comparison Profile 0 1 2 3 4 5 6 7 Mason County State Counties Like Us Note: The child injury or accident hospitalizations as a percent of all hospitalizations for children (age birth-17). Suppression code definitions for yearly rates are explained in Technical Notes. Due to contractual agreement data may not be displayed for areas with less than 100 hospitalizations. State Source: Department of Health, Office of Hospital and Patient Data Systems, Comprehensive Hospital Abstract Reporting System (CHARS) 36 Washington State Department of Social and Health Services Research and Data Analysis Division Community Outcome and Risk Evaluation Information System (CORE). Jul 2015.
  • 42.
    Problem Outcomes: Childor Family Health Infant Mortality (Under 1 Year) Rate Per 100,000 2002 2003 2004 2005 2006 2007 2008 2009 2010 2011 2012 2013 National 700.9 700.0 680.8 686.7 682.3 690.1 657.7 639.4 614.7 602.6 590.9 State 573.3 567.5 569.1 484.2 468.0 469.9 551.5 484.2 418.2 420.6 479.7 436.7 Counties Like Us 663.4 533.4 798.1 379.6 392.0 285.4 645.3 362.2 447.2 407.4 437.7 584.3 Mason County 382.4 192.3 1338.4 844.6 660.1 473.2 301.2 294.6 583.9 149.7 599.7 445.8 Deaths, infants 2 1 7 5 4 3 2 2 4 1 4 3 Infants < 1 year 523 520 523 592 606 634 664 679 685 668 667 673 Updated 9/8/2014 Go to Indicator Comparison Profile 0 200 400 600 800 1000 1200 1400 1600 Mason County State Counties Like Us National Note: The deaths, of infants under one year of age, per 100,000 population of infants under one year of age. Suppression code definitions for yearly rates are explained in Technical Notes. Rates are not reported when fewer than 100 deaths occurred in an area. State Source: Department of Health, Center for Health Statistics, Death Certificate Data File. Population Estimates: Washington State Office of Financial Management, Forecasting Division National Source: U.S. Department of Health and Human Services, Centers for Disease Control and Health Statistics National Center for Health Statistics, Division of Health Services, National Vital Statistics Reports 37 Washington State Department of Social and Health Services Research and Data Analysis Division Community Outcome and Risk Evaluation Information System (CORE). Jul 2015.
  • 43.
    Problem Outcomes: Childor Family Health Child Mortality (Ages 1-17) Rate Per 100,000 2002 2003 2004 2005 2006 2007 2008 2009 2010 2011 2012 2013 State 23.4 22.3 20.5 19.2 17.6 16.7 18.1 16.1 16.2 15.2 16.3 15.4 Counties Like Us 26.2 24.9 24.3 29.0 21.5 20.7 17.9 16.6 25.1 20.1 20.2 18.0 Mason County 45.7 27.6 36.9 53.0 17.5 25.7 42.4 25.6 17.1 26.0 34.7 17.4 Child Deaths 5 3 4 6 2 3 5 3 2 3 4 2 Children (age 1-17) 10,931 10,867 10,851 11,317 11,450 11,671 11,786 11,729 11,692 11,532 11,528 11,504 Updated 9/8/2014 Go to Indicator Comparison Profile 0 10 20 30 40 50 60 Mason County State Counties Like Us Note: The deaths, of children 1 to 17 years of age, per 100,000 population of children 1 to 17 years of age. Suppression code definitions for yearly rates are explained in Technical Notes. Rates are not reported when fewer than 100 deaths occurred in an area. State Source: Department of Health, Center for Health Statistics, Death Certificate Data File. Population Estimates: Washington State Office of Financial Management, Forecasting Division 38 Washington State Department of Social and Health Services Research and Data Analysis Division Community Outcome and Risk Evaluation Information System (CORE). Jul 2015.
  • 44.
    Problem Outcomes: Childor Family Health Births to School-Age (10-17) Mothers Rate Per 1,000 2002 2003 2004 2005 2006 2007 2008 2009 2010 2011 2012 2013 National 9.0 8.6 8.6 8.5 8.9 9.0 8.8 8.1 7.0 6.1 5.6 State 6.5 6.0 6.1 5.9 6.1 6.6 6.3 5.6 5.1 4.6 4.2 3.5 Counties Like Us 8.3 7.8 7.4 8.2 8.7 9.1 7.7 6.8 6.0 5.9 5.1 3.9 Mason County 11.3 8.8 8.1 10.9 9.8 10.8 9.1 10.0 5.8 9.3 11.5 4.1 Birthed, 10-17 32 25 23 31 28 31 26 28 16 25 31 11 Females, 10-17 2,842 2,838 2,832 2,842 2,846 2,865 2,850 2,795 2,770 2,702 2,703 2,671 Updated 11/12/2014 Go to Indicator Comparison Profile 0 2 4 6 8 10 12 14 Mason County National State Counties Like Us Note: The live births to adolescents (age 10-17) per 1,000 females (age 10-17). Rate changes in data result from on-going updates to birth records. Suppression code definitions for yearly rates are explained in Technical Notes. Due to contractual agreement data may not be displayed for areas with less than 100 births. State Source: Department of Health, Center for Health Statistics, Birth Certificate Data File. Population Estimates: Washington State Office of Financial Management, Forecasting Division National Source: U.S. Department of Health and Human Services, Centers for Disease Control and Health Statistics National Center for Health Statistics, Division of Health Services, National Vital Statistics Reports 39 Washington State Department of Social and Health Services Research and Data Analysis Division Community Outcome and Risk Evaluation Information System (CORE). Jul 2015.
  • 45.
    Problem Outcomes: Childor Family Health Sexually Transmitted Disease Cases (Birth-19) Rate Per 1,000 2003 2004 2005 2006 2007 2008 2009 2010 2011 2012 2013 2014 State 4.1 3.9 4.0 3.7 3.8 4.2 4.1 3.9 4.1 4.1 3.8 3.9 Counties Like Us 3.6 3.9 3.7 3.6 3.3 4.1 3.8 3.7 3.7 4.1 4.1 4.2 Mason County 3.8 3.0 4.2 3.8 3.2 4.1 3.7 3.5 4.3 4.1 4.0 5.4 Cases, birth-19 48 38 56 51 44 57 51 49 58 55 54 72 Persons, birth-19 12,695 12,697 13,279 13,441 13,733 13,917 13,894 13,836 13,661 13,521 13,436 13,416 Updated 5/11/2015 Go to Indicator Comparison Profile 0 1 2 3 4 5 6 Mason County State Counties Like Us Note: The reported cases of gonorrhea, syphilis, or chlamydia in children (age birth-19) per 1,000 adolescents (age birth-19). Suppression code definitions for yearly rates are explained in Technical Notes. Due to contractual agreement data may not be displayed for populations less than 100. State Source: Department of Health, Sexually Transmitted Disease (STD) Services, Sexually Transmitted Disease Reported Cases. Population Estimates: Washington State Office of Financial Management, Forecasting Division 40 Washington State Department of Social and Health Services Research and Data Analysis Division Community Outcome and Risk Evaluation Information System (CORE). Jul 2015.
  • 46.
    Problem Outcomes: Childor Family Health Suicide and Suicide Attempts (Age 10-17) Rate Per 100,000 2002 2003 2004 2005 2006 2007 2008 2009 2010 2011 2012 2013 State 50.4 42.7 56.3 51.3 48.2 38.6 47.8 44.1 44.3 40.7 52.0 55.3 Counties Like Us 66.5 42.5 64.0 53.8 43.8 48.5 26.9 41.1 37.0 44.5 43.6 45.7 Mason County 69.3 0.0 17.4 17.1 51.3 67.7 17.0 0.0 87.1 35.5 35.5 53.9 Suicide & Attempt 4 0 1 1 3 4 1 0 5 2 2 3 Persons, 10-17 5,776 5,770 5,758 5,837 5,854 5,905 5,881 5,782 5,742 5,639 5,634 5,571 Updated 9/8/2014 Go to Indicator Comparison Profile 0 10 20 30 40 50 60 70 80 90 100 Mason County State Counties Like Us Note: The adolescents (age 10-17) who committed suicide or were admitted to the hospital for suicide attempts, per 100,000 adolescents (age 10-17). Suicides are based on death certificate information. Suicide attempts are based on hospital admissions, but do not include admissions to federal hospitals. Suppression code definitions for yearly rates are explained in Technical Notes. Due to contractual agreement data may not be displayed for locations with adolescent populations less than 100. State Source: Department of Health, Office of Hospital and Patient Data Systems, Comprehensive Hospital Abstract Reporting System (CHARS) and Department of Health, Center for Health Statistics Death Certificate Data. Population Estimates: Washington State Office of Financial Management, Forecasting Division 41 Washington State Department of Social and Health Services Research and Data Analysis Division Community Outcome and Risk Evaluation Information System (CORE). Jul 2015.
  • 47.
    Problem Outcomes: Childor Family Health Low Birthweight Babies Rate Per 1,000 2002 2003 2004 2005 2006 2007 2008 2009 2010 2011 2012 2013 National 78.0 79.0 81.0 82.0 83.0 82.0 82.0 81.6 81.5 81.0 79.9 80.0 State 57.3 60.4 62.0 61.0 65.2 63.3 63.4 62.5 63.2 61.5 61.2 64.2 Counties Like Us 52.5 52.5 59.8 55.1 58.9 54.1 58.5 59.3 60.2 57.6 54.1 63.9 Mason County 71.0 61.8 69.3 61.2 57.0 48.0 71.1 56.7 72.0 64.7 44.6 69.1 Low-weight Babies 39 35 39 38 36 31 45 40 45 40 31 41 All Births 549 566 563 621 632 646 633 706 625 618 695 593 Updated 11/12/2014 Go to Indicator Comparison Profile 0 10 20 30 40 50 60 70 80 90 Mason County National State Counties Like Us Note: The babies born with low birthweight, per 1,000 live births. Low birthweight is less than 2,500 grams. Rate changes in data may result from on-going updates to birth records. No rate is given when the number of live births is less than 100 in the geographic area. Suppression code definitions for yearly rates are explained in Technical Notes. State Source: Department of Health, Center for Health Statistics, Birth Certificate Data File National Source: U.S. Department of Health and Human Services, Centers for Disease Control and Health Statistics National Center for Health Statistics, Division of Health Services, WONDER Data System 42 Washington State Department of Social and Health Services Research and Data Analysis Division Community Outcome and Risk Evaluation Information System (CORE). Jul 2015.
  • 48.
    Problem Outcomes: Childor Family Health Injury or Accident Hospitalizations for Women Percent 2002 2003 2004 2005 2006 2007 2008 2009 2010 2011 2012 2013 State 11.9 12.2 13.2 13.3 13.5 13.4 14.3 15.1 15.4 16.1 16.7 16.8 Counties Like Us 13.2 13.7 14.8 15.5 15.7 15.8 16.2 16.8 16.5 16.7 17.0 17.4 Mason County 16.0 15.0 17.6 17.9 16.3 16.0 17.5 19.1 17.0 19.4 17.7 17.7 Injuries 454 435 508 519 461 451 518 578 535 623 560 559 Hospitalizations 2,836 2,896 2,881 2,894 2,823 2,819 2,963 3,030 3,157 3,215 3,159 3,158 Updated 8/25/2014 Go to Indicator Comparison Profile 0 5 10 15 20 25 Mason County State Counties Like Us Note: The injury or accident hospitalizations for women as a percent of all hospitalizations for women (age 18+). Suppression code definitions for yearly rates are explained in Technical Notes. Due to contractual agreement data may not be displayed for areas with less than 100 hospitalizations. State Source: Department of Health, Office of Hospital and Patient Data Systems, Comprehensive Hospital Abstract Reporting System (CHARS) . 43 Washington State Department of Social and Health Services Research and Data Analysis Division Community Outcome and Risk Evaluation Information System (CORE). Jul 2015.
  • 49.
    Problem Outcomes: CriminalJustice Offenses, Domestic Violence Rate Per 1,000 2002 2003 2004 2005 2006 2007 2008 2009 2010 2011 2012 2013 State 6.5 6.5 6.5 6.4 6.0 5.8 5.3 5.7 5.7 5.6 5.9 5.8 Counties Like Us 7.5 6.9 7.2 6.7 6.3 5.8 5.9 5.8 6.2 6.3 7.2 7.0 Mason County 6.4 6.3 7.5 5.8 5.9 5.2 5.5 4.6 4.8 5.2 5.3 4.9 Offenses 315 314 376 311 326 295 325 272 286 311 320 296 Persons 49,102 49,506 50,109 53,860 55,368 57,245 58,750 59,497 59,680 60,098 60,442 60,784 Updated 10/7/2014 Go to Indicator Comparison Profile 0 1 2 3 4 5 6 7 8 Mason County State Counties Like Us Note: The domestic violence-related offenses, per 1,000 persons. Domestic violence includes any violence of one family member against another family member. Family can include spouses, former spouses, parents who have children in common regardless of marital status, adults who live in the same household, as well as parents and their children. Offenses differ from arrests. While funding and grants are associated with participation, reporting is not mandatory. Offenses are incidence reporting. When more than one victim is involved an offence is filed for each victim. Multiple property violations performed at the same incident are counted as one offence. However when both types of events happen, only the victim incidents are reported as offenses. Offenses focus on the nature of the crime, while arrests focus on the apprehended accused perpetrator. Many offenses occur without arresting perpetrators. Denominators are adjusted by subtracting the population of police agencies that did not report offenses. In spite of this population adjustment, when the non-reporting police jurisdiction is where much of the crime occurs, the rate for the county will be lower than it would be if that jurisdiction was included. For percent subtracted and the agencies not reporting, see the appendix on Non-Reporting Agencies and Population. Suppression code definitions for yearly rates are explained in Technical Notes. The crimes types used within this rate are represented in both Summary UCR and NIBRS systems and are not likely to be substantially impacted by the system change. State Source: Washington Association of Sheriffs and Police Chiefs (WASPC): Uniform Crime Report (UCR), National Incident-Based Reporting System (NIBRS) Population Estimates: Washington State Office of Financial Management, Forecasting Division 44 Washington State Department of Social and Health Services Research and Data Analysis Division Community Outcome and Risk Evaluation Information System (CORE). Jul 2015.
  • 50.
    Problem Outcomes: CriminalJustice Total Arrests of Adolescents (Age 10-17) Rate Per 1,000 2002 2003 2004 2005 2006 2007 2008 2009 2010 2011 2012 2013 National 76.2 65.7 65.5 63.2 66.1 65.5 64.4 59.2 49.0 43.8 39.4 33.7 State 54.7 54.3 51.8 48.1 48.4 49.0 45.5 41.4 39.4 37.2 26.8 27.7 Counties Like Us 70.4 71.7 67.2 58.5 57.2 61.1 58.0 49.6 46.9 48.9 28.5 34.8 Mason County 50.5 52.2 60.8 66.5 59.6 68.0 52.9 40.4 39.1 39.7 15.9 15.5 Arrests, 10-17 286 291 344 381 342 394 305 229 218 173 87 84 Adjusted Pop 10-17 5,669 5,578 5,654 5,727 5,743 5,793 5,771 5,673 5,579 4,362 5,475 5,413 Updated 10/7/2014 Go to Indicator Comparison Profile 0 10 20 30 40 50 60 70 80 Mason County National State Counties Like Us Note: The arrests of adolescents (age 10-17) for any crime, per 1,000 adolescents (age 10-17). Washington State has transitioned from Summary UCR to the NIBRS system for reporting. Summary UCR collects eight (8) Part One Crime offenses: criminal homicide, forcible rape, robbery, aggravated assault, burglary, larceny, motor vehicle theft and arson. NIBRS collects information on twenty-three (23) different offenses, including all Part One Crimes plus others including forcible and non-forcible sex offenses, fraud, kidnapping, and drug violations. Care must be taken when interpreting the yearly trend of "total arrest" rates for an area. In areas where large amounts of arrests are likely for crimes not previously reported, a substantial increase in total arrests could be expected starting with the 2012 data. Denominators are adjusted by subtracting the population of police agencies that did not report arrests to WASPC. For more information, see the Technical Notes and the appendix on Non-Reporting Agencies and Population. State Source: Washington Association of Sheriffs and Police Chiefs (WASPC): Uniform Crime Report (UCR), National Incident-Based Reporting System (NIBRS) Population Estimates: Washington State Office of Financial Management, Forecasting Division National Source: US Department of Justice, Bureau of Justice Statistics Sourcebook of Criminal Justice Statistics Online Summary UCR NIBRS 45 Washington State Department of Social and Health Services Research and Data Analysis Division Community Outcome and Risk Evaluation Information System (CORE). Jul 2015.
  • 51.
    Problem Outcomes: CriminalJustice Arrests (Age 10-14), Property Crime Rate Per 1,000 2002 2003 2004 2005 2006 2007 2008 2009 2010 2011 2012 2013 National 9.3 7.8 7.6 6.7 6.4 6.3 6.3 5.8 5.0 4.5 4.1 3.4 State 12.0 11.8 11.0 9.4 8.6 8.6 7.5 6.7 5.9 5.8 4.0 3.6 Counties Like Us 15.5 14.9 13.7 10.7 10.5 10.0 9.8 8.8 6.9 7.3 4.4 4.0 Mason County 12.3 10.2 17.9 13.7 9.5 11.2 7.8 4.9 2.9 7.0 2.9 0.3 Arrests, 10-14 43 35 62 48 33 39 27 17 10 19 10 1 Adjusted Pop 10-14 3,486 3,430 3,468 3,506 3,479 3,482 3,476 3,445 3,403 2,726 3,421 3,398 Updated 10/7/2014 Go to Indicator Comparison Profile 0 2 4 6 8 10 12 14 16 18 20 Mason County National State Counties Like Us Note: The arrests of younger adolescents (age 10-14) for property crimes, per 1,000 adolescents (age 10-14). Property crimes include all crimes involving burglary, larceny-theft, motor vehicle theft, and arson. Denominators are adjusted by subtracting the population of police agencies that did not report arrests to UCR/NIBRS. In spite of this population adjustment, when the non-reporting police jurisdiction is where much of the crime occurs, the rate for the area will be lower than it would be if that jurisdiction was included. For percent subtracted, suppression code definitions and the agencies not reporting, see the Technical Notes and the appendix on Non-Reporting Agencies and Population. The crimes types used within this rate are represented in both Summary UCR and NIBRS systems and are not likely to be substantially impacted by the system change. State Source: Washington Association of Sheriffs and Police Chiefs (WASPC): Uniform Crime Report (UCR), National Incident-Based Reporting System (NIBRS) Population Estimates: Washington State Office of Financial Management, Forecasting Division National Source: US Department of Justice, Bureau of Justice Statistics Sourcebook of Criminal Justice Statistics Online 46 Washington State Department of Social and Health Services Research and Data Analysis Division Community Outcome and Risk Evaluation Information System (CORE). Jul 2015.
  • 52.
    Problem Outcomes: CriminalJustice Arrests (Age 10-17), Property Crime Rate Per 1,000 2002 2003 2004 2005 2006 2007 2008 2009 2010 2011 2012 2013 National 16.3 13.8 13.5 12.4 12.1 12.7 13.5 13.1 11.1 10.1 8.9 7.7 State 19.7 19.1 18.1 16.6 15.7 16.3 15.4 13.8 12.4 12.3 8.9 8.3 Counties Like Us 21.8 21.2 21.9 18.2 16.5 18.3 18.2 15.8 15.4 15.8 8.7 9.3 Mason County 19.2 16.1 20.7 18.2 10.6 18.5 13.0 9.9 8.1 11.7 4.6 2.0 Arrests, 10-17 109 90 117 104 61 107 75 56 45 51 25 11 Adjusted Pop 10-17 5,669 5,578 5,654 5,727 5,743 5,793 5,771 5,673 5,579 4,362 5,475 5,413 Updated 10/7/2014 Go to Indicator Comparison Profile 0 5 10 15 20 25 Mason County National State Counties Like Us Note: The arrests of adolescents (age 10-17) for property crimes, per 1,000 adolescents (age 10-17). Property crimes include all crimes involving burglary, larceny-theft, motor vehicle theft, and arson. Denominators are adjusted by subtracting the population of police agencies that did not report arrests to UCR/NIBRS. In spite of this population adjustment, when the non-reporting police jurisdiction is where much of the crime occurs, the rate for the county will be lower than it would be if that jurisdiction was included. For percent subtracted, suppression code definitions and the agencies not reporting, see the Technical Notes and the appendix on Non-Reporting Agencies and Population. The crimes types used within this rate are represented in both Summary UCR and NIBRS systems and are not likely to be substantially impacted by the system change. State Source: Washington Association of Sheriffs and Police Chiefs (WASPC): Uniform Crime Report (UCR), National Incident-Based Reporting System (NIBRS) Population Estimates: Washington State Office of Financial Management, Forecasting Division National Source: US Department of Justice, Bureau of Justice Statistics Sourcebook of Criminal Justice Statistics Online 47 Washington State Department of Social and Health Services Research and Data Analysis Division Community Outcome and Risk Evaluation Information System (CORE). Jul 2015.
  • 53.
    Problem Outcomes: CriminalJustice Arrests (Age 18+), Property Crime Rate Per 1,000 2002 2003 2004 2005 2006 2007 2008 2009 2010 2011 2012 2013 National 6.0 5.3 5.5 5.4 5.1 5.3 5.5 5.7 5.5 5.5 5.7 5.6 State 6.2 6.5 6.8 6.7 6.1 6.1 5.6 6.2 6.2 6.7 6.1 6.8 Counties Like Us 7.8 8.4 9.6 8.7 7.2 7.2 7.0 7.2 7.9 8.1 5.9 8.9 Mason County 6.9 6.7 7.0 7.3 6.1 6.7 4.5 4.6 4.9 5.4 4.2 4.3 Arrests, 18+ 260 254 274 306 265 302 210 217 231 203 205 212 Adjusted Pop 18+ 37,879 37,823 38,958 42,160 43,518 45,153 46,515 47,294 47,609 37,965 48,546 48,906 Updated 10/7/2014 Go to Indicator Comparison Profile 0 2 4 6 8 10 12 Mason County National State Counties Like Us Note: The arrests of adults (age 18+) for property crimes, per 1,000 adults (age 18+). Property crimes include all crimes involving burglary, larceny-theft, motor vehicle theft, and arson. Denominators are adjusted by subtracting the population of police agencies that did not report arrests to UCR/NIBRS. In spite of this population adjustment, when the non-reporting police jurisdiction is where much of the crime occurs, the rate for the county will be lower than it would be if that jurisdiction was included. For percent subtracted, suppression code definitions and the agencies not reporting, see the Technical Notes and the appendix on Non-Reporting Agencies and Population. The crimes types used within this rate are represented in both Summary UCR and NIBRS systems and are not likely to be substantially impacted by the system change. State Source: Washington Association of Sheriffs and Police Chiefs (WASPC): Uniform Crime Report (UCR), National Incident-Based Reporting System (NIBRS) Population Estimates: Washington State Office of Financial Management, Forecasting Division National Source: US Department of Justice, Bureau of Justice Statistics Sourcebook of Criminal Justice Statistics Online 48 Washington State Department of Social and Health Services Research and Data Analysis Division Community Outcome and Risk Evaluation Information System (CORE). Jul 2015.
  • 54.
    Problem Outcomes: CriminalJustice Arrests (Age 10-17), Violent Crime Rate Per 1,000 2002 2003 2004 2005 2006 2007 2008 2009 2010 2011 2012 2013 National 3.1 2.7 2.7 2.8 3.0 2.9 2.9 2.7 2.3 2.0 1.8 1.7 State 2.3 2.3 2.2 2.2 2.3 2.5 2.3 2.3 2.1 1.8 1.5 1.7 Counties Like Us 2.7 2.7 2.4 2.1 2.2 2.4 1.9 2.1 1.8 2.1 0.8 1.4 Mason County 2.7 2.9 2.3 3.0 5.1 2.9 3.5 2.5 2.0 3.0 1.3 1.3 Arrests, 10-17 15 16 13 17 29 17 20 14 11 13 7 7 Adjusted Pop 10-17 5,669 5,578 5,654 5,727 5,743 5,793 5,771 5,673 5,579 4,362 5,475 5,413 Updated 10/7/2014 Go to Indicator Comparison Profile 0 1 2 3 4 5 6 Mason County National State Counties Like Us Note: The arrests of adolescents (age 10-17) for violent crime per 1,000 adolescents (age 10-17). Violent crimes include all crimes involving criminal homicide, forcible rape, robbery, and aggravated assault. Simple assault is not defined as a violent crime. Denominators are adjusted by subtracting the population of police agencies that did not report arrests to UCR/NIBRS. In spite of this population adjustment, when the non-reporting police jurisdiction is where much of the crime occurs, the rate for the county will be lower than it would be if that jurisdiction was included. For percent subtracted, suppression code definitions and the agencies not reporting, see the Technical Notes and the appendix on Non-Reporting Agencies and Population. The crimes types used within this rate are represented in both Summary UCR and NIBRS systems and are not likely to be substantially impacted by the system change. State Source: Washington Association of Sheriffs and Police Chiefs (WASPC): Uniform Crime Report (UCR), National Incident-Based Reporting System (NIBRS) Population Estimates: Washington State Office of Financial Management, Forecasting Division National Source: US Department of Justice, Bureau of Justice Statistics Sourcebook of Criminal Justice Statistics Online 49 Washington State Department of Social and Health Services Research and Data Analysis Division Community Outcome and Risk Evaluation Information System (CORE). Jul 2015.
  • 55.
    Problem Outcomes: SubstanceUse Alcohol-Related Traffic Fatalities Per All Traffic Fatalities Percent 2002 2003 2004 2005 2006 2007 2008 2009 2010 2011 2012 2013 National 36.7 36.0 35.7 36.7 37.4 37.7 37.0 37.6 36.2 35.4 State 39.8 36.8 37.7 41.8 39.7 40.8 43.6 49.0 41.1 39.7 36.1 36.0 Counties Like Us 48.1 35.9 35.4 45.5 35.9 49.5 42.2 41.8 27.1 44.3 39.1 40.0 Mason County 70.0 50.0 33.3 42.9 40.0 75.0 44.4 40.0 16.7 40.0 60.0 16.7 Alcohol-related 7 6 4 6 6 6 4 2 1 4 3 2 Fatalities 10 12 12 14 15 8 9 5 6 10 5 12 Updated 1/5/2015 Go to Indicator Comparison Profile 0 10 20 30 40 50 60 70 80 Mason County National State Counties Like Us Note: The alcohol-related traffic fatalities, per 100 traffic fatalities. "Alcohol-related" means that the officer on the scene determined that at least one driver involved in the accident "had been drinking." Thus, "Alcohol-related" includes but is not limited to the legal definition of driving under the influence. Care should be taken since small numbers of events can cause unreliable rates in some counties. State Source: Washington State Patrol, Records Section, Traffic Collisions in Washington State, Accident Records Database National Source: National Center for Statistics and Analysis, Fatal Accident Reporting System (FARS) 50 Washington State Department of Social and Health Services Research and Data Analysis Division Community Outcome and Risk Evaluation Information System (CORE). Jul 2015.
  • 56.
    Problem Outcomes: SubstanceUse Arrests (Age 10-17), Alcohol Violation Rate Per 1,000 2002 2003 2004 2005 2006 2007 2008 2009 2010 2011 2012 2013 National 6.4 5.3 4.9 4.7 5.3 5.3 5.0 4.3 3.7 3.4 2.3 2.3 State 7.8 7.8 7.4 6.5 7.4 7.7 6.7 5.8 4.8 3.9 2.7 2.4 Counties Like Us 14.5 15.5 12.6 10.2 10.4 12.5 12.1 8.7 6.8 5.9 4.0 3.7 Mason County 4.2 5.9 4.6 6.6 8.0 10.5 6.9 4.9 4.7 3.2 0.7 0.6 Arrests, 10-17 24 33 26 38 46 61 40 28 26 14 4 3 Adjusted Pop 10-17 5,669 5,578 5,654 5,727 5,743 5,793 5,771 5,673 5,579 4,362 5,475 5,413 Updated 10/7/2014 Go to Indicator Comparison Profile 0 2 4 6 8 10 12 14 16 18 Mason County National State Counties Like Us Note: The arrests of adolescents (age 10-17) for alcohol violations, per 1,000 adolescents (age 10-17). Alcohol violations include all crimes involving driving under the influence, liquor law violations, and drunkenness. For children, arrests for liquor law violations are usually arrests for minor in possession. 1) Denominators are adjusted by subtracting the population of police agencies that did not report arrests to UCR/NIBRS. In spite of this population adjustment, when the non-reporting police jurisdiction is where much of the crime occurs, the rate for the county will be lower than it would be if that jurisdiction was included. For percent subtracted, suppression code definitions and the agencies not reporting, see the Technical Notes and the appendix on Non-Reporting Agencies and Population. 2) The DUI portion of this measure is likely understated, because arrests made by the State Patrol are not attributable to counties. State Patrol arrests are included in the state rates. The crimes types used within this rate are represented in both Summary UCR and NIBRS systems and are not likely to be substantially impacted by the system change. State Source: Washington Association of Sheriffs and Police Chiefs (WASPC): Uniform Crime Report (UCR), National Incident-Based Reporting System (NIBRS) Population Estimates: Washington State Office of Financial Management, Forecasting Division National Source: US Department of Justice, Bureau of Justice Statistics Sourcebook of Criminal Justice Statistics Online 51 Washington State Department of Social and Health Services Research and Data Analysis Division Community Outcome and Risk Evaluation Information System (CORE). Jul 2015.
  • 57.
    Problem Outcomes: SubstanceUse Arrests (Age 10-17), Drug Law Violation Rate Per 1,000 2002 2003 2004 2005 2006 2007 2008 2009 2010 2011 2012 2013 National 6.3 5.8 5.8 5.7 5.9 5.9 5.5 5.3 5.1 4.4 4.2 3.7 State 4.9 4.9 4.2 4.3 4.5 4.6 4.3 4.3 4.8 5.2 3.3 3.2 Counties Like Us 4.1 4.7 4.5 4.6 4.9 4.6 4.0 4.2 5.0 7.0 4.1 4.6 Mason County 2.3 2.5 3.7 3.5 3.8 4.1 4.2 3.2 3.9 8.9 3.5 1.9 Arrests, 10-17 13 14 21 20 22 24 24 18 22 39 19 10 Adjusted Pop 10-17 5,669 5,578 5,654 5,727 5,743 5,793 5,771 5,673 5,579 4,362 5,475 5,413 Updated 10/7/2014 Go to Indicator Comparison Profile 0 1 2 3 4 5 6 7 8 9 10 Mason County National State Counties Like Us Note: The arrests of adolescents (age 10-17) for drug law violations, per 1,000 adolescents (age 10-17). Drug law violations include all crimes involving sale, manufacturing, and possession of drugs. Denominators are adjusted by subtracting the population of police agencies that did not report arrests to UCR/NIBRS. In spite of this population adjustment, when the non-reporting police jurisdiction is where much of the crime occurs, the rate for the county will be lower than it would be if that jurisdiction was included. For percent subtracted, suppression code definitions and the agencies not reporting, see the Technical Notes and the appendix on Non-Reporting Agencies and Population. The crimes types used within this rate are represented in both Summary UCR and NIBRS systems and are not likely to be substantially impacted by the system change. State Source: Washington Association of Sheriffs and Police Chiefs (WASPC): Uniform Crime Report (UCR), National Incident-Based Reporting System (NIBRS) Population Estimates: Washington State Office of Financial Management, Forecasting Division National Source: US Department of Justice, Bureau of Justice Statistics Sourcebook of Criminal Justice Statistics Online 52 Washington State Department of Social and Health Services Research and Data Analysis Division Community Outcome and Risk Evaluation Information System (CORE). Jul 2015.
  • 58.
    Problem Outcomes: SubstanceUse Clients of State-Funded Alcohol or Drug Services (Age 10-17) Rate Per 1,000 2002 2003 2004 2005 2006 2007 2008 2009 2010 2011 2012 2013 National 4.8 4.8 4.8 4.4 4.3 4.2 4.7 4.6 4.2 3.7 State 11.4 11.2 11.1 10.6 10.2 10.6 11.3 11.0 11.1 11.5 11.4 11.1 Counties Like Us 16.4 16.5 15.6 16.2 16.7 16.7 17.7 16.8 16.2 19.0 19.3 19.1 Mason County 14.0 17.0 20.8 18.9 21.5 23.0 24.3 19.7 12.5 15.3 21.1 18.1 Admits, 10-17 81 98 120 110 126 136 143 114 72 86 119 101 Persons, 10-17 5,776 5,770 5,758 5,837 5,854 5,905 5,881 5,782 5,742 5,639 5,634 5,571 Updated 11/6/2014 Go to Indicator Comparison Profile 0 5 10 15 20 25 30 Mason County National State Counties Like Us Note: The adolescents (age 10-17) receiving state-funded alcohol or drug services, per 1,000 adolescents 10-17. Counts of clients are unduplicated so that those receiving services more than once during the year are only counted once for that year. State-funded services include treatment, assessment, and detox. Persons in Department of Corrections treatment programs are not included. State Source: Department of Social and Health Services, Division of Behavioral Health and Recovery, Treatment and Assessment Report Generation Tool (TARGET). Population Estimates: Washington State Office of Financial Management, Forecasting Division National Source: Office of Applied Studies, Substance Abuse and Mental Health Services Administration, Treatment Episode Data Set (TEDS) 53 Washington State Department of Social and Health Services Research and Data Analysis Division Community Outcome and Risk Evaluation Information System (CORE). Jul 2015.
  • 59.
    Technical Notes Topics: Population DenominatorsUsed in This Report Rates – Why is Raw Data Converted to Rates? Counting Alcohol- or Drug-related Deaths Standardization of CORE Indicators Counties Like Us Graduation and Dropout Data Methodology Changes Duplicated and Unduplicated Counts Where are the roadblocks to learning? Transition Summary UCR to National Incident-Based Reporting System (NIBRS) Suppression Codes Uniform Crime Report - Non-Reporting Police Jurisdictions CORE Conversion Process and Weighted Reliability Index Population Denominators Used in This Report Counting Alcohol- or Drug-related Deaths The tables on the following pages characterize the different diseases, injuries, and accidents by: name, ICD-9 or ICD-10 code, percent attributable to alcohol or drugs, age of inclusion. Information sources are listed below. Other contributory causes of death are related only sometimes to alcohol or drugs. For example, epidemiological studies have shown that, among persons over 35 years of age, 60% of deaths due to chronic pancreatitis (ICD-9 code 577.1) and 75% of malignant neoplasms of the esophagus (ICD-9 code 150) are alcohol-related. For persons of all ages, 42% of motor vehicle traffic and nontraffic deaths (ICD-9 codes E810 through E825) are alcohol-related. The appropriate percentage of such indirectly attributable deaths are also counted toward totals for AOD-related deaths. The identified AOD-related causes of death may be either fully attributable or sometimes attributable to alcohol or drugs. Some contributory causes of death are explicit in their mention of alcohol or drugs. Examples include alcoholic cirrhosis of the liver (ICD-9 code 571.2), alcohol and drug dependence syndromes (ICD-9 codes 303 and 304, respectively), and drug poisonings (ICD-9 codes E850 through E859). All deaths of this sort are fully, or 100%, attributable to alcohol or drug abuse and are considered direct AOD-related deaths. AOD deaths are identified by matching all the contributory causes of death from death certificate records to a list of causes that are considered AOD-related. The deaths identified as AOD-related then may be summed to provide area totals. Dividing the total AOD- related deaths by all deaths in an area gives the percent of all deaths that are alcohol and drug related. Lists of underlying causes of death that are AOD-related have been developed in several studies. Citations for these studies are listed prior to the AOD attribution tables. AOD-related deaths used in this report are determined using a comprehensive assembly of disease, accident, and injury codes identified in those studies. The codes are based upon the International Classification of Diseases, Ninth Revision (ICD-9) from 1990 to 1998 or International Classification of Diseases, Tenth Revision (ICD-10) after 1998. Population is updated as the data becomes available. If events for the numerator are available, but the population is not yet available the population for the year previous is used for calculating rates. Those data years are marked with an asterisk, like this: 2011*. The asterisk is removed when the population, and the rate are updated. 2. Rice D, et al. 1990. The Economic Costs of Alcohol and Drug Abuse and Mental Illness: 1985. Report submitted to the Office of Financing and Coverage Policy of the Alcohol, Drug Abuse, and mental health Administration, U.S. Department of Health and Human Services. San Francisco, CA: Institute for Health and Aging, University of California. 1. Schultz J, Rice D, & Parker D. 1990. Alcohol-related mortality and years of potential life lost - United States, 1987. Morbidity and Mortality Weekly Report, 39, 173-178. 3. Fox K, Merrill J, Chang H, & Califano J. 1995. Estimating the Costs of Substance Abuse to the Medicaid Hospital Care Program. American Journal of Public Health, 85(1), 48-54. 4. Seattle-King County HIV/AIDS Epidemiology Unit and Washington State Office of HIV/AIDS Epidemiology and Evaluation. 1994. Washington State/Seattle-King County HIV/AIDS Epidemiology Report (2nd Quarter, 1994), p. 4. 54 Washington State Department of Social and Health Services Research and Data Analysis Division Community Outcome and Risk Evaluation Information System (CORE). Jul 2015.
  • 60.
    Technical Notes Disease CategoryICD-10 Code ICD-9 Code Attrib Age Diseases Directly Attributable to Alcohol Alcoholic psychoses F10, F10.3-F10.9 291 100% >=15 Alcohol dependence syndrome F10.2 303 100% >=15 Alcoholic polyneuropathy G62.1 357.5 100% >=15 Alcoholic cardiomyopathy I42.6 425.5 100% >=15 Alcoholic gastritis K29.2 535.3 100% >=15 Alcoholic fatty liver K70.0 571.0 100% >=15 Acute alcoholic hepatitis K70.1, K70.4 571.1 100% >=15 Alcoholic cirrhosis of the liver K70.3 571.2 100% >=15 Alcoholic liver damage, other K70.2, K70.9, K70 571.3 100% >=15 Excessive blood level of alcohol, toxic effect of alcohol R78.0, T51 790.3. 980 100% >=0 Accidental poisoning by alcohol X45, Y15 E860 100% >=0 Nondependent abuse of Alcohol F10.1 305.0 100% >=0 Alcohol-induced pseudo-Cushing's sE24.4 Not Available in ICD-9 100% >=15 Degeneration of nervous system dueG31.2 Not Available in ICD-9 100% >=15 Alcoholic myopathy G72.1 Not Available in ICD-9 100% >=15 Maternal care for (suspected) damagO35.4 Not Available in ICD-9 100% >=15 Newborn affected by maternal use oP04.3 Not Available in ICD-9 100% >=0 Fetal alcohol syndrome (dysmorphicQ86.0 Not Available in ICD-9 100% >=0 Suicide attributable to alcohol X65 Not Available in ICD-9 100% >=0 Alcoholic Pellagra E52 265.2 100% >=0 Diseases Indirectly Attributable to Alcohol Neoplasms Breast C50, D05 174.0-174.9, 233.0 13% F >=35 Esophagus C15, D00.1 150.1-150.9, 230.1 75% >=35 Larynx C32 , D02.0 161.0-.161.9, 231.0 50% M, 40% F >=35 Lip, oral cavity, pharynx C00-C14, D00.0 140.1-141.9, 143.0-149.9, 230.0 50% M, 40% F >=35 Liver C22, D01.5 155.0-155.2, 230.8 29% >=35 Cardiovascular Cardiomyopathy I42.0 - I42.2, I42.5, I42.7- I42.9 425.1, 425.4, 425.9 40%M >=35 Hypertension I10-113, O10-O14, O16 401.0-404.9, 642.0, 642.2, 642.9 11% >=35 Digestive System Cirrhosis K71.7, K74.5-K74.6 571.5 74% >=35 Duodenal Ulcers K26 532.0-532.9 10% >=35 Pancreatitis, acute K85 577.0 47% >=35 Pancreatitis, chronic K86.1- K86.3, K86.9 577.1, 577.2, 577.9 72% >=35 Other Diseases or Conditions Epilepsy G40.3,G40.4,G40.6,G40.9 345.1, 345.3, 345.9 30% >=15 Seizures R56 780.3 41% >=15 Tuberculosis A16-A19 011-013, 017, 018 25% >=15 Accident or Injury Causes : Motor vehicle traffic and non-traffic accidents V02–V04, V09.0, V09.2, V12–V14, V19.0–V19.2, V19.4–V19.6, V20–V79, V80.3– V80.5, V81.0–V81.1, V82.0–V82.1, V83–V86, V87.0–V87.8, V88.0–V88.8, V89.0, V89.2 E810-E825 42% >=0 55 Washington State Department of Social and Health Services Research and Data Analysis Division Community Outcome and Risk Evaluation Information System (CORE). Jul 2015.
  • 61.
    Technical Notes Disease CategoryICD-10 Code ICD-9 Code Attrib Age Pedal cycle and other road vehicle accidents V01, V05–V06, V09.1, V09.3–V09.9, V10–V11, V15–V18, V19.3, V19.8–V19.9, V80.0–V80.2, V80.6–V80.9, V82.2–V82.9, V87.9, V88.9, V89.1, V89.3, V89.9 E826-E829 20% >=0 Water transport accidents V90-V94 E830-E838 20% >=0 Air & space transport accidents V95-V97 E840-E845 16% >=0 Accidental falls W00-W19 E880-E888 35% >=15 Accidents caused by fire X00-X09 E890-E899 45% >=0 Accidental drowning and submersion W65-W74 E910 38% >=0 Homicide & other purposely inflicted injury X86–Y09, Y87.1 E960-E962, E962.1-E969 46% >=15 Other X31, W79, W50-W52, W20- W34, Y15-Y19 E901, E911, E917-E920, E922 25% >=15 Diseases Directly Attributable to Drugs Drug psychoses F11-F16, F18-F19 292 100% >=0 Drug dependence syndrome F11-F16, F18-F19 304 100% >=0 Polyneuropathy due to drugs G62.0 357.6 100% >=15 Drug dependence during F11-F16, F18-F19 648.3 100% >=0 Suspected damage to fetus from drugs O35.5, 655.5 100% >=0 Noxious influences affecting fetus P04.4 760.7 100% >=0 Drug reactions, intox., withdrawal specific to newborn P96.1 779.4, 779.5 100% >=0 Selected drug poisonings R78,R78.1-R78.6, T38 ; excludes Y40-59.9 (therapeutic use) 962, 965, 967-971, 977 excludes E930-949 100% >=0 Selected accidental drug poisonings X40-X44 E850-E858 100% >=0 Accidental Poisonings (magic mushrooms, huffing and other drug use) X46-X49 E861-E869 100% >=0 Nondependent abuse of drugs F11-F16, F18-F19 305.2-305.9 100% >=0 Assault by poisoning using drugs and medicaments x85 E962.0 100% >=0 Drug induced myopathy G72.0 Not Available in ICD-9 100% Poisoning by drugs, accidentally or purposely inflicted Y10-Y14 E980.0-E980.5 100% >=0 Suicides attributable to drugs x60-64 E950.0-E950.5 100% >=0 Diseases Indirectly Attributable to Drugs AIDS (from IV drug use exposure) B20-B24 042.0-044.9 5% >=15 Cardiovascular Endocarditis I33.0, I33.9 421.0, 421.9 75% >=15 Other Hepatitis A B15.9 70.1 12% >=15 Hepatitis B B16-B16.9 70.2, 70.3 36% >=15 Hepatitis C B17-B19.9 70.5, 70.9 10% >=15 Suicides due to alcohol or drugs are now considered direct AOD-related deaths, other suicides are not apportioned. This brings our definitions into compliance with NCHS definitions. Other category includes: Excessive cold, Choking on food in airway; Striking against or struck accidentally by objects or persons; Caught accidentally in or between objects; Accidents caused by machinery; Accidents caused by cutting and piercing instruments. 56 Washington State Department of Social and Health Services Research and Data Analysis Division Community Outcome and Risk Evaluation Information System (CORE). Jul 2015.
  • 62.
    Technical Notes Counties LikeUs The groupings for “Counties Like Us” are as follows: Urban A* – King County Urban B* – Pierce, Snohomish, and Spokane Urban C – Benton, Clark, Kitsap, Thurston, Whatcom, and Yakima Rural A – Ferry, Franklin, Grant, Klickitat, Okanogan, Pend Oreille, and Skamania Rural B – Adams, Asotin, Chelan, Columbia, Douglas, Garfield, Kittitas, Lincoln, Stevens, Walla, and Whitman Rural C – Clallam, Cowlitz, Grays Harbor, Island, Jefferson, Lewis, Mason, Pacific, San Juan, Skagit, Wahkiakum Duplicated and Unduplicated Counts Transitioning from Uniform Crime Reporting (UCR) to National Incident-Based Reporting System (NIBRS) Over 80 years ago, standards were established for the Uniform Crime Reporting (UCR) Program so agencies could report their crime and arrest information in the same format and at the same level of detail and accuracy. Under the traditional UCR system agencies report monthly of the eight (8) "Part One" offenses and values of property stolen, as well as counts of arrests. The FBI Crime Index reports only designated Part One Crimes. These are criminal homicide, forcible rape, robbery, aggravated assault, burglary, larceny, motor vehicle theft and arson. This is now referred to as Summary UCR. Most law enforcement agencies report arrest and offense data to the Washington Association of Sheriffs and Police Chiefs (WASPC), which in turn provides data to the FBI’s Uniform Crime Reporting Program (UCR). In 1989, the FBI instituted a new crime-reporting system called the National Incident-Based Reporting System (NIBRS) to provide a more detailed and comprehensive view of crime in the United States. While Summary UCR collects only counts on eight (8) offense types, NIBRS collects information on twenty-three (23) different offenses. Some of the additional offenses in NIBRS are forcible and non-forcible sex offenses, fraud, kidnapping, and drug violations. * For comparison, King County is compared to Urban B, but average scores for the indicators in Urban B do not include King County. In an unduplicated person count, each person is counted only once in a year for the specified activity or service type, even if they receive that service multiple times during the year. Examples include Temporary Assistance to Needy Families (TANF) Child Recipients, Food Stamp Recipients, and alcohol or drug treatment. Duplicated counts are made of events such as prison admissions, child victims in accepted referrals, or admission to a hospital for attempted suicide. For instance, for each identified child victim in an accepted referral, that “event” is counted. Therefore, a child identified as a victim in more than one referral during the year is included more than once. Additionally more than one victim can be identified in a single accepted referral. Both the victims and the referrals are duplicated. Knowing that your county has a particular rate for one of the indicators does not help you evaluate the importance of that indicator to your risk profile. You do not know if it is higher or lower than you could reasonably expect. It is more useful to compare your county rate to the state rate, which is the average for the whole state, and to other counties, especially counties that have some characteristics in common with your county. This is especially important when urban rates differ substantially from rural rates. The comparison we present is for a group of counties that are similar in characteristics related to prevention planning: population of young people (aged 10- 24), the percentage of deaths in the county that are alcohol and drug-related, and a simple geographic division into Eastern and Western Washington. For each indicator the Counties Like Us rate is the average rate across all of the counties in the cluster. Washington State has transitioned to the NIBRS system for reporting. This was a costly staged process which was particularly difficult for smaller communities. Washington State became certified to begin submitting NIBRS data to the FBI in December 2006. Summary reporting was phased out and all reporting agencies began submitting NIBRS data by January 1, 2012. The rates for Part One offenses we previously reported should show no impact of the system change. However, the rates fortotal arrests by age group include all arrests for offenses reported which now cover the twenty-three offense categories rather than the previous eight categories. Care must be taken when interpreting the yearly trend of "total arrest" rates for an area. In areas where large amounts of arrests are likely for crimes not previously reported, a substantial increase in total arrests could to be expected starting with the 2012 data. 57 Washington State Department of Social and Health Services Research and Data Analysis Division Community Outcome and Risk Evaluation Information System (CORE). Jul 2015.
  • 63.
    Technical Notes Uniform CrimeReport - Non-Reporting Police Jurisdictions CORE Conversion Process and Weighted Reliability Index CORE obtains data from many government agency sources. The data are represented as events (e.g. # of teen births, # of crimes, # of clients) occurring within a given geographic unit. This geographic unit is generally the smallest that can be obtained from the agency source. For example, data may be available by school district, by zip code, by census tract or by police jurisdictions. CORE calls these geographic units the “source geography.” CORE data is usually reported at the geographic level of county or community – called in the rest of this report the "destination geography." Therefore, data usually needs to be converted from the “source geographies” to the “destination geography.” However when both types of events happen, only the victim incidents are reported as offenses. Offenses focus on the nature of the crime, while arrests focus on the apprehended accused perpetrator. Many offenses occur without arresting perpetrators. Sometimes charges are dropped and sometimes no perpetrator is ever found. No perpetrator age can be assigned to offence data so the entire age range of population is used as the denominator. Prior to 2012 data reported to WASPC in NIBRS format, which was not yet compatible with UCR output reports, was only included in their reports to the FBI. We listed those jurisdictions as non-reporting in UCR although WASPC considered them to have reported. Only part one offenses are reported in the Uniform Crime Report, some agencies have no part one crimes to report. Those agencies are listed with zero events, not as non-reporting. Due to the uneven geographic distribution of crime, missing police data can cause spikes or dips in the trend data comparison of multiple consecutive years. We do not run into this problem in the state report because the county rates there (as opposed to the individual county reports) only report 5-year averages. However for individual county reports and reports for smaller areas like locales or districts the trend data can become unstable due to non-reporting. Alternately, the conversion of data from certain police jurisdictions to other areas like locales may not apportion directly causing too much of the data to be apportioned based on population rather than clearly assigned to one area. We use a weighted reliability index (WRI) to determine when the conversion is no longer reliable. An explanation of that process follows. We have tried to compensate for these and other issues by suppressing data which is likely to be affected. Most law enforcement agencies report arrest and offence data to the Washington Association of Sheriffs and Police Chiefs (WASPC), which in turn provides data to the FBI’s Uniform Crime Reporting Program. This is the source of our data. Some jurisdictions do not report all arrests and offenses, some report partial years, and some withhold certain categories of arrests or offenses. Reporting is voluntary for arrests and offenses. Offenses are more likely to be reported since some funding is associated with reporting. Offenses are incidence reporting. When more than one victim is involved an offence is filed for each victim. Multiple property violations performed at the same incident are counted as one offence. In order to compensate for missing police reports, we have adjusted the denominator in the rate calculation so that it reflects only the proportion of the area for which we do have data. For instance, say area A, with a population of 40,000, has eight police districts. Now, if one of the police districts in the area did not report their arrests, the number of arrests would not be representative of the whole area. Therefore, we would not want to use the population of the whole area in the denominator because that would make the rate lower than it should be. The solution used in this report is to subtract the population of that missing police district from the area population. We follow the same procedure for police districts that report partial years: if they report only six months, we use only half of the population to calculate the rate. Information on the Non-reporting Population and Non-reporting Agencies are available only in the individual county, district, and locale level reports. Each area report shows how and when that area's police jurisdictions reported data to the Washington Association of Sheriff's and Police Chiefs. If your area is one with jurisdictions having a significant amount of incomplete data, be very careful that you adjust your risk assessment to reflect this. In other words, the reported arrest rates may not adequately reflect the entire area. This will be true especially in those cases where the non-reporting police jurisdictions have either very high or very low arrest rates, compared to the rest of the area. 58 Washington State Department of Social and Health Services Research and Data Analysis Division Community Outcome and Risk Evaluation Information System (CORE). Jul 2015.
  • 64.
    Technical Notes Example 1 Thefollowing statements refer to the first example: Example 2 For example, see the situation depicted in Example 2 below. Here we are trying to estimate the number of events contained in two very small destination geographies (the ovals). Could this synthetic estimate be reliable? Perhaps, if the small area within the ovals really is representative of the whole area -- but more likely not. These events are split by age, race and gender subgroups whenever possible, as are the populations. So the synthetic estimation is broken down that way also. If 40% of the young White population of the suburban school district lives in the destination geography, then 40% of the events occurring to young White people are attributed there. If, on the other hand, only 10% of the young American Indian population of the suburban school district lives in the destination geography, then only 10% of the events occurring to young American Indian people are attributed there. Data being converted from a smaller geography (source geography) like school district to a larger geography (like a county) is usually fairly reliable because most of the smaller pieces fit neatly and wholly into the new geography. (See example 1). While we can develop an algorithm to distribute all source geography populations to all destination geography populations, that distribution will not always be reliable. The rectangles represent two possible data source geographies (one densely populated school district – Urban School District -- and one thinly populated school district – Suburban School District -- surrounding it). The large oval represents a report's destination geography such as county, locale or network. All of the events occurring in the urban school district can be attributed entirely to the destination geography. The events occurring in the split source geography (suburban school district, in this example) are distributed to the destination geography in the same proportion as the underlying population is distributed. If 40% of the suburban school district population lies within the destination geography, then 40% of its events are attributed to the destination geography. The conversion is based on an overlay process, in which the events occurring in small source geographies that are totally contained within the destination are combined with synthetic estimates of events occurring in source geographies that are partly within and partly outside the destination geography. The synthetic estimation is weighted by the population distribution between the source and destination areas. Therefore, it requires a small-scale count of the population underlying both source and destination geographies. This process is explained below through examples. Thinly Populated Densely Populated Urban Suburban Output Geography InputGeography InputGeography 59 Washington State Department of Social and Health Services Research and Data Analysis Division Community Outcome and Risk Evaluation Information System (CORE). Jul 2015.
  • 65.
    Technical Notes The keyunderlying assumption behind the CORE Weighted Reliability Index is as follows: Example 3 Percent of source population attributed to destination Multiplied by the population attributed to the destination zip code 1 10/80 = 12.5% * 10 zip code 2 900/1000 = 90% * 900 Total for Destination 910 810.00 In the above example, the Weighted Reliability Index for Destination City is 811.25 / 910 = 89%. Basically, 89% of the event locations were directly attributed to the area they occurred. Along with the WRI a cut point for reliable reporting is needed. When half or more of the events have been imputed to the destination geography, rather than directly attributed from the source geography, the data is considered unreliable and rates are suppressed. A statistic is needed to assist researchers in determining when a destination geography's events cannot be reliably estimated using these processes. For CORE, that statistic is the Weighted Reliability Index (WRI). The amount of overlap between source and destination populations can vary from less than 1% to 99% -- only a little of a source population can live in a destination, or almost all of the source population can live in a destination. 1.25 811.25 When most of the population for the source geography is also in the destination geography, we can be more certain of the reliability of the estimation process. Therefore, the weighting process lets us calculate, for each source-geography/destination-geography combination, the reliability of each destination geography's estimate. In the figure for Example 3, for zip code 2 the source area population is mostly in the destination oval (encased in the dashed line), but the majority population from the other contributing source area is not. The oval represents the destination geography boundary -- the edge of a destination city. The rectangles represent the source geography boundaries for two zip codes. The numbers are population of people living in each place: 10 people live both in Destination City and in the first source (Zip code 1), and 900 people live both in Destination City and in the second source (Zipcode2). The formula for Weighted Reliability Index for a single destination is the total weighted destination population as a percent of total population. To understand this formula, see the calculations below. Amount of destination Zip code 2 Zip code 1 100 900 10 70 60 Washington State Department of Social and Health Services Research and Data Analysis Division Community Outcome and Risk Evaluation Information System (CORE). Jul 2015.
  • 66.
    Technical Notes WRI forAreas with Non-Reporting of Data Example 4 The second test of reliability is to determine whether the population for the rate is adequately represented. In this example, allow the numbers inside the oval to represent a population of 100 allocated to the destination geography. Two source jurisdictions are entirely located in the destination geography represented by the oval. Their events when reported would be directly attributed. The non- reporting jurisdiction would have its population of 50 excluded from the calculation for WRI, while the reporting jurisdiction would have its population included in the calculation. In this case the completely contained reporting jurisdiction would represent 30 of the remaining 50 population (60%) in the destination oval. The imputed portion is 40% allowing the destination geography to pass the first test for WRI. The reliability of arrest rates is calculated each year based on non-reporting. For five year rates, three out of five data years must be considered reliable by both tests and the average of the yearly WRI for all five years must reach the WRI cut point value. Partial Reporting, part of a year or part of a population, is also taken into consideration when computing the percentage of non- reporting in a destination geography. Adult and juvenile rates are evaluated separately. Some areas may pass for one, but not for the other due to their reporting habits. For partial year reporting the percentage of the year with data reported is used to evaluate each category. CORE also requires that the excluded non-reporting jurisdiction population (50 of 100) are less than 50% of the total population for the destination geography. With an exclusion rate of 50%, this destination geography would fail the reliability criteria. There is a second way that data may become unreliable. Some police jurisdictions do not report data to the state sources, use a reporting method which cannot be included in our files, fail to report for either adults or juveniles, or report for only part of a year. This is particularly true for court data – arrests or offenses. In order to accurately evaluate the reliability of data conversions for destination geographies containing those jurisdictions, non-reporting jurisdiction populations were excluded from the calculations for WRI and the non-reporting jurisdiction issue is evaluated separately. Non-reporting Jurisdiction reporting jurisdiction 50 3 4 3 30 2 5 3 61 Washington State Department of Social and Health Services Research and Data Analysis Division Community Outcome and Risk Evaluation Information System (CORE). Jul 2015.
  • 67.
    Technical Notes Rates: whyis “raw data” converted to rates? For instance: County A: # of licenses – 42, # of persons (all ages) – 14, 297 County B: # of licenses – 399, # of persons (all ages) – 186,185 To calculate the rate per 1,000: 42 / 14,297 = .002937 .002937 X 1,000 = 2.94 399 / 186,185 = .002143 .002143 X 1,000 = 2.14 Standardization of CORE Indicators The preferred way to compare different indicators is to find out how much each individual indicator varies from some common point; in CORE reports the point we use is the indicator’s value for the state. In more technical terms, we transform the original absolute rates to a common scale: the relative deviation from the state rate. This is called a standardized score, and is based on the mathematical calculation of the standard deviation. For a particular indicator, the county (school district, locale) with the highest absolute rate will have the highest standardized score. A standardized score of 1.2, for instance, means that the county’s rate is 1.2 standard deviations above the state rate, and a –1.2 would be 1.2 standard measures below the state rate. Approximately 95% of all counties (school districts, locales) in the state will fall between +2 and –2 standard deviations from the state rate. An individual indicator by itself is interesting because you can compare your county (school district, locale) to all other counties (school districts, locales), and to the state. You can also look at how the indicator changes over time. But it is more difficult to compare several indicators to each other, for example, if you want to see which indicator of risk is extremely high and which is just average. For instance, you cannot directly compare the number (or rate) of alcohol retail licenses to the number (or rate) of Food Stamp recipients--- this would be like comparing apples and oranges and would not be meaningful. So the rate of alcohol retail licenses is 2.94 per 1,000 people in County A, and 2.14 per 1,000 people in County B. In order to make comparisons between counties and the state, and between counties that have different sizes, we use rates to describe an event in terms of a standard size population---either per 100 (percent), per 1,000 or per 100,000. For instance, what does it mean if County A has 42 alcohol retail licenses, and County B has 399? Does it mean that based on this indicator, the risk factor (Availability) is much higher in County B than it is County A? No, not if County B is a much bigger county. If County B is bigger, then the “rate” of liquor licenses per population might be the same or even lower. The only way to compare them is to convert the raw numbers to rates, based on the same population factor. CORE standardized indicators for counties are calculated using the following formula. The same formula is used for locales and for districts, by substituting locale or district rates for county rates in the formula. CORE indicators are standardized using a formula similar to the calculation of a z-score. A typical z-score for an observation (a county, a locale, a school district) is calculated as a difference between an observation and the mean (average) of all observations, divided by the standard deviation for all observations. A CORE standardized score for a county (school district, locale) is instead calculated using the state rate in place of the mean for all counties (school districts, locales). A standardized CORE indicator avoids the problem of using an unweighted mean of all counties (school districts, locales) that would give counties of very different size equal weight, and therefore provides a more meaningful comparison. Here is an example. Let’s say an indicator for extreme family economic deprivation (Food Stamp recipients per 100 people) has a standardized score of 2.5 and an indicator for availability of drugs (alcohol retail licenses per 1,000 people) has a score of 1.2. We can say that, other things being equal, the county (school district, locale) in question has a higher risk for extreme family economic deprivation than for availability of drugs. N statecounty statecounty scorestdiz N i rateirate raterate = − − = 1 2 , )( _ 62 Washington State Department of Social and Health Services Research and Data Analysis Division Community Outcome and Risk Evaluation Information System (CORE). Jul 2015.
  • 68.
    Technical Notes Graduation andDropout Data Methodology Change How do the methods differ? Where are the roadblocks to learning in our communities? Academic Achievement: The CORE measures academic achievement using three groups of indicators: 1. Student assessment on statewide tests; 2. Students who graduate from high school; 3. Students who drop out of high school, failing to complete their education. Student Assessment Graduating from High School Two types of high school graduation rates are listed in the CORE reports, On-time Graduation and Extended Graduation. The indicators for Poor Academic Performance , are available for grades 4, 7 and 10. The indicators are calculated as a percentage of students tested in each grade assessment. Earlier years of information are from the Washington Assessment of Student Learning (WASL). In 2009-10 the WASL was replaced by the Measurements of Student Progress (MSP) for grades 3 through 8 and the High School Proficiency Exam (HSPE) for grade 10. Some districts have chosen to test students in both grades 9 and 10 for the 10th grade assessment, giving freshmen a second chance to pass the test. Passing the HSPE is essential for high-school graduation. Ninth graders who were tested are included with the tenth graders in the calculation of the Academic Achievement indicator for grade 10. 2011-2012 and beyond May adjust for deficient credits. Estimated Cohort (old method) Prior to 2011-2012 school year Is a composite cohort. Uses dropout rates for all grades within one school year to determine an estimate of the number of students graduating. Allows for alternate expected graduation year for students in special education or ELL programs. Beginning with the 2011-2012 school year major changes were made in how to measure dropouts and graduation for students in Washington State. "Graduation Rate Calculations in Washington State" , a March 2012 publication by the Office of Superintendent of Public Instruction, does an excellent job of explaining these changes. The following chart is an extract from that document (page 4). For On-time Graduation , a student must graduate within four years by completion of the graduation requirements. The Estimated Cohort (old method)On-Time Graduation rate formula uses dropout rates discussed below; the formula is: 100*(1-grade 9 dropout rate)*(1-grade 10 dropout rate)*(1-grade 11 dropout rate)*(1-grade 12 dropout rate-grade 12 continuing rate). The on-time graduation rate is the inverse of the cumulative dropout rate with the senior class adjusted to remove those students who stay in school for more than four years from the calculation. The Adjusted Cohort (new method)rate divides the number of students graduating in their fourth year by the adjusted freshman cohort for those students. Is an actual cohort; individuals are tracked over 4 years with adjustments made for transfers in/out. Imposes concept of four-year timespan. There are no adjustments for Special Ed or Limited English students who are expected to take longer. All students are expected to graduate four years after first entering 9th grade. Transfers from out of state or other districts who are credit deficient may not be reclassified into a lower grade. Adjusted Cohort (new method) 63 Washington State Department of Social and Health Services Research and Data Analysis Division Community Outcome and Risk Evaluation Information System (CORE). Jul 2015.
  • 69.
    Technical Notes Dropping Outof High School School Climate: Extreme Family Economic Deprivation: The High School Cohort Dropout rate (may also be referred to as the longitudinal, cumulative, or freshmen cohort dropout rate) measures what happens to a single group (or cohort) of students over a period of time. This rate is most useful for seeing the long-term impact on the community. The Estimated Cohort (old method)Cohort (Cumulative) Dropout rate formula is: 100-(100*(1-grade 9 dropout rate)*(1-grade 10 dropout rate)*(1-grade 11 dropout rate)*(1-grade 12 dropout rate)). The cohort rate is significantly higher than the annual rate for the same area as it measures the cumulative effect of the multiyear loss of students from their freshmen cohort. The Adjusted Cohort (new method)rate is the number of students dropping out prior to graduation divided by the adjusted cohort for the freshman class of the graduates. Indicators listed under School Climate give an idea of how safe students may feel in their school or how committed they and their fellow students are to learning. These indicators are Weapons Incidents in School (rate per 1,000 students) and Unexcused Absences for Students in Grades 1 to 8 (as a percentage of total student days possible in the school year, which equals the number of students times teaching days). When weapons incidents are common or it is acceptable for young students to frequently miss school without explanation the school climate is not conducive to learning. Hungry students find it difficult to focus their attention long enough to learn. Those with inadequate housing or clothing may find it difficult to interact with their peers. There are three indicators which evaluate levels of poverty. Child Recipients of TANF (Temporary Assistance for Needy Families) gives the rate of children from birth to 17 who receive income assistance. The child must be a citizen or legal alien and their caregiver must not have exceeded the 60 month maximum. There is a requirement for the adults to seek work and an income evaluation. Teen parents must attend school. Supplemental Nutrition Assistance Program (SNAP) Recipients. The SNAP program was formerly called the Food Stamps program, and shows a more generalized level of need. While the persons must be citizens or legal aliens who seek work and meet the income guidelines there is no cutoff time limit for benefits. Extended Graduation requires more resources and dedication from district staff. It includes those students who stay in school after their senior year and complete the graduation requirements. Districts which have high extended graduation rates may also have higher dropout rates since the students attempting extended graduation are also at highest risk of again dropping out. A large difference in the size of the on-time and extended graduation rates may indicate that a district or school is working hard to keep students in school or to have dropouts return to school and attempt to graduate. The Estimated Cohort (old method)Extended Graduation rate formula is: (the number of on-time and late graduates)/(the number of on-time graduates divided by the on-time graduation rate). The Adjusted Cohort (new method) rate is the number of students graduating within five years divided by the adjusted cohort for the freshman class of the graduates. Two types of high school dropout rates are listed in the CORE reports, Annual (Event) Dropouts and High School Cohort (Cumulative) Dropouts. The Annual Dropout rate measures the proportion of students enrolled in grades 9-12 who drop out in a single year without completing high school as a percentage of all students in grades 9 through 12 that year. When districts try new policies or projects to keep students in school the impact of those actions will be more immediately visible in this rate. This rate is much more difficult for the data provider to compute from data stored within the new cohort designations for students as it draws information from four separate cohorts. Data production during the transition to the new method will likely have at least one year of data which will probably never be produced. The formula and the data for this rate have not been changed by the new methodology. 64 Washington State Department of Social and Health Services Research and Data Analysis Division Community Outcome and Risk Evaluation Information System (CORE). Jul 2015.
  • 70.
    Technical Notes Suppression Codesfor Yearly Trend Data SN=Small Number Sample. Geography has less than 30 events in the denominator. More reliable at 5 year level or for larger area. NR=Not reliable due to non-reporting of police jurisdictions data. Fifty percent or more of the population is not represented by the data due to non-reporting jurisdictions. UN=Unreliable conversion of events to report geography, failure of weighted reliability index (WRI). The WRI evaluation process is further explained in the section labeled ‘CORE Conversion Process and Weighted Reliability Index’. SP=Suppressed by agreement with data provider when denominator is below agreed level and may compromise a person's rights to confidentiality. However, there are other ways to qualify. Many persons earning a gross income up to 200% of the Federal Poverty Level apply for income assistance because their children are automatically eligible for free school lunch if they meet the adjusted income guidelines. These are sometimes called $0 grants. Households receiving assistance under SNAP, TANF for their children, Food Distribution Program on Indian Reservations (FDPIR) or, with children who are homeless, fostered, runaway, migrant, or in Head Start Programs are eligible for free benefits. If any child or household member receives benefits under Assistance Programs all children who are members of the household are eligible for free school meals. Students Eligible for Free or Reduced Price Lunch gives a much broader look at poverty in your area. Children of people who are “working poor”, who have exceeded 60 months in benefits, are not legal aliens, or are not seeking work can still receive meals and free milk. The free guidelines are at or below 130 percent of the Federal poverty guidelines and the reduced price guidelines are between 130 and at or below 185 percent of the Federal poverty guidelines. 65 Washington State Department of Social and Health Services Research and Data Analysis Division Community Outcome and Risk Evaluation Information System (CORE). Jul 2015.
  • 71.
    Population of AreasNot Reporting Arrests or Offenses Mason County Mason Populations subtracted for police agencies not reporting All Arrests for 10-14 year olds have 5 year rates which represent 93.13 % of the population. 2003 2004 2005 2006 2007 2008 2009 2010 2011 2012 2013 % Subtracted 3.33 1.78 1.96 2.00 2.03 2.03 2.05 3.13 22.97 3.09 3.11 Subtracted, 10-14 118 63 70 71 72 72 72 110 813 109 109 Persons, 10-14 3,548 3,531 3,576 3,550 3,553 3,548 3,517 3,513 3,539 3,530 3,507 Adjusted Pop 10-14 3,430 3,468 3,506 3,479 3,481 3,476 3,445 3,403 2,726 3,421 3,398 All Arrests for 10-17 year olds have 5 year rates which represent 93.39 % of the population. 2003 2004 2005 2006 2007 2008 2009 2010 2011 2012 2013 % Subtracted 3.33 1.81 1.88 1.90 1.90 1.87 1.89 2.84 22.65 2.82 2.84 Subtracted, 10-17 192 104 110 111 112 110 109 163 1,277 159 158 Persons, 10-17 5,770 5,758 5,837 5,854 5,905 5,881 5,782 5,742 5,639 5,634 5,571 Adjusted Pop 10-17 5,578 5,654 5,727 5,743 5,793 5,771 5,673 5,579 4,362 5,475 5,413 All Arrests for adults have 5 year rates which represent 94.46 % of the population. 2003 2004 2005 2006 2007 2008 2009 2010 2011 2012 2013 % Subtracted 2.55 1.19 1.13 1.11 1.08 1.05 1.04 1.48 22.36 1.42 1.42 Subtracted, 18+ 990 468 483 489 494 495 498 713 10,931 701 704 Persons, 18+ 38,813 39,426 42,643 44,007 45,647 47,010 47,791 48,322 48,896 49,247 49,609 Adjusted Pop 18+ 37,823 38,958 42,160 43,518 45,153 46,515 47,293 47,609 37,965 48,546 48,905 All Offenses for persons have 5 year rates which represent 98.45 % of the population. 2003 2004 2005 2006 2007 2008 2009 2010 2011 2012 2013 % Subtracted 1.38 1.36 1.27 1.24 1.22 1.19 1.17 1.68 1.63 1.63 1.62 Subtracted, 18+ 694 691 692 696 706 709 702 1,019 998 1,000 1,002 Persons, 18+ 50,200 50,800 54,551 56,063 57,951 59,459 60,199 60,699 61,096 61,441 61,786 Adjusted Pop 18+ 49,506 50,109 53,859 55,367 57,245 58,750 59,497 59,680 60,098 60,441 60,784 Adjustments for Non-reporting Arrests (age 10-14) Adjustments for Non-reporting Arrests (age 10-17) Adjustments for Non-reporting Arrests (age 18+) Adjustments for Non-reporting Offenses Police agencies are not required to report arrests or offences to UCR/NIBRS, they do so voluntarily. For a variety of reasons, a jurisdiction may report part or none of the arrests or offences for a year. In these cases, the denominator is the population of the areas that did report. For example, if juvenile arrests for one agency are not reported, the juveniles for that jurisdiction are not included in the population denominator either. The tables below show the values that comprise the adjustment for your county for each age range we report. "% Subtracted" is the percent of the county's population subtracted for non-reporting. "Subtracted" is the amount subtracted. "Persons" is the locale's population. "Adjusted Pop" is the denominator used to calculate indicator rates. Nevertheless, rates can differ markedly from year to year particularly if a jurisdiction, where most of the crime in the county occurs, did not report. When 50% or more of the population is not reported the yearly rate is suppressed. Jurisdictions crossing county boundary lines are apportioned to each area by age, and sex of the population. When more than 40% of the reported events have been apportioned, "synthetically estimated", the yearly rate is suppressed. 66 Washington State Department of Social and Health Services Research and Data Analysis Division Community Outcome and Risk Evaluation Information System (CORE). Jul 2015.
  • 72.
    Agencies Not ReportingArrests and/or Offenses Mason County Percent of Adult Arrests Not Reported to UCR/NIBRS by Year Jurisdictions 2003 2004 2005 2006 2007 2008 2009 2010 2011 2012 2013 Mason CO 25.0 Shelton PD 8.0 Skokomish Squaxin Island Tribal PD 100.0 100.0 100.0 100.0 100.0 100.0 100.0 100.0 100.0 100.0 100.0 Back to Population Deducted Police agency jurisdictions which are located at least partially in your county are listed below. The table shows the percentage of non-reporting by jurisdiction for each year. 67 Washington State Department of Social and Health Services Research and Data Analysis Division Community Outcome and Risk Evaluation Information System (CORE). Jul 2015.
  • 73.
    Agencies Not ReportingArrests and/or Offenses Mason County Percent of Juvenile Arrests Not Reported to UCR/NIBRS by Year Jurisdictions 2003 2004 2005 2006 2007 2008 2009 2010 2011 2012 2013 Mason CO 25.0 Shelton PD 8.0 Skokomish Squaxin Island Tribal PD 100.0 100.0 100.0 100.0 100.0 100.0 100.0 100.0 100.0 100.0 100.0 Back to Population Deducted Police agency jurisdictions which are located at least partially in your county are listed below. The table shows the percentage of non-reporting for juvenile arrests each year. 68 Washington State Department of Social and Health Services Research and Data Analysis Division Community Outcome and Risk Evaluation Information System (CORE). Jul 2015.
  • 74.
    Agencies Not ReportingArrests and/or Offenses Mason County Percent of Offenses Not Reported to UCR/NIBRS by Year Jurisdictions 2003 2004 2005 2006 2007 2008 2009 2010 2011 2012 2013 Mason CO Shelton PD Skokomish Squaxin Island Tribal PD 100.0 100.0 100.0 100.0 100.0 100.0 100.0 100.0 100.0 100.0 100.0 Back to Population Deducted Police agency jurisdictions which are located at least partially in your county are listed below. The table shows the percentage of non-reporting for offenses each year. 69 Washington State Department of Social and Health Services Research and Data Analysis Division Community Outcome and Risk Evaluation Information System (CORE). Jul 2015.