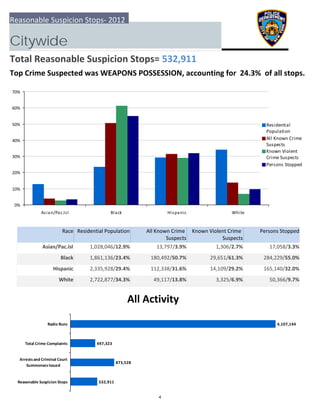
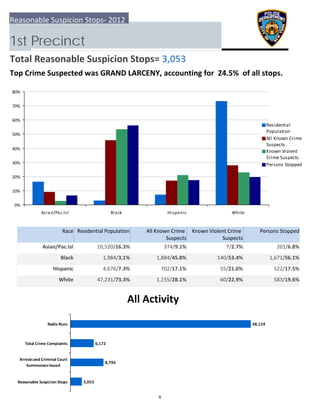
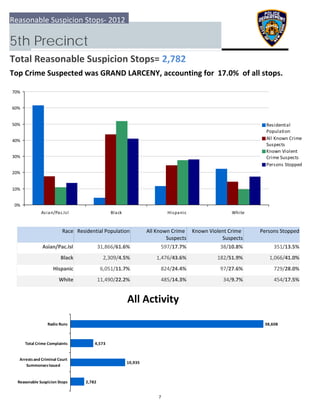
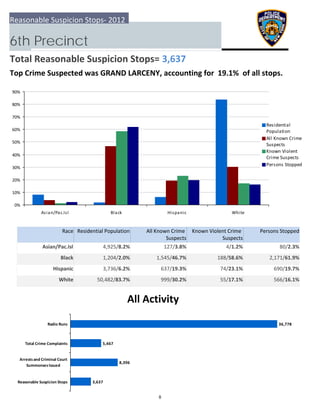
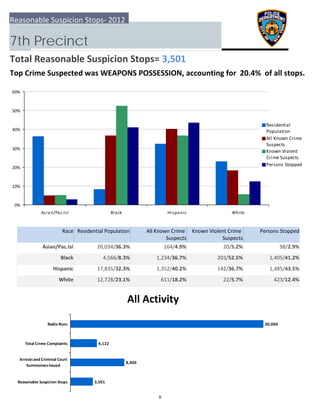
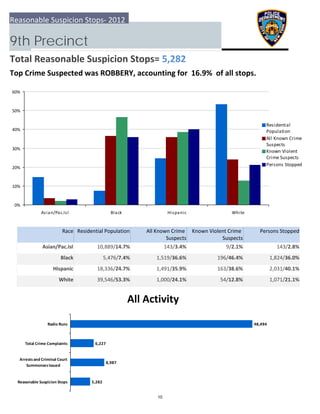
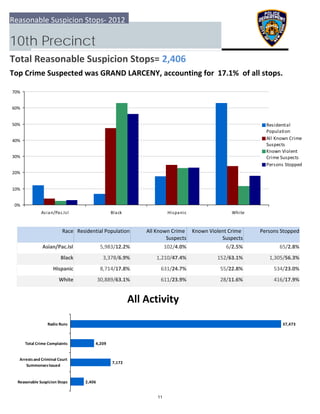
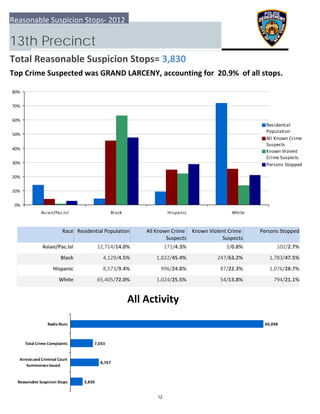
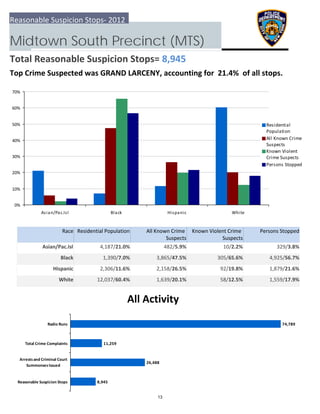
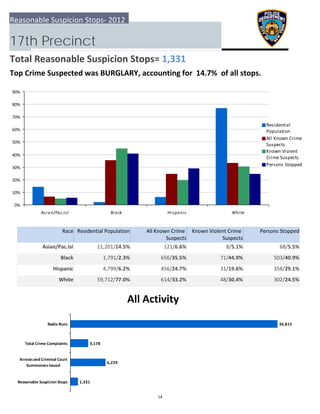
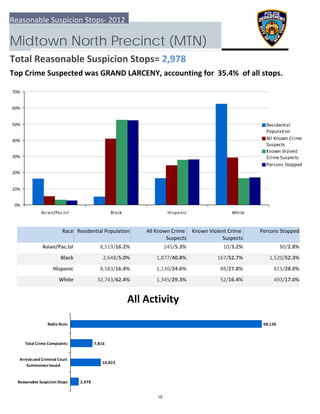
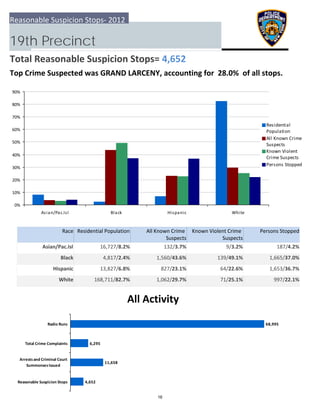
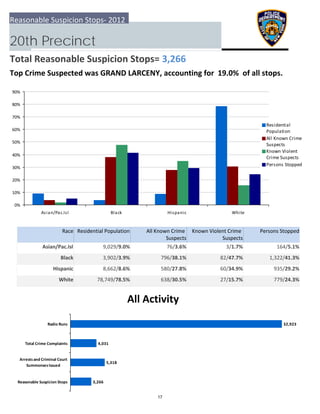
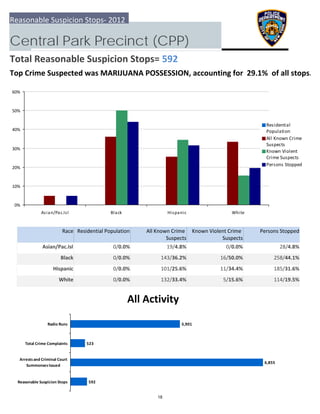
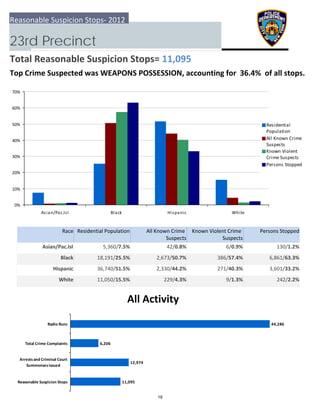
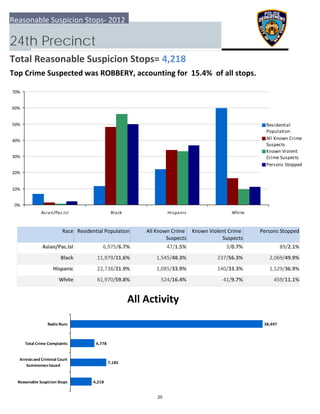
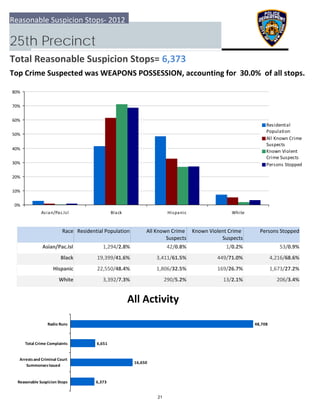
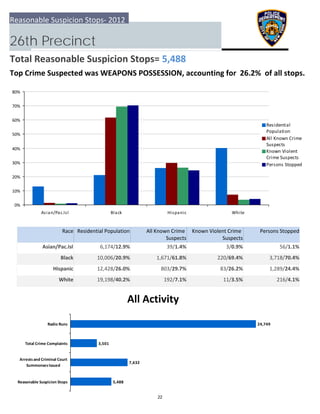
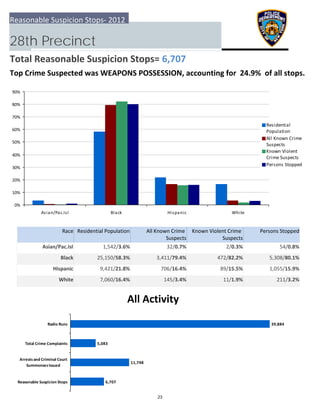
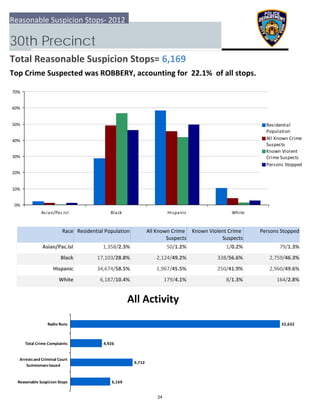
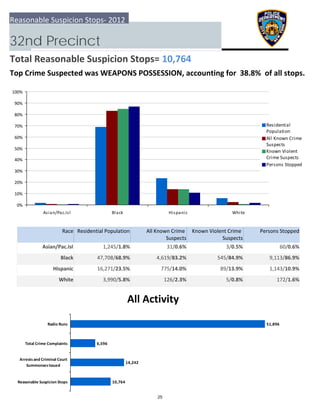
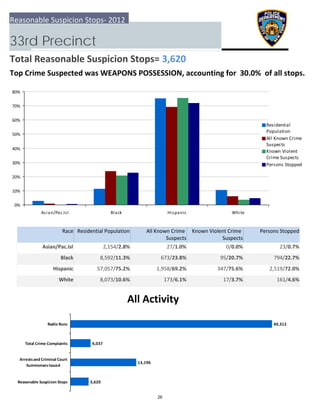
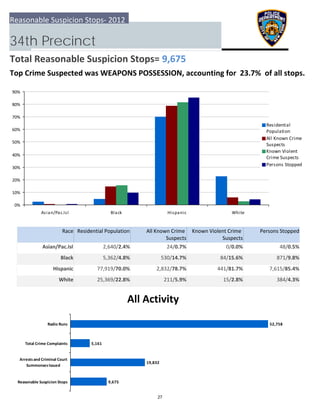
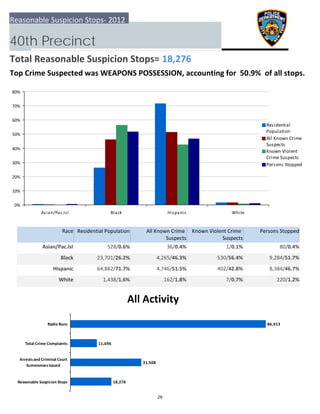
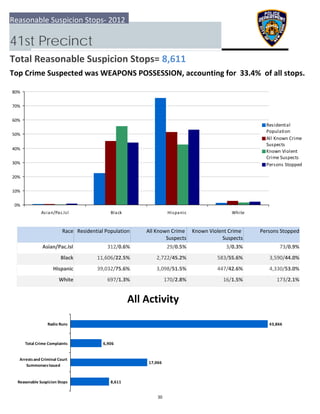
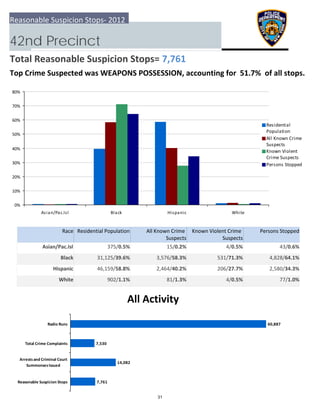
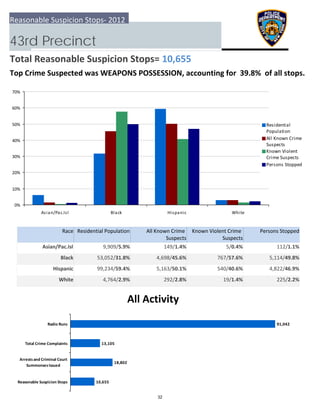
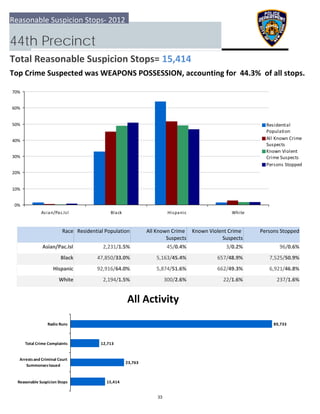
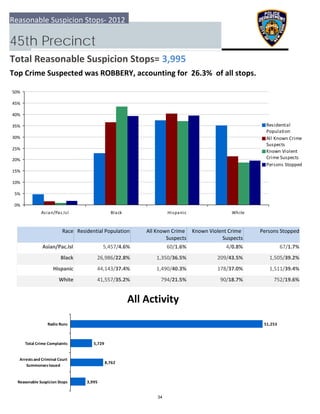
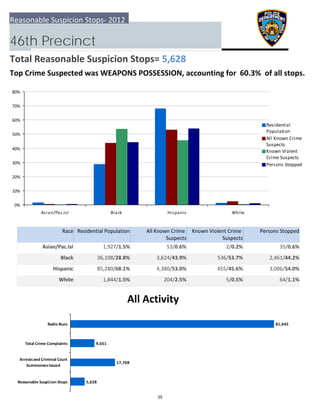
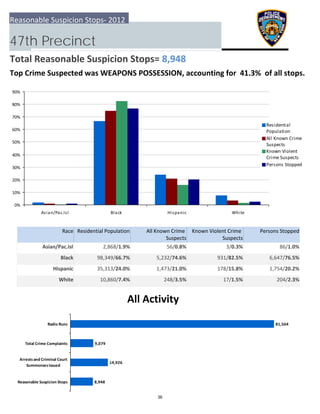
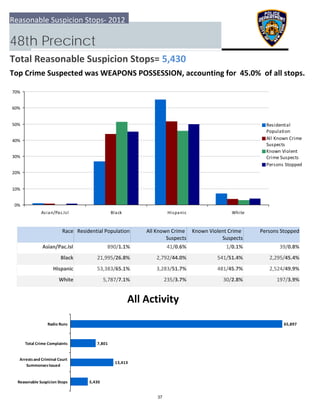
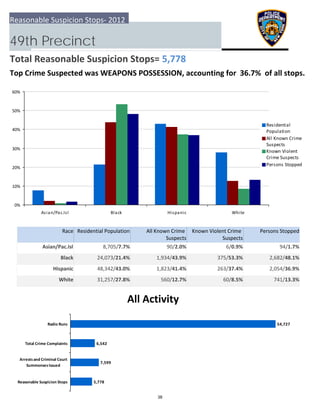
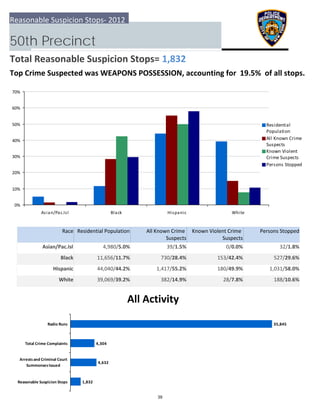
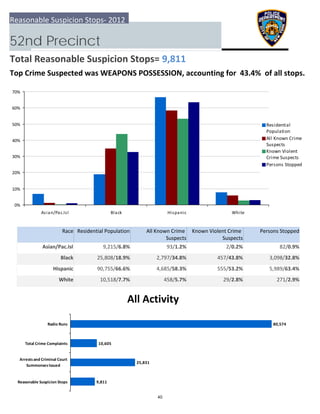
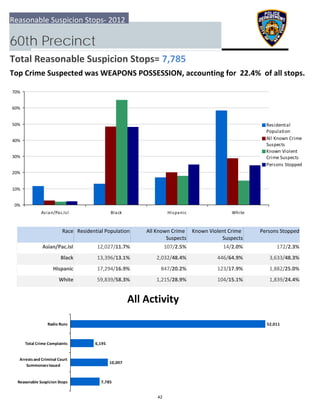
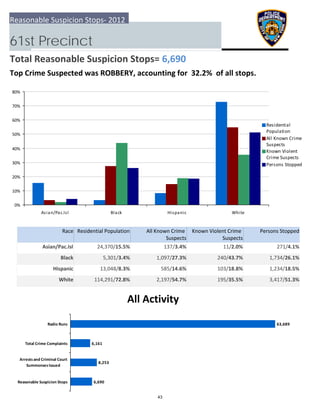
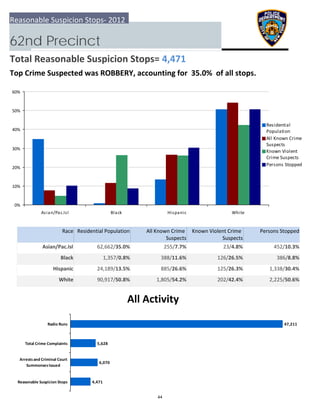
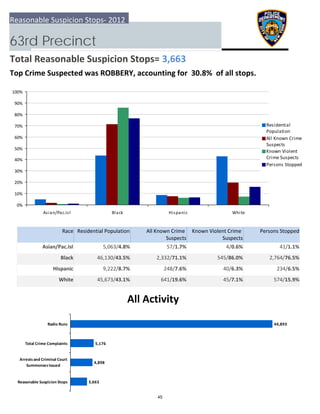
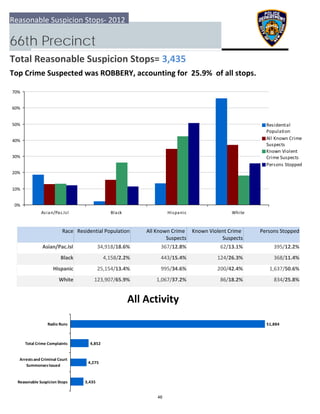
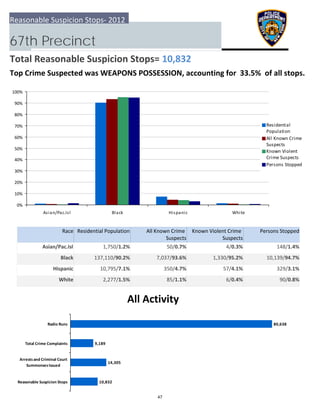
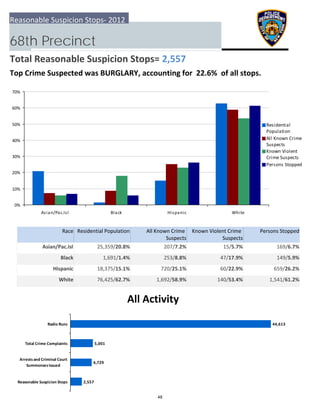
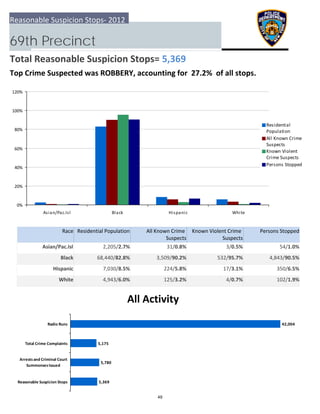
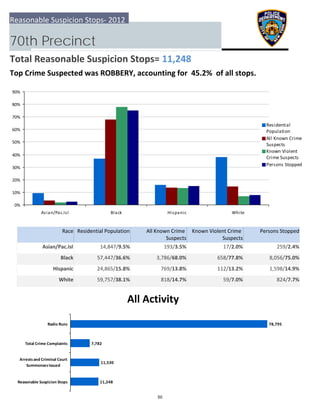
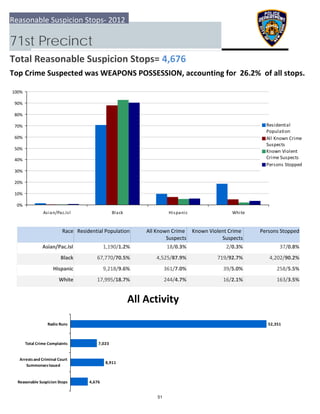
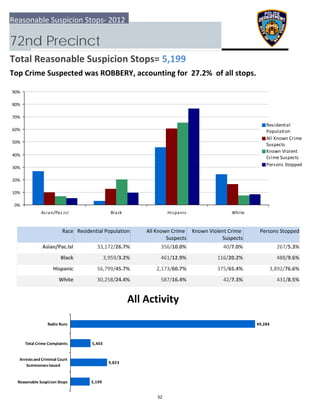
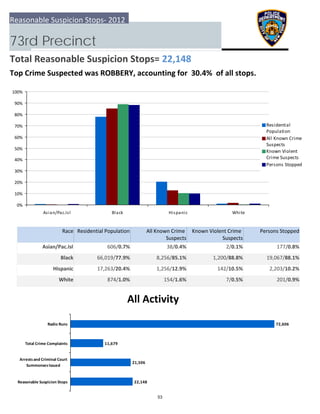
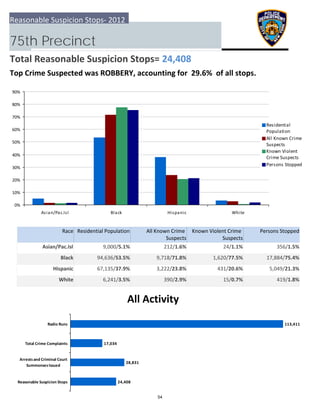
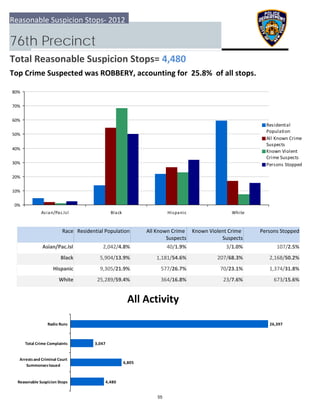
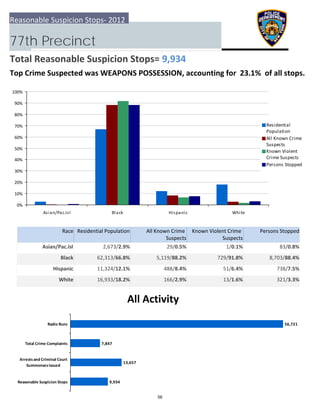
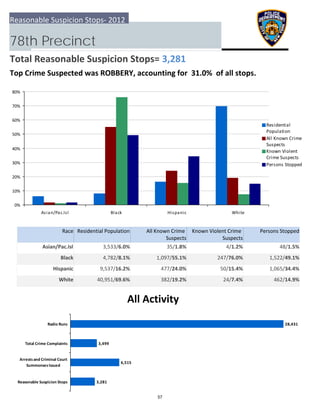
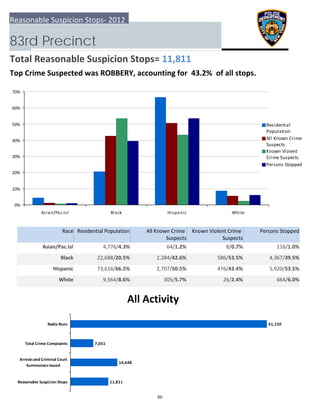
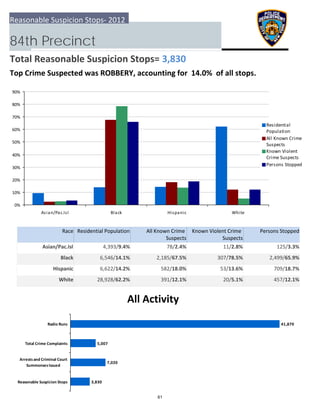
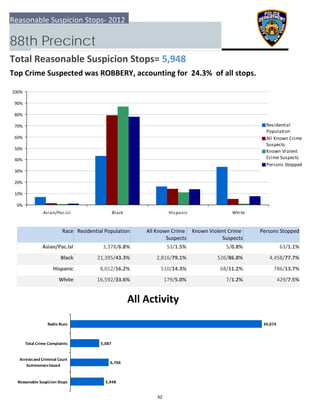
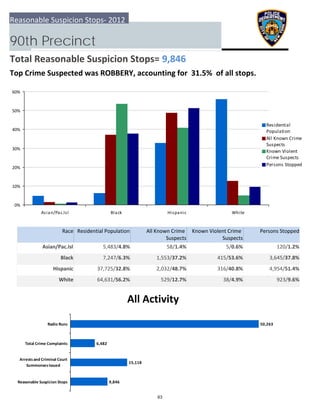
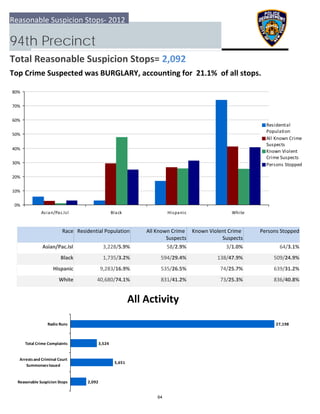
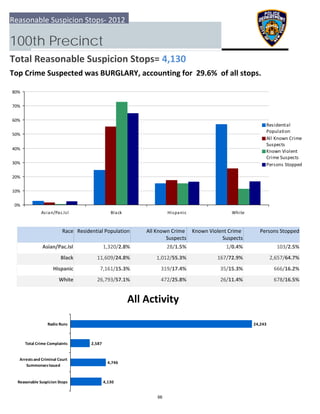
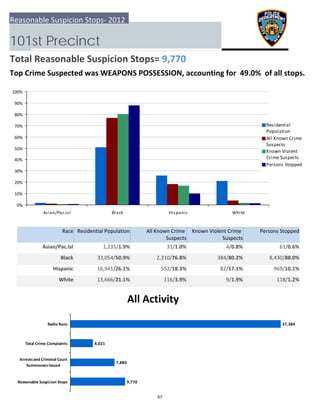
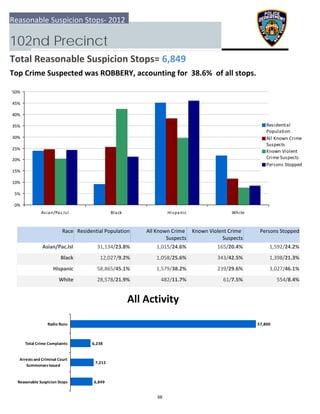
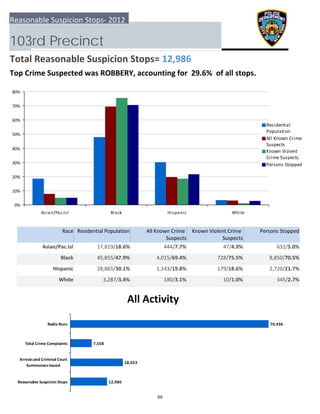
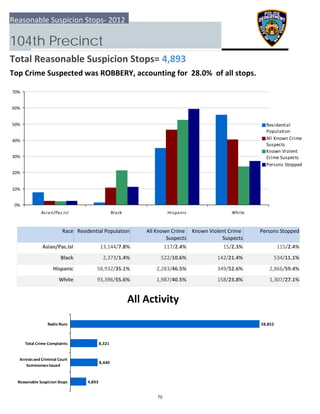
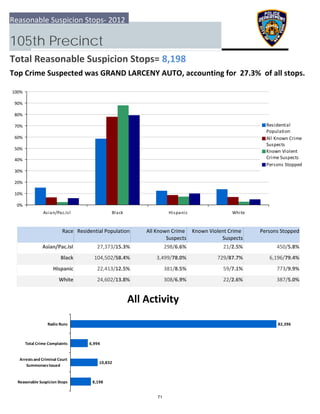
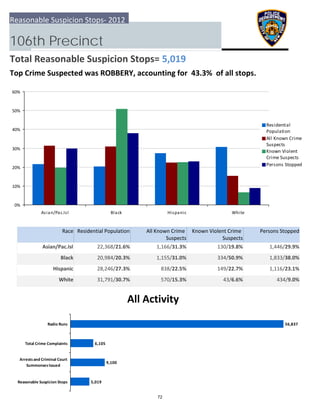
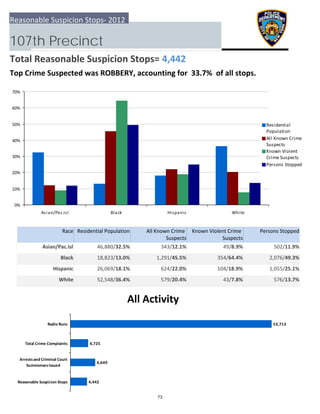
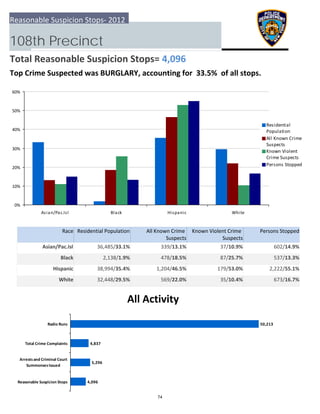
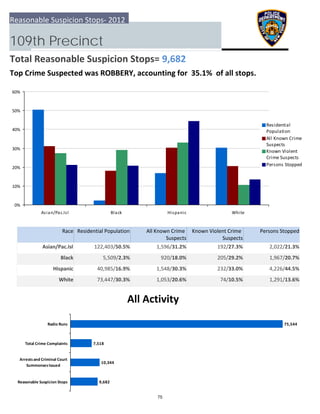
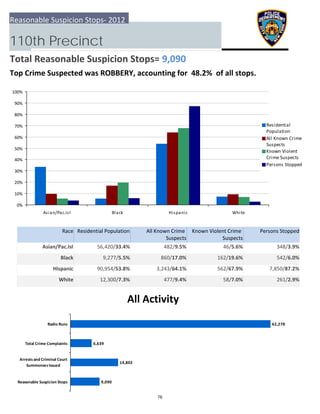
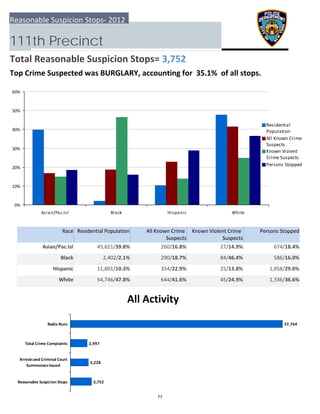
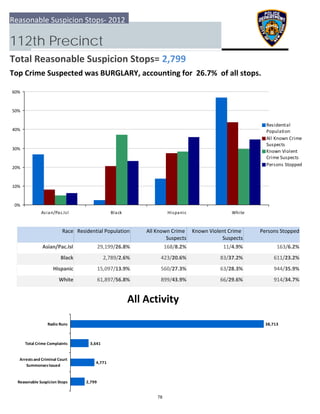
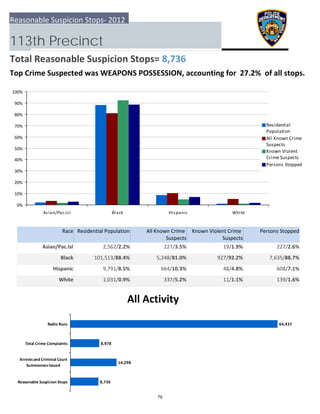
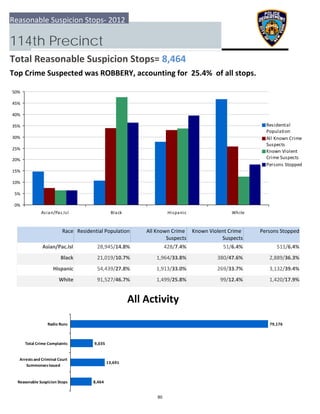
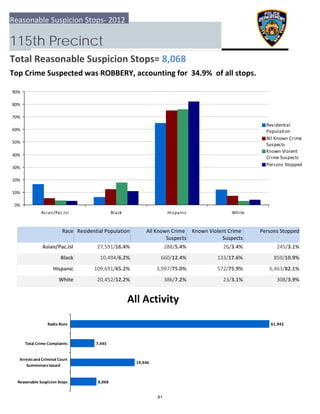
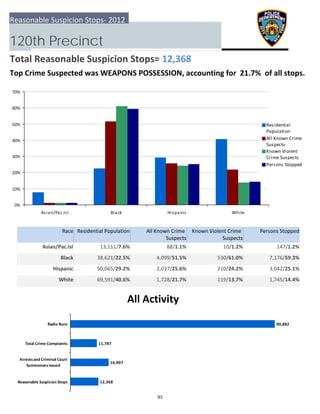
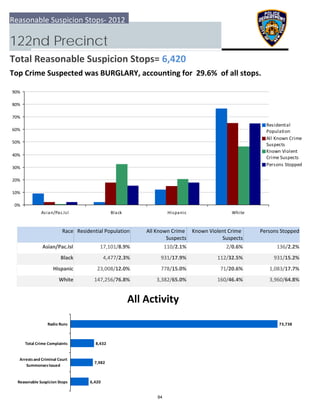
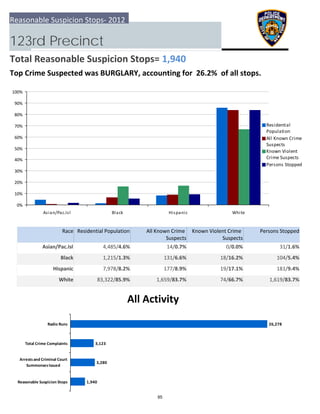
2012 
REASONABLE SUSPICION STOPS: 
PRECINCT BASED COMPARISON BY  
STOP AND SUSPECT DESCRIPTION 
 
 
Raymond W. Kelly
Police Commissioner 
 
New York City Police Department 
Reasonable Suspicion Stops: 2012
 
Introduction 
  The  following  pages  present  data  on  the  residential  population  of  police 
precincts, as reported by the 2010 U.S. Census, as well as the benchmark of crime 
suspect description in that precinct, by race, as compared to stop activity in that 
precinct, by race. These precinct pages also include an overview of other police 
activity in the precinct compared to reasonable suspicion stops.  The first page 
illustrates this data on a Citywide basis.  


1
Explanation of Data and Statistical Notes 
Top Crime Suspected‐ The crime suspected (when initiating a stop) is entered by a 
police officer in a field of the Department Stop, Question and Frisk worksheet and 
information taken from that worksheet is entered into the NYPD Stop, Question 
and Frisk database. In this report, the percentages of the Top Crime Suspected are 
based  on  data  publically  released  on  the  Department  website  from  the  NYPD 
Stop, Question and Frisk database. The percentage compares the number of stops 
reported for each specific crime suspected to the total number of stops reported 
in each precinct on a Stop, Question and Frisk report. 
Residential  Population*
‐  Residential  figures  are  based  on  the  2010  census, 
broken  down  by  race  and  police  precinct.  Data  provided  by  New  York  City 
Department of City Planning‐Population Division. 
All Known Suspects/Violent Crime Suspects*
‐ In order to properly determine the 
“known  arrested  and  un‐arrested  suspects”  for  crime  complaints  recorded  in 
2012 the following procedures were employed: all crime reports with a recorded 
occurrence date in 2012, as of January 27th
, 2013, supplied information on un‐
arrested suspects and; the arrests effected in 2012, no more than 24 hours after 
the  recording  of  complaints  occurring  in  2012,  supplied  the  arrested  suspect 
information.**
 For the purpose of this report, violent crime includes murder, rape, 
robbery, and felony assault. 
The process of determining the known arrested and un‐arrested suspects made 
use of most of the complaints recorded in 2012 (497,323 of 503,780) but only a 
portion of the arrests recorded in 2012. One hundred ninety‐five thousand eight 
hundred sixty arrests were used in the merge. The remaining arrests recorded in 
2012 were excluded because they were made for complaints occurring prior to 
2012, they were made for complaints occurring in 2012 but as a result of follow‐
up investigations after the 24 hour period, or they were arrests for instances in 
which a complaint report is not prepared. 
   
                                                            
* Figures include Asian, Black, Hispanic, and White races only. Unknown and other races are not included in these 
figures. 
**
 The 24 hour rule was employed to avoid double counting suspects as both arrested and un‐arrested, as follow‐
up investigations produced arrests of individuals who were originally recorded as un‐arrested suspects. 
2
Persons Stopped*
‐ Percentages of race are based on supplied identification, self‐
identification or officer identification as reported on the Stop, Question and Frisk 
report and returned from the NYPD Stop, Question and Frisk database. 
Radio Runs‐ Number of radio runs created in response to calls for service from 
the  public.  Number  based  on  all  requests  for  assistance  that  were  transmitted 
over  police  radio  and  assigned  a  “job  number,”  including  911  calls,  patrol 
encounters, and request for assistance from a person on the street. 
Requests from a person walking into or calling a precinct directly and requests 
through the 311 system are not included unless the officer subsequently radios 
the  request  to  the  dispatcher.  Self‐initiated  jobs  not  resulting  from  a  citizen 
complaint or contact (i.e.: interior building patrol, directed park patrol, etc.) are 
not included.  
Total Crime Complaints Reported‐ Number based on felony, misdemeanor, and 
violation complaint reports recorded in the specific precinct, occurring in 2012, as 
reported through the NYPD complaint reporting system as of January 27th
, 2013. 
This  does  not  include  arrests  where  no  complaint  report  was  generated  or 
complaint  reports  used  to  record  an  event  of  a  non‐criminal  nature  (e.g.  lost 
property). 
Arrests  and  Criminal  Court  Summonses  Issued‐  Number  based  on  all  arrests 
made and all criminal court summonses issued in the specific precinct as reported 
in the 2012 year end Compstat Report. Parking summonses and moving violation 
summonses are excluded. 
Reasonable  Suspicion  Stops‐  NYPD  officers  are  required  to  record  information 
regarding a reasonable suspicion stop on a Stop, Question and Frisk form. This 
information  is  entered  in  to  an  electronic  database,  the  content  of  which  is 
authorized under New York State Criminal Procedure Law section 140.50(4). The 
NYPD is required to report the number of stops within thirty days of the end of 
each calendar quarter to the New York City Council pursuant to 14‐150(5) of the 
New  York  City  Administrative  Code.  Following  the  end  of  each  year,  the 
Department compiles the database entries and produces and posts publically the 
information of the database on the NYPD website. The data in this report is based  
on that dataset. The data is available 
at: http://www.nyc.gov/html/nypd/html/analysis_and_planning/stop_question_a
nd_frisk_report.shtml 
3
0%
10%
20%
30%
40%
50%
60%
70%
Asian/Pac.Isl Black Hispanic White
Residential
Population
All Known Crime
Suspects
Known Violent
Crime Suspects
Persons Stopped
532,911
873,528
497,323
4,107,144
  Reasonable Suspicion Stops
 Arrests and Criminal Court
Summonses Issued
 Total Crime Complaints
Radio Runs
Reasonable Suspicion Stops‐ 2012
Citywide
Total Reasonable Suspicion Stops= 532,911
Top Crime Suspected was WEAPONS POSSESSION, accounting for  24.3%  of all stops.
All Activity
Race Residential Population Known Violent Crime 
Suspects
 Persons StoppedAll Known Crime 
Suspects
Asian/Pac.Isl 17,058/3.3%1,028,046/12.9% 13,797/3.9% 1,306/2.7%
Black 284,229/55.0%1,861,136/23.4% 180,492/50.7% 29,651/61.3%
Hispanic 165,140/32.0%2,335,928/29.4% 112,338/31.6% 14,109/29.2%
White 50,366/9.7%2,722,877/34.3% 49,117/13.8% 3,325/6.9%
4
CPPCPPCPPCPPCPPCPPCPPCPPCPPCPPCPPCPPCPPCPPCPPCPPCPPCPPCPPCPPCPPCPPCPPCPPCPPCPPCPPCPPCPPCPPCPPCPPCPPCPPCPPCPPCPPCPPCPPCPPCPPCPPCPPCPPCPPCPPCPPCPPCPP
25252525252525252525252525252525252525252525252525252525252525252525252525252525252525252525252525
32323232323232323232323232323232323232323232323232323232323232323232323232323232323232323232323232
MTSMTSMTSMTSMTSMTSMTSMTSMTSMTSMTSMTSMTSMTSMTSMTSMTSMTSMTSMTSMTSMTSMTSMTSMTSMTSMTSMTSMTSMTSMTSMTSMTSMTSMTSMTSMTSMTSMTSMTSMTSMTSMTSMTSMTSMTSMTSMTSMTS
MTNMTNMTNMTNMTNMTNMTNMTNMTNMTNMTNMTNMTNMTNMTNMTNMTNMTNMTNMTNMTNMTNMTNMTNMTNMTNMTNMTNMTNMTNMTNMTNMTNMTNMTNMTNMTNMTNMTNMTNMTNMTNMTNMTNMTNMTNMTNMTNMTN
CPPCPPCPPCPPCPPCPPCPPCPPCPPCPPCPPCPPCPPCPPCPPCPPCPPCPPCPPCPPCPPCPPCPPCPPCPPCPPCPPCPPCPPCPPCPPCPPCPPCPPCPPCPPCPPCPPCPPCPPCPPCPPCPPCPPCPPCPPCPPCPPCPP
25252525252525252525252525252525252525252525252525252525252525252525252525252525252525252525252525
32323232323232323232323232323232323232323232323232323232323232323232323232323232323232323232323232
20202020202020202020202020202020202020202020202020202020202020202020202020202020202020202020202020
24242424242424242424242424242424242424242424242424242424242424242424242424242424242424242424242424
19191919191919191919191919191919191919191919191919191919191919191919191919191919191919191919191919
26262626262626262626262626262626262626262626262626262626262626262626262626262626262626262626262626
30303030303030303030303030303030303030303030303030303030303030303030303030303030303030303030303030
28282828282828282828282828282828282828282828282828282828282828282828282828282828282828282828282828
33333333333333333333333333333333333333333333333333333333333333333333333333333333333333333333333333
23232323232323232323232323232323232323232323232323232323232323232323232323232323232323232323232323
34343434343434343434343434343434343434343434343434343434343434343434343434343434343434343434343434
MTSMTSMTSMTSMTSMTSMTSMTSMTSMTSMTSMTSMTSMTSMTSMTSMTSMTSMTSMTSMTSMTSMTSMTSMTSMTSMTSMTSMTSMTSMTSMTSMTSMTSMTSMTSMTSMTSMTSMTSMTSMTSMTSMTSMTSMTSMTSMTSMTS
MTNMTNMTNMTNMTNMTNMTNMTNMTNMTNMTNMTNMTNMTNMTNMTNMTNMTNMTNMTNMTNMTNMTNMTNMTNMTNMTNMTNMTNMTNMTNMTNMTNMTNMTNMTNMTNMTNMTNMTNMTNMTNMTNMTNMTNMTNMTNMTNMTN
1111111111111111111111111111111111111111111111111
5555555555555555555555555555555555555555555555555
9999999999999999999999999999999999999999999999999
6666666666666666666666666666666666666666666666666
7777777777777777777777777777777777777777777777777
13131313131313131313131313131313131313131313131313131313131313131313131313131313131313131313131313
10101010101010101010101010101010101010101010101010101010101010101010101010101010101010101010101010 17171717171717171717171717171717171717171717171717171717171717171717171717171717171717171717171717
Produced by the Office of Manhagement Analysis and Planning - 1-23-13
MANHATTAN PRECINCTSMANHATTAN PRECINCTSMANHATTAN PRECINCTSMANHATTAN PRECINCTSMANHATTAN PRECINCTSMANHATTAN PRECINCTSMANHATTAN PRECINCTSMANHATTAN PRECINCTSMANHATTAN PRECINCTSMANHATTAN PRECINCTSMANHATTAN PRECINCTSMANHATTAN PRECINCTSMANHATTAN PRECINCTSMANHATTAN PRECINCTSMANHATTAN PRECINCTSMANHATTAN PRECINCTSMANHATTAN PRECINCTSMANHATTAN PRECINCTSMANHATTAN PRECINCTSMANHATTAN PRECINCTSMANHATTAN PRECINCTSMANHATTAN PRECINCTSMANHATTAN PRECINCTSMANHATTAN PRECINCTSMANHATTAN PRECINCTSMANHATTAN PRECINCTSMANHATTAN PRECINCTSMANHATTAN PRECINCTSMANHATTAN PRECINCTSMANHATTAN PRECINCTSMANHATTAN PRECINCTSMANHATTAN PRECINCTSMANHATTAN PRECINCTSMANHATTAN PRECINCTSMANHATTAN PRECINCTSMANHATTAN PRECINCTSMANHATTAN PRECINCTSMANHATTAN PRECINCTSMANHATTAN PRECINCTSMANHATTAN PRECINCTSMANHATTAN PRECINCTSMANHATTAN PRECINCTSMANHATTAN PRECINCTSMANHATTAN PRECINCTSMANHATTAN PRECINCTSMANHATTAN PRECINCTSMANHATTAN PRECINCTSMANHATTAN PRECINCTSMANHATTAN PRECINCTS
5
0%
10%
20%
30%
40%
50%
60%
70%
80%
Asian/Pac.Isl Black Hispanic White
Residential
Population
All Known Crime
Suspects
Known Violent
Crime Suspects
Persons Stopped
3,053
8,794
6,172
48,124
  Reasonable Suspicion Stops
 Arrests and Criminal Court
Summonses Issued
 Total Crime Complaints
Radio Runs
Reasonable Suspicion Stops‐ 2012
1st Precinct
Total Reasonable Suspicion Stops= 3,053
Top Crime Suspected was GRAND LARCENY, accounting for  24.5%  of all stops.
All Activity
Race Residential Population Known Violent Crime 
Suspects
 Persons StoppedAll Known Crime 
Suspects
Asian/Pac.Isl 201/6.8%10,520/16.3% 374/9.1% 7/2.7%
Black 1,671/56.1%1,984/3.1% 1,884/45.8% 140/53.4%
Hispanic 522/17.5%4,676/7.3% 702/17.1% 55/21.0%
White 583/19.6%47,231/73.3% 1,155/28.1% 60/22.9%
6
0%
10%
20%
30%
40%
50%
60%
70%
Asian/Pac.Isl Black Hispanic White
Residential
Population
All Known Crime
Suspects
Known Violent
Crime Suspects
Persons Stopped
2,782
10,935
4,573
38,608
  Reasonable Suspicion Stops
 Arrests and Criminal Court
Summonses Issued
 Total Crime Complaints
Radio Runs
Reasonable Suspicion Stops‐ 2012
5th Precinct
Total Reasonable Suspicion Stops= 2,782
Top Crime Suspected was GRAND LARCENY, accounting for  17.0%  of all stops.
All Activity
Race Residential Population Known Violent Crime 
Suspects
 Persons StoppedAll Known Crime 
Suspects
Asian/Pac.Isl 351/13.5%31,866/61.6% 597/17.7% 38/10.8%
Black 1,066/41.0%2,309/4.5% 1,476/43.6% 182/51.9%
Hispanic 729/28.0%6,051/11.7% 824/24.4% 97/27.6%
White 454/17.5%11,490/22.2% 485/14.3% 34/9.7%
7
0%
10%
20%
30%
40%
50%
60%
70%
80%
90%
Asian/Pac.Isl Black Hispanic White
Residential
Population
All Known Crime
Suspects
Known Violent
Crime Suspects
Persons Stopped
3,637
8,396
5,467
36,778
  Reasonable Suspicion Stops
 Arrests and Criminal Court
Summonses Issued
 Total Crime Complaints
Radio Runs
Reasonable Suspicion Stops‐ 2012
6th Precinct
Total Reasonable Suspicion Stops= 3,637
Top Crime Suspected was GRAND LARCENY, accounting for  19.1%  of all stops.
All Activity
Race Residential Population Known Violent Crime 
Suspects
 Persons StoppedAll Known Crime 
Suspects
Asian/Pac.Isl 80/2.3%4,925/8.2% 127/3.8% 4/1.2%
Black 2,171/61.9%1,204/2.0% 1,545/46.7% 188/58.6%
Hispanic 690/19.7%3,736/6.2% 637/19.3% 74/23.1%
White 566/16.1%50,482/83.7% 999/30.2% 55/17.1%
8
0%
10%
20%
30%
40%
50%
60%
Asian/Pac.Isl Black Hispanic White
Residential
Population
All Known Crime
Suspects
Known Violent
Crime Suspects
Persons Stopped
3,501
8,400
4,122
30,060
  Reasonable Suspicion Stops
 Arrests and Criminal Court
Summonses Issued
 Total Crime Complaints
Radio Runs
Reasonable Suspicion Stops‐ 2012
7th Precinct
Total Reasonable Suspicion Stops= 3,501
Top Crime Suspected was WEAPONS POSSESSION, accounting for  20.4%  of all stops.
All Activity
Race Residential Population Known Violent Crime 
Suspects
 Persons StoppedAll Known Crime 
Suspects
Asian/Pac.Isl 98/2.9%20,034/36.3% 164/4.9% 20/5.2%
Black 1,405/41.2%4,566/8.3% 1,234/36.7% 203/52.5%
Hispanic 1,485/43.5%17,835/32.3% 1,352/40.2% 142/36.7%
White 423/12.4%12,728/23.1% 611/18.2% 22/5.7%
9
0%
10%
20%
30%
40%
50%
60%
Asian/Pac.Isl Black Hispanic White
Residential
Population
All Known Crime
Suspects
Known Violent
Crime Suspects
Persons Stopped
5,282
8,987
6,227
48,494
  Reasonable Suspicion Stops
 Arrests and Criminal Court
Summonses Issued
 Total Crime Complaints
Radio Runs
Reasonable Suspicion Stops‐ 2012
9th Precinct
Total Reasonable Suspicion Stops= 5,282
Top Crime Suspected was ROBBERY, accounting for  16.9%  of all stops.
All Activity
Race Residential Population Known Violent Crime 
Suspects
 Persons StoppedAll Known Crime 
Suspects
Asian/Pac.Isl 143/2.8%10,889/14.7% 143/3.4% 9/2.1%
Black 1,824/36.0%5,476/7.4% 1,519/36.6% 196/46.4%
Hispanic 2,031/40.1%18,336/24.7% 1,491/35.9% 163/38.6%
White 1,071/21.1%39,546/53.3% 1,000/24.1% 54/12.8%
10
0%
10%
20%
30%
40%
50%
60%
70%
Asian/Pac.Isl Black Hispanic White
Residential
Population
All Known Crime
Suspects
Known Violent
Crime Suspects
Persons Stopped
2,406
7,172
4,209
37,473
  Reasonable Suspicion Stops
 Arrests and Criminal Court
Summonses Issued
 Total Crime Complaints
Radio Runs
Reasonable Suspicion Stops‐ 2012
10th Precinct
Total Reasonable Suspicion Stops= 2,406
Top Crime Suspected was GRAND LARCENY, accounting for  17.1%  of all stops.
All Activity
Race Residential Population Known Violent Crime 
Suspects
 Persons StoppedAll Known Crime 
Suspects
Asian/Pac.Isl 65/2.8%5,983/12.2% 102/4.0% 6/2.5%
Black 1,305/56.3%3,378/6.9% 1,210/47.4% 152/63.1%
Hispanic 534/23.0%8,714/17.8% 631/24.7% 55/22.8%
White 416/17.9%30,889/63.1% 611/23.9% 28/11.6%
11
0%
10%
20%
30%
40%
50%
60%
70%
80%
Asian/Pac.Isl Black Hispanic White
Residential
Population
All Known Crime
Suspects
Known Violent
Crime Suspects
Persons Stopped
3,830
8,767
7,033
60,098
  Reasonable Suspicion Stops
 Arrests and Criminal Court
Summonses Issued
 Total Crime Complaints
Radio Runs
Reasonable Suspicion Stops‐ 2012
13th Precinct
Total Reasonable Suspicion Stops= 3,830
Top Crime Suspected was GRAND LARCENY, accounting for  20.9%  of all stops.
All Activity
Race Residential Population Known Violent Crime 
Suspects
 Persons StoppedAll Known Crime 
Suspects
Asian/Pac.Isl 102/2.7%12,714/14.0% 171/4.3% 3/0.8%
Black 1,783/47.5%4,129/4.5% 1,822/45.4% 247/63.2%
Hispanic 1,076/28.7%8,573/9.4% 996/24.8% 87/22.3%
White 794/21.1%65,405/72.0% 1,024/25.5% 54/13.8%
12
0%
10%
20%
30%
40%
50%
60%
70%
Asian/Pac.Isl Black Hispanic White
Residential
Population
All Known Crime
Suspects
Known Violent
Crime Suspects
Persons Stopped
8,945
26,488
11,259
74,789
  Reasonable Suspicion Stops
 Arrests and Criminal Court
Summonses Issued
 Total Crime Complaints
Radio Runs
Reasonable Suspicion Stops‐ 2012
Midtown South Precinct (MTS)
Total Reasonable Suspicion Stops= 8,945
Top Crime Suspected was GRAND LARCENY, accounting for  21.4%  of all stops.
All Activity
Race Residential Population Known Violent Crime 
Suspects
 Persons StoppedAll Known Crime 
Suspects
Asian/Pac.Isl 329/3.8%4,187/21.0% 482/5.9% 10/2.2%
Black 4,925/56.7%1,390/7.0% 3,865/47.5% 305/65.6%
Hispanic 1,879/21.6%2,306/11.6% 2,158/26.5% 92/19.8%
White 1,559/17.9%12,037/60.4% 1,639/20.1% 58/12.5%
13
0%
10%
20%
30%
40%
50%
60%
70%
80%
90%
Asian/Pac.Isl Black Hispanic White
Residential
Population
All Known Crime
Suspects
Known Violent
Crime Suspects
Persons Stopped
1,331
6,229
3,178
36,815
  Reasonable Suspicion Stops
 Arrests and Criminal Court
Summonses Issued
 Total Crime Complaints
Radio Runs
Reasonable Suspicion Stops‐ 2012
17th Precinct
Total Reasonable Suspicion Stops= 1,331
Top Crime Suspected was BURGLARY, accounting for  14.7%  of all stops.
All Activity
Race Residential Population Known Violent Crime 
Suspects
 Persons StoppedAll Known Crime 
Suspects
Asian/Pac.Isl 68/5.5%11,201/14.5% 121/6.6% 8/5.1%
Black 503/40.9%1,791/2.3% 656/35.5% 71/44.9%
Hispanic 358/29.1%4,799/6.2% 456/24.7% 31/19.6%
White 302/24.5%59,712/77.0% 614/33.2% 48/30.4%
14
0%
10%
20%
30%
40%
50%
60%
70%
Asian/Pac.Isl Black Hispanic White
Residential
Population
All Known Crime
Suspects
Known Violent
Crime Suspects
Persons Stopped
2,978
10,823
7,816
68,136
  Reasonable Suspicion Stops
 Arrests and Criminal Court
Summonses Issued
 Total Crime Complaints
Radio Runs
Reasonable Suspicion Stops‐ 2012
Midtown North Precinct (MTN)
Total Reasonable Suspicion Stops= 2,978
Top Crime Suspected was GRAND LARCENY, accounting for  35.4%  of all stops.
All Activity
Race Residential Population Known Violent Crime 
Suspects
 Persons StoppedAll Known Crime 
Suspects
Asian/Pac.Isl 80/2.8%8,519/16.2% 245/5.3% 10/3.2%
Black 1,520/52.3%2,648/5.0% 1,877/40.8% 167/52.7%
Hispanic 815/28.0%8,583/16.4% 1,130/24.6% 88/27.8%
White 493/17.0%32,743/62.4% 1,345/29.3% 52/16.4%
15
0%
10%
20%
30%
40%
50%
60%
70%
80%
90%
Asian/Pac.Isl Black Hispanic White
Residential
Population
All Known Crime
Suspects
Known Violent
Crime Suspects
Persons Stopped
4,652
11,658
6,295
68,995
  Reasonable Suspicion Stops
 Arrests and Criminal Court
Summonses Issued
 Total Crime Complaints
Radio Runs
Reasonable Suspicion Stops‐ 2012
19th Precinct
Total Reasonable Suspicion Stops= 4,652
Top Crime Suspected was GRAND LARCENY, accounting for  28.0%  of all stops.
All Activity
Race Residential Population Known Violent Crime 
Suspects
 Persons StoppedAll Known Crime 
Suspects
Asian/Pac.Isl 187/4.2%16,727/8.2% 132/3.7% 9/3.2%
Black 1,665/37.0%4,817/2.4% 1,560/43.6% 139/49.1%
Hispanic 1,653/36.7%13,827/6.8% 827/23.1% 64/22.6%
White 997/22.1%168,711/82.7% 1,062/29.7% 71/25.1%
16
0%
10%
20%
30%
40%
50%
60%
70%
80%
90%
Asian/Pac.Isl Black Hispanic White
Residential
Population
All Known Crime
Suspects
Known Violent
Crime Suspects
Persons Stopped
3,266
5,318
4,031
32,923
  Reasonable Suspicion Stops
 Arrests and Criminal Court
Summonses Issued
 Total Crime Complaints
Radio Runs
Reasonable Suspicion Stops‐ 2012
20th Precinct
Total Reasonable Suspicion Stops= 3,266
Top Crime Suspected was GRAND LARCENY, accounting for  19.0%  of all stops.
All Activity
Race Residential Population Known Violent Crime 
Suspects
 Persons StoppedAll Known Crime 
Suspects
Asian/Pac.Isl 164/5.1%9,029/9.0% 76/3.6% 3/1.7%
Black 1,322/41.3%3,902/3.9% 796/38.1% 82/47.7%
Hispanic 935/29.2%8,662/8.6% 580/27.8% 60/34.9%
White 779/24.3%78,749/78.5% 638/30.5% 27/15.7%
17
0%
10%
20%
30%
40%
50%
60%
Asian/Pac.Isl Black Hispanic White
Residential
Population
All Known Crime
Suspects
Known Violent
Crime Suspects
Persons Stopped
592
6,855
523
3,901
  Reasonable Suspicion Stops
 Arrests and Criminal Court
Summonses Issued
 Total Crime Complaints
Radio Runs
Reasonable Suspicion Stops‐ 2012
Central Park Precinct (CPP)
Total Reasonable Suspicion Stops= 592
Top Crime Suspected was MARIJUANA POSSESSION, accounting for  29.1%  of all stops.
All Activity
Race Residential Population Known Violent Crime 
Suspects
 Persons StoppedAll Known Crime 
Suspects
Asian/Pac.Isl 28/4.8%0/0.0% 19/4.8% 0/0.0%
Black 258/44.1%0/0.0% 143/36.2% 16/50.0%
Hispanic 185/31.6%0/0.0% 101/25.6% 11/34.4%
White 114/19.5%0/0.0% 132/33.4% 5/15.6%
18
0%
10%
20%
30%
40%
50%
60%
70%
Asian/Pac.Isl Black Hispanic White
Residential
Population
All Known Crime
Suspects
Known Violent
Crime Suspects
Persons Stopped
11,095
12,974
6,206
44,286
  Reasonable Suspicion Stops
 Arrests and Criminal Court
Summonses Issued
 Total Crime Complaints
Radio Runs
Reasonable Suspicion Stops‐ 2012
23rd Precinct
Total Reasonable Suspicion Stops= 11,095
Top Crime Suspected was WEAPONS POSSESSION, accounting for  36.4%  of all stops.
All Activity
Race Residential Population Known Violent Crime 
Suspects
 Persons StoppedAll Known Crime 
Suspects
Asian/Pac.Isl 130/1.2%5,360/7.5% 42/0.8% 6/0.9%
Black 6,861/63.3%18,191/25.5% 2,673/50.7% 386/57.4%
Hispanic 3,601/33.2%36,740/51.5% 2,330/44.2% 271/40.3%
White 242/2.2%11,050/15.5% 229/4.3% 9/1.3%
19
0%
10%
20%
30%
40%
50%
60%
70%
Asian/Pac.Isl Black Hispanic White
Residential
Population
All Known Crime
Suspects
Known Violent
Crime Suspects
Persons Stopped
4,218
7,185
4,778
38,497
  Reasonable Suspicion Stops
 Arrests and Criminal Court
Summonses Issued
 Total Crime Complaints
Radio Runs
Reasonable Suspicion Stops‐ 2012
24th Precinct
Total Reasonable Suspicion Stops= 4,218
Top Crime Suspected was ROBBERY, accounting for  15.4%  of all stops.
All Activity
Race Residential Population Known Violent Crime 
Suspects
 Persons StoppedAll Known Crime 
Suspects
Asian/Pac.Isl 89/2.1%6,975/6.7% 47/1.5% 3/0.7%
Black 2,069/49.9%11,979/11.6% 1,545/48.3% 237/56.3%
Hispanic 1,529/36.9%22,738/21.9% 1,085/33.9% 140/33.3%
White 459/11.1%61,970/59.8% 524/16.4% 41/9.7%
20
0%
10%
20%
30%
40%
50%
60%
70%
80%
Asian/Pac.Isl Black Hispanic White
Residential
Population
All Known Crime
Suspects
Known Violent
Crime Suspects
Persons Stopped
6,373
16,650
6,651
48,708
  Reasonable Suspicion Stops
 Arrests and Criminal Court
Summonses Issued
 Total Crime Complaints
Radio Runs
Reasonable Suspicion Stops‐ 2012
25th Precinct
Total Reasonable Suspicion Stops= 6,373
Top Crime Suspected was WEAPONS POSSESSION, accounting for  30.0%  of all stops.
All Activity
Race Residential Population Known Violent Crime 
Suspects
 Persons StoppedAll Known Crime 
Suspects
Asian/Pac.Isl 53/0.9%1,294/2.8% 42/0.8% 1/0.2%
Black 4,216/68.6%19,399/41.6% 3,411/61.5% 449/71.0%
Hispanic 1,673/27.2%22,550/48.4% 1,806/32.5% 169/26.7%
White 206/3.4%3,392/7.3% 290/5.2% 13/2.1%
21
0%
10%
20%
30%
40%
50%
60%
70%
80%
Asian/Pac.Isl Black Hispanic White
Residential
Population
All Known Crime
Suspects
Known Violent
Crime Suspects
Persons Stopped
5,488
7,632
3,501
24,749
  Reasonable Suspicion Stops
 Arrests and Criminal Court
Summonses Issued
 Total Crime Complaints
Radio Runs
Reasonable Suspicion Stops‐ 2012
26th Precinct
Total Reasonable Suspicion Stops= 5,488
Top Crime Suspected was WEAPONS POSSESSION, accounting for  26.2%  of all stops.
All Activity
Race Residential Population Known Violent Crime 
Suspects
 Persons StoppedAll Known Crime 
Suspects
Asian/Pac.Isl 56/1.1%6,174/12.9% 39/1.4% 3/0.9%
Black 3,718/70.4%10,006/20.9% 1,671/61.8% 220/69.4%
Hispanic 1,289/24.4%12,428/26.0% 803/29.7% 83/26.2%
White 216/4.1%19,198/40.2% 192/7.1% 11/3.5%
22
0%
10%
20%
30%
40%
50%
60%
70%
80%
90%
Asian/Pac.Isl Black Hispanic White
Residential
Population
All Known Crime
Suspects
Known Violent
Crime Suspects
Persons Stopped
6,707
11,748
5,083
39,884
  Reasonable Suspicion Stops
 Arrests and Criminal Court
Summonses Issued
 Total Crime Complaints
Radio Runs
Reasonable Suspicion Stops‐ 2012
28th Precinct
Total Reasonable Suspicion Stops= 6,707
Top Crime Suspected was WEAPONS POSSESSION, accounting for  24.9%  of all stops.
All Activity
Race Residential Population Known Violent Crime 
Suspects
 Persons StoppedAll Known Crime 
Suspects
Asian/Pac.Isl 54/0.8%1,542/3.6% 32/0.7% 2/0.3%
Black 5,308/80.1%25,150/58.3% 3,411/79.4% 472/82.2%
Hispanic 1,055/15.9%9,421/21.8% 706/16.4% 89/15.5%
White 211/3.2%7,060/16.4% 145/3.4% 11/1.9%
23
0%
10%
20%
30%
40%
50%
60%
70%
Asian/Pac.Isl Black Hispanic White
Residential
Population
All Known Crime
Suspects
Known Violent
Crime Suspects
Persons Stopped
6,169
9,712
4,926
32,632
  Reasonable Suspicion Stops
 Arrests and Criminal Court
Summonses Issued
 Total Crime Complaints
Radio Runs
Reasonable Suspicion Stops‐ 2012
30th Precinct
Total Reasonable Suspicion Stops= 6,169
Top Crime Suspected was ROBBERY, accounting for  22.1%  of all stops.
All Activity
Race Residential Population Known Violent Crime 
Suspects
 Persons StoppedAll Known Crime 
Suspects
Asian/Pac.Isl 79/1.3%1,358/2.3% 50/1.2% 1/0.2%
Black 2,759/46.3%17,103/28.8% 2,124/49.2% 338/56.6%
Hispanic 2,960/49.6%34,674/58.5% 1,967/45.5% 250/41.9%
White 164/2.8%6,187/10.4% 179/4.1% 8/1.3%
24
0%
10%
20%
30%
40%
50%
60%
70%
80%
90%
100%
Asian/Pac.Isl Black Hispanic White
Residential
Population
All Known Crime
Suspects
Known Violent
Crime Suspects
Persons Stopped
10,764
14,242
6,596
51,896
  Reasonable Suspicion Stops
 Arrests and Criminal Court
Summonses Issued
 Total Crime Complaints
Radio Runs
Reasonable Suspicion Stops‐ 2012
32nd Precinct
Total Reasonable Suspicion Stops= 10,764
Top Crime Suspected was WEAPONS POSSESSION, accounting for  38.8%  of all stops.
All Activity
Race Residential Population Known Violent Crime 
Suspects
 Persons StoppedAll Known Crime 
Suspects
Asian/Pac.Isl 60/0.6%1,245/1.8% 31/0.6% 3/0.5%
Black 9,113/86.9%47,708/68.9% 4,619/83.2% 545/84.9%
Hispanic 1,143/10.9%16,271/23.5% 775/14.0% 89/13.9%
White 172/1.6%3,990/5.8% 126/2.3% 5/0.8%
25
0%
10%
20%
30%
40%
50%
60%
70%
80%
Asian/Pac.Isl Black Hispanic White
Residential
Population
All Known Crime
Suspects
Known Violent
Crime Suspects
Persons Stopped
3,620
13,196
4,037
40,312
  Reasonable Suspicion Stops
 Arrests and Criminal Court
Summonses Issued
 Total Crime Complaints
Radio Runs
Reasonable Suspicion Stops‐ 2012
33rd Precinct
Total Reasonable Suspicion Stops= 3,620
Top Crime Suspected was WEAPONS POSSESSION, accounting for  30.0%  of all stops.
All Activity
Race Residential Population Known Violent Crime 
Suspects
 Persons StoppedAll Known Crime 
Suspects
Asian/Pac.Isl 23/0.7%2,154/2.8% 27/1.0% 0/0.0%
Black 794/22.7%8,592/11.3% 673/23.8% 95/20.7%
Hispanic 2,519/72.0%57,057/75.2% 1,958/69.2% 347/75.6%
White 161/4.6%8,073/10.6% 173/6.1% 17/3.7%
26
0%
10%
20%
30%
40%
50%
60%
70%
80%
90%
Asian/Pac.Isl Black Hispanic White
Residential
Population
All Known Crime
Suspects
Known Violent
Crime Suspects
Persons Stopped
9,675
19,832
5,161
52,758
  Reasonable Suspicion Stops
 Arrests and Criminal Court
Summonses Issued
 Total Crime Complaints
Radio Runs
Reasonable Suspicion Stops‐ 2012
34th Precinct
Total Reasonable Suspicion Stops= 9,675
Top Crime Suspected was WEAPONS POSSESSION, accounting for  23.7%  of all stops.
All Activity
Race Residential Population Known Violent Crime 
Suspects
 Persons StoppedAll Known Crime 
Suspects
Asian/Pac.Isl 48/0.5%2,640/2.4% 24/0.7% 0/0.0%
Black 871/9.8%5,362/4.8% 530/14.7% 84/15.6%
Hispanic 7,615/85.4%77,919/70.0% 2,832/78.7% 441/81.7%
White 384/4.3%25,369/22.8% 211/5.9% 15/2.8%
27
52525252525252525252525252525252525252525252525252525252525252525252525252525252525252525252525252
47474747474747474747474747474747474747474747474747474747474747474747474747474747474747474747474747
52525252525252525252525252525252525252525252525252525252525252525252525252525252525252525252525252
47474747474747474747474747474747474747474747474747474747474747474747474747474747474747474747474747
40404040404040404040404040404040404040404040404040404040404040404040404040404040404040404040404040
41414141414141414141414141414141414141414141414141414141414141414141414141414141414141414141414141
4242424242424242424242424242424242424242424242424242424242424242424242424242424242424242424242424244444444444444444444444444444444444444444444444444444444444444444444444444444444444444444444444444
46464646464646464646464646464646464646464646464646464646464646464646464646464646464646464646464646
48484848484848484848484848484848484848484848484848484848484848484848484848484848484848484848484848
50505050505050505050505050505050505050505050505050505050505050505050505050505050505050505050505050
43434343434343434343434343434343434343434343434343434343434343434343434343434343434343434343434343
49494949494949494949494949494949494949494949494949494949494949494949494949494949494949494949494949
45454545454545454545454545454545454545454545454545454545454545454545454545454545454545454545454545
52525252525252525252525252525252525252525252525252525252525252525252525252525252525252525252525252
47474747474747474747474747474747474747474747474747474747474747474747474747474747474747474747474747
52525252525252525252525252525252525252525252525252525252525252525252525252525252525252525252525252
47474747474747474747474747474747474747474747474747474747474747474747474747474747474747474747474747
40404040404040404040404040404040404040404040404040404040404040404040404040404040404040404040404040
41414141414141414141414141414141414141414141414141414141414141414141414141414141414141414141414141
4242424242424242424242424242424242424242424242424242424242424242424242424242424242424242424242424244444444444444444444444444444444444444444444444444444444444444444444444444444444444444444444444444
46464646464646464646464646464646464646464646464646464646464646464646464646464646464646464646464646
48484848484848484848484848484848484848484848484848484848484848484848484848484848484848484848484848
50505050505050505050505050505050505050505050505050505050505050505050505050505050505050505050505050
43434343434343434343434343434343434343434343434343434343434343434343434343434343434343434343434343
49494949494949494949494949494949494949494949494949494949494949494949494949494949494949494949494949
45454545454545454545454545454545454545454545454545454545454545454545454545454545454545454545454545
Produced by the Office of Manhagement Analysis and Planning - 1-23-13
BRONX PRECINCTSBRONX PRECINCTSBRONX PRECINCTSBRONX PRECINCTSBRONX PRECINCTSBRONX PRECINCTSBRONX PRECINCTSBRONX PRECINCTSBRONX PRECINCTSBRONX PRECINCTSBRONX PRECINCTSBRONX PRECINCTSBRONX PRECINCTSBRONX PRECINCTSBRONX PRECINCTSBRONX PRECINCTSBRONX PRECINCTSBRONX PRECINCTSBRONX PRECINCTSBRONX PRECINCTSBRONX PRECINCTSBRONX PRECINCTSBRONX PRECINCTSBRONX PRECINCTSBRONX PRECINCTSBRONX PRECINCTSBRONX PRECINCTSBRONX PRECINCTSBRONX PRECINCTSBRONX PRECINCTSBRONX PRECINCTSBRONX PRECINCTSBRONX PRECINCTSBRONX PRECINCTSBRONX PRECINCTSBRONX PRECINCTSBRONX PRECINCTSBRONX PRECINCTSBRONX PRECINCTSBRONX PRECINCTSBRONX PRECINCTSBRONX PRECINCTSBRONX PRECINCTSBRONX PRECINCTSBRONX PRECINCTSBRONX PRECINCTSBRONX PRECINCTSBRONX PRECINCTSBRONX PRECINCTS
28
0%
10%
20%
30%
40%
50%
60%
70%
80%
Asian/Pac.Isl Black Hispanic White
Residential
Population
All Known Crime
Suspects
Known Violent
Crime Suspects
Persons Stopped
18,276
31,508
11,696
86,913
  Reasonable Suspicion Stops
 Arrests and Criminal Court
Summonses Issued
 Total Crime Complaints
Radio Runs
Reasonable Suspicion Stops‐ 2012
40th Precinct
Total Reasonable Suspicion Stops= 18,276
Top Crime Suspected was WEAPONS POSSESSION, accounting for  50.9%  of all stops.
All Activity
Race Residential Population Known Violent Crime 
Suspects
 Persons StoppedAll Known Crime 
Suspects
Asian/Pac.Isl 80/0.4%528/0.6% 36/0.4% 1/0.1%
Black 9,284/51.7%23,701/26.2% 4,265/46.3% 530/56.4%
Hispanic 8,384/46.7%64,882/71.7% 4,746/51.5% 402/42.8%
White 220/1.2%1,438/1.6% 162/1.8% 7/0.7%
29
0%
10%
20%
30%
40%
50%
60%
70%
80%
Asian/Pac.Isl Black Hispanic White
Residential
Population
All Known Crime
Suspects
Known Violent
Crime Suspects
Persons Stopped
8,611
17,066
6,906
43,866
  Reasonable Suspicion Stops
 Arrests and Criminal Court
Summonses Issued
 Total Crime Complaints
Radio Runs
Reasonable Suspicion Stops‐ 2012
41st Precinct
Total Reasonable Suspicion Stops= 8,611
Top Crime Suspected was WEAPONS POSSESSION, accounting for  33.4%  of all stops.
All Activity
Race Residential Population Known Violent Crime 
Suspects
 Persons StoppedAll Known Crime 
Suspects
Asian/Pac.Isl 73/0.9%312/0.6% 29/0.5% 3/0.3%
Black 3,590/44.0%11,606/22.5% 2,722/45.2% 583/55.6%
Hispanic 4,330/53.0%39,032/75.6% 3,098/51.5% 447/42.6%
White 173/2.1%697/1.3% 170/2.8% 16/1.5%
30
0%
10%
20%
30%
40%
50%
60%
70%
80%
Asian/Pac.Isl Black Hispanic White
Residential
Population
All Known Crime
Suspects
Known Violent
Crime Suspects
Persons Stopped
7,761
14,082
7,530
60,887
  Reasonable Suspicion Stops
 Arrests and Criminal Court
Summonses Issued
 Total Crime Complaints
Radio Runs
Reasonable Suspicion Stops‐ 2012
42nd Precinct
Total Reasonable Suspicion Stops= 7,761
Top Crime Suspected was WEAPONS POSSESSION, accounting for  51.7%  of all stops.
All Activity
Race Residential Population Known Violent Crime 
Suspects
 Persons StoppedAll Known Crime 
Suspects
Asian/Pac.Isl 43/0.6%375/0.5% 15/0.2% 4/0.5%
Black 4,828/64.1%31,125/39.6% 3,576/58.3% 531/71.3%
Hispanic 2,580/34.3%46,159/58.8% 2,464/40.2% 206/27.7%
White 77/1.0%902/1.1% 81/1.3% 4/0.5%
31
0%
10%
20%
30%
40%
50%
60%
70%
Asian/Pac.Isl Black Hispanic White
Residential
Population
All Known Crime
Suspects
Known Violent
Crime Suspects
Persons Stopped
10,655
18,802
13,105
91,042
  Reasonable Suspicion Stops
 Arrests and Criminal Court
Summonses Issued
 Total Crime Complaints
Radio Runs
Reasonable Suspicion Stops‐ 2012
43rd Precinct
Total Reasonable Suspicion Stops= 10,655
Top Crime Suspected was WEAPONS POSSESSION, accounting for  39.8%  of all stops.
All Activity
Race Residential Population Known Violent Crime 
Suspects
 Persons StoppedAll Known Crime 
Suspects
Asian/Pac.Isl 112/1.1%9,909/5.9% 149/1.4% 5/0.4%
Black 5,114/49.8%53,052/31.8% 4,698/45.6% 767/57.6%
Hispanic 4,822/46.9%99,234/59.4% 5,163/50.1% 540/40.6%
White 225/2.2%4,764/2.9% 292/2.8% 19/1.4%
32
0%
10%
20%
30%
40%
50%
60%
70%
Asian/Pac.Isl Black Hispanic White
Residential
Population
All Known Crime
Suspects
Known Violent
Crime Suspects
Persons Stopped
15,414
23,763
12,713
89,733
  Reasonable Suspicion Stops
 Arrests and Criminal Court
Summonses Issued
 Total Crime Complaints
Radio Runs
Reasonable Suspicion Stops‐ 2012
44th Precinct
Total Reasonable Suspicion Stops= 15,414
Top Crime Suspected was WEAPONS POSSESSION, accounting for  44.3%  of all stops.
All Activity
Race Residential Population Known Violent Crime 
Suspects
 Persons StoppedAll Known Crime 
Suspects
Asian/Pac.Isl 96/0.6%2,231/1.5% 45/0.4% 3/0.2%
Black 7,525/50.9%47,850/33.0% 5,163/45.4% 657/48.9%
Hispanic 6,921/46.8%92,916/64.0% 5,874/51.6% 662/49.3%
White 237/1.6%2,194/1.5% 300/2.6% 22/1.6%
33
0%
5%
10%
15%
20%
25%
30%
35%
40%
45%
50%
Asian/Pac.Isl Black Hispanic White
Residential
Population
All Known Crime
Suspects
Known Violent
Crime Suspects
Persons Stopped
3,995
8,762
5,729
51,253
  Reasonable Suspicion Stops
 Arrests and Criminal Court
Summonses Issued
 Total Crime Complaints
Radio Runs
Reasonable Suspicion Stops‐ 2012
45th Precinct
Total Reasonable Suspicion Stops= 3,995
Top Crime Suspected was ROBBERY, accounting for  26.3%  of all stops.
All Activity
Race Residential Population Known Violent Crime 
Suspects
 Persons StoppedAll Known Crime 
Suspects
Asian/Pac.Isl 67/1.7%5,457/4.6% 60/1.6% 4/0.8%
Black 1,505/39.2%26,986/22.8% 1,350/36.5% 209/43.5%
Hispanic 1,511/39.4%44,143/37.4% 1,490/40.3% 178/37.0%
White 752/19.6%41,557/35.2% 794/21.5% 90/18.7%
34
0%
10%
20%
30%
40%
50%
60%
70%
80%
Asian/Pac.Isl Black Hispanic White
Residential
Population
All Known Crime
Suspects
Known Violent
Crime Suspects
Persons Stopped
5,628
17,768
9,651
81,445
  Reasonable Suspicion Stops
 Arrests and Criminal Court
Summonses Issued
 Total Crime Complaints
Radio Runs
Reasonable Suspicion Stops‐ 2012
46th Precinct
Total Reasonable Suspicion Stops= 5,628
Top Crime Suspected was WEAPONS POSSESSION, accounting for  60.3%  of all stops.
All Activity
Race Residential Population Known Violent Crime 
Suspects
 Persons StoppedAll Known Crime 
Suspects
Asian/Pac.Isl 35/0.6%1,927/1.5% 53/0.6% 2/0.2%
Black 2,461/44.2%36,108/28.8% 3,624/43.9% 536/53.7%
Hispanic 3,006/54.0%85,280/68.1% 4,380/53.0% 455/45.6%
White 64/1.1%1,844/1.5% 204/2.5% 5/0.5%
35
0%
10%
20%
30%
40%
50%
60%
70%
80%
90%
Asian/Pac.Isl Black Hispanic White
Residential
Population
All Known Crime
Suspects
Known Violent
Crime Suspects
Persons Stopped
8,948
14,926
9,079
81,564
  Reasonable Suspicion Stops
 Arrests and Criminal Court
Summonses Issued
 Total Crime Complaints
Radio Runs
Reasonable Suspicion Stops‐ 2012
47th Precinct
Total Reasonable Suspicion Stops= 8,948
Top Crime Suspected was WEAPONS POSSESSION, accounting for  41.3%  of all stops.
All Activity
Race Residential Population Known Violent Crime 
Suspects
 Persons StoppedAll Known Crime 
Suspects
Asian/Pac.Isl 86/1.0%2,868/1.9% 56/0.8% 3/0.3%
Black 6,647/76.5%98,349/66.7% 5,232/74.6% 931/82.5%
Hispanic 1,754/20.2%35,313/24.0% 1,473/21.0% 178/15.8%
White 204/2.3%10,860/7.4% 248/3.5% 17/1.5%
36
0%
10%
20%
30%
40%
50%
60%
70%
Asian/Pac.Isl Black Hispanic White
Residential
Population
All Known Crime
Suspects
Known Violent
Crime Suspects
Persons Stopped
5,430
13,413
7,801
65,897
  Reasonable Suspicion Stops
 Arrests and Criminal Court
Summonses Issued
 Total Crime Complaints
Radio Runs
Reasonable Suspicion Stops‐ 2012
48th Precinct
Total Reasonable Suspicion Stops= 5,430
Top Crime Suspected was WEAPONS POSSESSION, accounting for  45.0%  of all stops.
All Activity
Race Residential Population Known Violent Crime 
Suspects
 Persons StoppedAll Known Crime 
Suspects
Asian/Pac.Isl 39/0.8%890/1.1% 41/0.6% 1/0.1%
Black 2,295/45.4%21,995/26.8% 2,792/44.0% 541/51.4%
Hispanic 2,524/49.9%53,383/65.1% 3,283/51.7% 481/45.7%
White 197/3.9%5,787/7.1% 235/3.7% 30/2.8%
37
0%
10%
20%
30%
40%
50%
60%
Asian/Pac.Isl Black Hispanic White
Residential
Population
All Known Crime
Suspects
Known Violent
Crime Suspects
Persons Stopped
5,778
7,599
6,542
54,727
  Reasonable Suspicion Stops
 Arrests and Criminal Court
Summonses Issued
 Total Crime Complaints
Radio Runs
Reasonable Suspicion Stops‐ 2012
49th Precinct
Total Reasonable Suspicion Stops= 5,778
Top Crime Suspected was WEAPONS POSSESSION, accounting for  36.7%  of all stops.
All Activity
Race Residential Population Known Violent Crime 
Suspects
 Persons StoppedAll Known Crime 
Suspects
Asian/Pac.Isl 94/1.7%8,705/7.7% 90/2.0% 6/0.9%
Black 2,682/48.1%24,073/21.4% 1,934/43.9% 375/53.3%
Hispanic 2,054/36.9%48,342/43.0% 1,823/41.4% 263/37.4%
White 741/13.3%31,257/27.8% 560/12.7% 60/8.5%
38
0%
10%
20%
30%
40%
50%
60%
70%
Asian/Pac.Isl Black Hispanic White
Residential
Population
All Known Crime
Suspects
Known Violent
Crime Suspects
Persons Stopped
1,832
4,632
4,304
35,845
  Reasonable Suspicion Stops
 Arrests and Criminal Court
Summonses Issued
 Total Crime Complaints
Radio Runs
Reasonable Suspicion Stops‐ 2012
50th Precinct
Total Reasonable Suspicion Stops= 1,832
Top Crime Suspected was WEAPONS POSSESSION, accounting for  19.5%  of all stops.
All Activity
Race Residential Population Known Violent Crime 
Suspects
 Persons StoppedAll Known Crime 
Suspects
Asian/Pac.Isl 32/1.8%4,980/5.0% 39/1.5% 0/0.0%
Black 527/29.6%11,656/11.7% 730/28.4% 153/42.4%
Hispanic 1,031/58.0%44,040/44.2% 1,417/55.2% 180/49.9%
White 188/10.6%39,069/39.2% 382/14.9% 28/7.8%
39
0%
10%
20%
30%
40%
50%
60%
70%
Asian/Pac.Isl Black Hispanic White
Residential
Population
All Known Crime
Suspects
Known Violent
Crime Suspects
Persons Stopped
9,811
25,831
10,605
80,574
  Reasonable Suspicion Stops
 Arrests and Criminal Court
Summonses Issued
 Total Crime Complaints
Radio Runs
Reasonable Suspicion Stops‐ 2012
52nd Precinct
Total Reasonable Suspicion Stops= 9,811
Top Crime Suspected was WEAPONS POSSESSION, accounting for  43.4%  of all stops.
All Activity
Race Residential Population Known Violent Crime 
Suspects
 Persons StoppedAll Known Crime 
Suspects
Asian/Pac.Isl 82/0.9%9,215/6.8% 93/1.2% 2/0.2%
Black 3,098/32.8%25,808/18.9% 2,797/34.8% 457/43.8%
Hispanic 5,989/63.4%90,755/66.6% 4,685/58.3% 555/53.2%
White 271/2.9%10,518/7.7% 458/5.7% 29/2.8%
40
90909090909090909090909090909090909090909090909090909090909090909090909090909090909090909090909090
94949494949494949494949494949494949494949494949494949494949494949494949494949494949494949494949494
84848484848484848484848484848484848484848484848484848484848484848484848484848484848484848484848484 88888888888888888888888888888888888888888888888888888888888888888888888888888888888888888888888888
79797979797979797979797979797979797979797979797979797979797979797979797979797979797979797979797979 81818181818181818181818181818181818181818181818181818181818181818181818181818181818181818181818181
83838383838383838383838383838383838383838383838383838383838383838383838383838383838383838383838383
75757575757575757575757575757575757575757575757575757575757575757575757575757575757575757575757575
77777777777777777777777777777777777777777777777777777777777777777777777777777777777777777777777777
73737373737373737373737373737373737373737373737373737373737373737373737373737373737373737373737373
76767676767676767676767676767676767676767676767676767676767676767676767676767676767676767676767676
78787878787878787878787878787878787878787878787878787878787878787878787878787878787878787878787878
72727272727272727272727272727272727272727272727272727272727272727272727272727272727272727272727272
71717171717171717171717171717171717171717171717171717171717171717171717171717171717171717171717171
68686868686868686868686868686868686868686868686868686868686868686868686868686868686868686868686868
62626262626262626262626262626262626262626262626262626262626262626262626262626262626262626262626262
66666666666666666666666666666666666666666666666666666666666666666666666666666666666666666666666666
60606060606060606060606060606060606060606060606060606060606060606060606060606060606060606060606060
70707070707070707070707070707070707070707070707070707070707070707070707070707070707070707070707070
67676767676767676767676767676767676767676767676767676767676767676767676767676767676767676767676767
61616161616161616161616161616161616161616161616161616161616161616161616161616161616161616161616161
63636363636363636363636363636363636363636363636363636363636363636363636363636363636363636363636363
69696969696969696969696969696969696969696969696969696969696969696969696969696969696969696969696969
Produced by the Office of Manhagement Analysis and Planning - 1-23-13
BROOKLYN PRECINCTSBROOKLYN PRECINCTSBROOKLYN PRECINCTSBROOKLYN PRECINCTSBROOKLYN PRECINCTSBROOKLYN PRECINCTSBROOKLYN PRECINCTSBROOKLYN PRECINCTSBROOKLYN PRECINCTSBROOKLYN PRECINCTSBROOKLYN PRECINCTSBROOKLYN PRECINCTSBROOKLYN PRECINCTSBROOKLYN PRECINCTSBROOKLYN PRECINCTSBROOKLYN PRECINCTSBROOKLYN PRECINCTSBROOKLYN PRECINCTSBROOKLYN PRECINCTSBROOKLYN PRECINCTSBROOKLYN PRECINCTSBROOKLYN PRECINCTSBROOKLYN PRECINCTSBROOKLYN PRECINCTSBROOKLYN PRECINCTSBROOKLYN PRECINCTSBROOKLYN PRECINCTSBROOKLYN PRECINCTSBROOKLYN PRECINCTSBROOKLYN PRECINCTSBROOKLYN PRECINCTSBROOKLYN PRECINCTSBROOKLYN PRECINCTSBROOKLYN PRECINCTSBROOKLYN PRECINCTSBROOKLYN PRECINCTSBROOKLYN PRECINCTSBROOKLYN PRECINCTSBROOKLYN PRECINCTSBROOKLYN PRECINCTSBROOKLYN PRECINCTSBROOKLYN PRECINCTSBROOKLYN PRECINCTSBROOKLYN PRECINCTSBROOKLYN PRECINCTSBROOKLYN PRECINCTSBROOKLYN PRECINCTSBROOKLYN PRECINCTSBROOKLYN PRECINCTS
41
0%
10%
20%
30%
40%
50%
60%
70%
Asian/Pac.Isl Black Hispanic White
Residential
Population
All Known Crime
Suspects
Known Violent
Crime Suspects
Persons Stopped
7,785
10,007
6,195
52,011
  Reasonable Suspicion Stops
 Arrests and Criminal Court
Summonses Issued
 Total Crime Complaints
Radio Runs
Reasonable Suspicion Stops‐ 2012
60th Precinct
Total Reasonable Suspicion Stops= 7,785
Top Crime Suspected was WEAPONS POSSESSION, accounting for  22.4%  of all stops.
All Activity
Race Residential Population Known Violent Crime 
Suspects
 Persons StoppedAll Known Crime 
Suspects
Asian/Pac.Isl 172/2.3%12,027/11.7% 107/2.5% 14/2.0%
Black 3,633/48.3%13,396/13.1% 2,032/48.4% 446/64.9%
Hispanic 1,882/25.0%17,294/16.9% 847/20.2% 123/17.9%
White 1,839/24.4%59,839/58.3% 1,215/28.9% 104/15.1%
42
0%
10%
20%
30%
40%
50%
60%
70%
80%
Asian/Pac.Isl Black Hispanic White
Residential
Population
All Known Crime
Suspects
Known Violent
Crime Suspects
Persons Stopped
6,690
8,253
6,161
63,689
  Reasonable Suspicion Stops
 Arrests and Criminal Court
Summonses Issued
 Total Crime Complaints
Radio Runs
Reasonable Suspicion Stops‐ 2012
61st Precinct
Total Reasonable Suspicion Stops= 6,690
Top Crime Suspected was ROBBERY, accounting for  32.2%  of all stops.
All Activity
Race Residential Population Known Violent Crime 
Suspects
 Persons StoppedAll Known Crime 
Suspects
Asian/Pac.Isl 271/4.1%24,370/15.5% 137/3.4% 11/2.0%
Black 1,734/26.1%5,301/3.4% 1,097/27.3% 240/43.7%
Hispanic 1,234/18.5%13,048/8.3% 585/14.6% 103/18.8%
White 3,417/51.3%114,291/72.8% 2,197/54.7% 195/35.5%
43
0%
10%
20%
30%
40%
50%
60%
Asian/Pac.Isl Black Hispanic White
Residential
Population
All Known Crime
Suspects
Known Violent
Crime Suspects
Persons Stopped
4,471
6,070
5,628
47,211
  Reasonable Suspicion Stops
 Arrests and Criminal Court
Summonses Issued
 Total Crime Complaints
Radio Runs
Reasonable Suspicion Stops‐ 2012
62nd Precinct
Total Reasonable Suspicion Stops= 4,471
Top Crime Suspected was ROBBERY, accounting for  35.0%  of all stops.
All Activity
Race Residential Population Known Violent Crime 
Suspects
 Persons StoppedAll Known Crime 
Suspects
Asian/Pac.Isl 452/10.3%62,662/35.0% 255/7.7% 23/4.8%
Black 386/8.8%1,357/0.8% 388/11.6% 126/26.5%
Hispanic 1,338/30.4%24,189/13.5% 885/26.6% 125/26.3%
White 2,225/50.6%90,917/50.8% 1,805/54.2% 202/42.4%
44
0%
10%
20%
30%
40%
50%
60%
70%
80%
90%
100%
Asian/Pac.Isl Black Hispanic White
Residential
Population
All Known Crime
Suspects
Known Violent
Crime Suspects
Persons Stopped
3,663
4,898
5,176
44,893
  Reasonable Suspicion Stops
 Arrests and Criminal Court
Summonses Issued
 Total Crime Complaints
Radio Runs
Reasonable Suspicion Stops‐ 2012
63rd Precinct
Total Reasonable Suspicion Stops= 3,663
Top Crime Suspected was ROBBERY, accounting for  30.8%  of all stops.
All Activity
Race Residential Population Known Violent Crime 
Suspects
 Persons StoppedAll Known Crime 
Suspects
Asian/Pac.Isl 41/1.1%5,063/4.8% 57/1.7% 4/0.6%
Black 2,764/76.5%46,130/43.5% 2,332/71.1% 545/86.0%
Hispanic 234/6.5%9,222/8.7% 248/7.6% 40/6.3%
White 574/15.9%45,673/43.1% 641/19.6% 45/7.1%
45
0%
10%
20%
30%
40%
50%
60%
70%
Asian/Pac.Isl Black Hispanic White
Residential
Population
All Known Crime
Suspects
Known Violent
Crime Suspects
Persons Stopped
3,435
4,275
4,852
51,884
  Reasonable Suspicion Stops
 Arrests and Criminal Court
Summonses Issued
 Total Crime Complaints
Radio Runs
Reasonable Suspicion Stops‐ 2012
66th Precinct
Total Reasonable Suspicion Stops= 3,435
Top Crime Suspected was ROBBERY, accounting for  25.9%  of all stops.
All Activity
Race Residential Population Known Violent Crime 
Suspects
 Persons StoppedAll Known Crime 
Suspects
Asian/Pac.Isl 395/12.2%34,918/18.6% 367/12.8% 62/13.1%
Black 368/11.4%4,158/2.2% 443/15.4% 124/26.3%
Hispanic 1,637/50.6%25,154/13.4% 995/34.6% 200/42.4%
White 834/25.8%123,907/65.9% 1,067/37.2% 86/18.2%
46
0%
10%
20%
30%
40%
50%
60%
70%
80%
90%
100%
Asian/Pac.Isl Black Hispanic White
Residential
Population
All Known Crime
Suspects
Known Violent
Crime Suspects
Persons Stopped
10,832
14,305
9,189
80,638
  Reasonable Suspicion Stops
 Arrests and Criminal Court
Summonses Issued
 Total Crime Complaints
Radio Runs
Reasonable Suspicion Stops‐ 2012
67th Precinct
Total Reasonable Suspicion Stops= 10,832
Top Crime Suspected was WEAPONS POSSESSION, accounting for  33.5%  of all stops.
All Activity
Race Residential Population Known Violent Crime 
Suspects
 Persons StoppedAll Known Crime 
Suspects
Asian/Pac.Isl 148/1.4%1,750/1.2% 50/0.7% 4/0.3%
Black 10,139/94.7%137,110/90.2% 7,037/93.6% 1,330/95.2%
Hispanic 329/3.1%10,795/7.1% 350/4.7% 57/4.1%
White 90/0.8%2,277/1.5% 85/1.1% 6/0.4%
47
0%
10%
20%
30%
40%
50%
60%
70%
Asian/Pac.Isl Black Hispanic White
Residential
Population
All Known Crime
Suspects
Known Violent
Crime Suspects
Persons Stopped
2,557
4,729
5,001
44,613
  Reasonable Suspicion Stops
 Arrests and Criminal Court
Summonses Issued
 Total Crime Complaints
Radio Runs
Reasonable Suspicion Stops‐ 2012
68th Precinct
Total Reasonable Suspicion Stops= 2,557
Top Crime Suspected was BURGLARY, accounting for  22.6%  of all stops.
All Activity
Race Residential Population Known Violent Crime 
Suspects
 Persons StoppedAll Known Crime 
Suspects
Asian/Pac.Isl 169/6.7%25,359/20.8% 207/7.2% 15/5.7%
Black 149/5.9%1,691/1.4% 253/8.8% 47/17.9%
Hispanic 659/26.2%18,375/15.1% 720/25.1% 60/22.9%
White 1,541/61.2%76,425/62.7% 1,692/58.9% 140/53.4%
48
0%
20%
40%
60%
80%
100%
120%
Asian/Pac.Isl Black Hispanic White
Residential
Population
All Known Crime
Suspects
Known Violent
Crime Suspects
Persons Stopped
5,369
5,780
5,175
42,004
  Reasonable Suspicion Stops
 Arrests and Criminal Court
Summonses Issued
 Total Crime Complaints
Radio Runs
Reasonable Suspicion Stops‐ 2012
69th Precinct
Total Reasonable Suspicion Stops= 5,369
Top Crime Suspected was ROBBERY, accounting for  27.2%  of all stops.
All Activity
Race Residential Population Known Violent Crime 
Suspects
 Persons StoppedAll Known Crime 
Suspects
Asian/Pac.Isl 54/1.0%2,205/2.7% 31/0.8% 3/0.5%
Black 4,843/90.5%68,440/82.8% 3,509/90.2% 532/95.7%
Hispanic 350/6.5%7,030/8.5% 224/5.8% 17/3.1%
White 102/1.9%4,943/6.0% 125/3.2% 4/0.7%
49
0%
10%
20%
30%
40%
50%
60%
70%
80%
90%
Asian/Pac.Isl Black Hispanic White
Residential
Population
All Known Crime
Suspects
Known Violent
Crime Suspects
Persons Stopped
11,248
11,530
7,782
78,795
  Reasonable Suspicion Stops
 Arrests and Criminal Court
Summonses Issued
 Total Crime Complaints
Radio Runs
Reasonable Suspicion Stops‐ 2012
70th Precinct
Total Reasonable Suspicion Stops= 11,248
Top Crime Suspected was ROBBERY, accounting for  45.2%  of all stops.
All Activity
Race Residential Population Known Violent Crime 
Suspects
 Persons StoppedAll Known Crime 
Suspects
Asian/Pac.Isl 259/2.4%14,847/9.5% 193/3.5% 17/2.0%
Black 8,056/75.0%57,447/36.6% 3,786/68.0% 658/77.8%
Hispanic 1,598/14.9%24,865/15.8% 769/13.8% 112/13.2%
White 824/7.7%59,757/38.1% 818/14.7% 59/7.0%
50
0%
10%
20%
30%
40%
50%
60%
70%
80%
90%
100%
Asian/Pac.Isl Black Hispanic White
Residential
Population
All Known Crime
Suspects
Known Violent
Crime Suspects
Persons Stopped
4,676
8,911
7,023
52,351
  Reasonable Suspicion Stops
 Arrests and Criminal Court
Summonses Issued
 Total Crime Complaints
Radio Runs
Reasonable Suspicion Stops‐ 2012
71st Precinct
Total Reasonable Suspicion Stops= 4,676
Top Crime Suspected was WEAPONS POSSESSION, accounting for  26.2%  of all stops.
All Activity
Race Residential Population Known Violent Crime 
Suspects
 Persons StoppedAll Known Crime 
Suspects
Asian/Pac.Isl 37/0.8%1,190/1.2% 18/0.3% 2/0.3%
Black 4,202/90.2%67,770/70.5% 4,525/87.9% 719/92.7%
Hispanic 258/5.5%9,218/9.6% 361/7.0% 39/5.0%
White 163/3.5%17,995/18.7% 244/4.7% 16/2.1%
51
0%
10%
20%
30%
40%
50%
60%
70%
80%
90%
Asian/Pac.Isl Black Hispanic White
Residential
Population
All Known Crime
Suspects
Known Violent
Crime Suspects
Persons Stopped
5,199
9,823
5,403
49,284
  Reasonable Suspicion Stops
 Arrests and Criminal Court
Summonses Issued
 Total Crime Complaints
Radio Runs
Reasonable Suspicion Stops‐ 2012
72nd Precinct
Total Reasonable Suspicion Stops= 5,199
Top Crime Suspected was ROBBERY, accounting for  27.2%  of all stops.
All Activity
Race Residential Population Known Violent Crime 
Suspects
 Persons StoppedAll Known Crime 
Suspects
Asian/Pac.Isl 267/5.3%33,172/26.7% 356/10.0% 40/7.0%
Black 488/9.6%3,959/3.2% 461/12.9% 116/20.2%
Hispanic 3,892/76.6%56,799/45.7% 2,173/60.7% 375/65.4%
White 431/8.5%30,258/24.4% 587/16.4% 42/7.3%
52
0%
10%
20%
30%
40%
50%
60%
70%
80%
90%
100%
Asian/Pac.Isl Black Hispanic White
Residential
Population
All Known Crime
Suspects
Known Violent
Crime Suspects
Persons Stopped
22,148
21,506
11,679
72,606
  Reasonable Suspicion Stops
 Arrests and Criminal Court
Summonses Issued
 Total Crime Complaints
Radio Runs
Reasonable Suspicion Stops‐ 2012
73rd Precinct
Total Reasonable Suspicion Stops= 22,148
Top Crime Suspected was ROBBERY, accounting for  30.4%  of all stops.
All Activity
Race Residential Population Known Violent Crime 
Suspects
 Persons StoppedAll Known Crime 
Suspects
Asian/Pac.Isl 177/0.8%606/0.7% 38/0.4% 2/0.1%
Black 19,067/88.1%66,019/77.9% 8,256/85.1% 1,200/88.8%
Hispanic 2,203/10.2%17,263/20.4% 1,256/12.9% 142/10.5%
White 201/0.9%874/1.0% 154/1.6% 7/0.5%
53
0%
10%
20%
30%
40%
50%
60%
70%
80%
90%
Asian/Pac.Isl Black Hispanic White
Residential
Population
All Known Crime
Suspects
Known Violent
Crime Suspects
Persons Stopped
24,408
28,831
17,034
113,411
  Reasonable Suspicion Stops
 Arrests and Criminal Court
Summonses Issued
 Total Crime Complaints
Radio Runs
Reasonable Suspicion Stops‐ 2012
75th Precinct
Total Reasonable Suspicion Stops= 24,408
Top Crime Suspected was ROBBERY, accounting for  29.6%  of all stops.
All Activity
Race Residential Population Known Violent Crime 
Suspects
 Persons StoppedAll Known Crime 
Suspects
Asian/Pac.Isl 356/1.5%9,000/5.1% 212/1.6% 24/1.1%
Black 17,884/75.4%94,636/53.5% 9,718/71.8% 1,620/77.5%
Hispanic 5,049/21.3%67,135/37.9% 3,222/23.8% 431/20.6%
White 419/1.8%6,241/3.5% 390/2.9% 15/0.7%
54
0%
10%
20%
30%
40%
50%
60%
70%
80%
Asian/Pac.Isl Black Hispanic White
Residential
Population
All Known Crime
Suspects
Known Violent
Crime Suspects
Persons Stopped
4,480
6,805
3,047
26,397
  Reasonable Suspicion Stops
 Arrests and Criminal Court
Summonses Issued
 Total Crime Complaints
Radio Runs
Reasonable Suspicion Stops‐ 2012
76th Precinct
Total Reasonable Suspicion Stops= 4,480
Top Crime Suspected was ROBBERY, accounting for  25.8%  of all stops.
All Activity
Race Residential Population Known Violent Crime 
Suspects
 Persons StoppedAll Known Crime 
Suspects
Asian/Pac.Isl 107/2.5%2,042/4.8% 40/1.9% 3/1.0%
Black 2,168/50.2%5,904/13.9% 1,181/54.6% 207/68.3%
Hispanic 1,374/31.8%9,305/21.9% 577/26.7% 70/23.1%
White 673/15.6%25,289/59.4% 364/16.8% 23/7.6%
55
0%
10%
20%
30%
40%
50%
60%
70%
80%
90%
100%
Asian/Pac.Isl Black Hispanic White
Residential
Population
All Known Crime
Suspects
Known Violent
Crime Suspects
Persons Stopped
9,934
13,657
7,847
56,721
  Reasonable Suspicion Stops
 Arrests and Criminal Court
Summonses Issued
 Total Crime Complaints
Radio Runs
Reasonable Suspicion Stops‐ 2012
77th Precinct
Total Reasonable Suspicion Stops= 9,934
Top Crime Suspected was WEAPONS POSSESSION, accounting for  23.1%  of all stops.
All Activity
Race Residential Population Known Violent Crime 
Suspects
 Persons StoppedAll Known Crime 
Suspects
Asian/Pac.Isl 83/0.8%2,673/2.9% 29/0.5% 1/0.1%
Black 8,703/88.4%62,313/66.8% 5,119/88.2% 729/91.8%
Hispanic 738/7.5%11,324/12.1% 488/8.4% 51/6.4%
White 321/3.3%16,933/18.2% 166/2.9% 13/1.6%
56
0%
10%
20%
30%
40%
50%
60%
70%
80%
Asian/Pac.Isl Black Hispanic White
Residential
Population
All Known Crime
Suspects
Known Violent
Crime Suspects
Persons Stopped
3,281
6,515
3,499
28,431
  Reasonable Suspicion Stops
 Arrests and Criminal Court
Summonses Issued
 Total Crime Complaints
Radio Runs
Reasonable Suspicion Stops‐ 2012
78th Precinct
Total Reasonable Suspicion Stops= 3,281
Top Crime Suspected was ROBBERY, accounting for  31.0%  of all stops.
All Activity
Race Residential Population Known Violent Crime 
Suspects
 Persons StoppedAll Known Crime 
Suspects
Asian/Pac.Isl 48/1.5%3,533/6.0% 35/1.8% 4/1.2%
Black 1,522/49.1%4,782/8.1% 1,097/55.1% 247/76.0%
Hispanic 1,065/34.4%9,537/16.2% 477/24.0% 50/15.4%
White 462/14.9%40,951/69.6% 382/19.2% 24/7.4%
57
0%
10%
20%
30%
40%
50%
60%
70%
80%
90%
Asian/Pac.Isl Black Hispanic White
Residential
Population
All Known Crime
Suspects
Known Violent
Crime Suspects
Persons Stopped
15,294
19,414
8,251
59,907
  Reasonable Suspicion Stops
 Arrests and Criminal Court
Summonses Issued
 Total Crime Complaints
Radio Runs
Reasonable Suspicion Stops‐ 2012
79th Precinct
Total Reasonable Suspicion Stops= 15,294
Top Crime Suspected was WEAPONS POSSESSION, accounting for  26.2%  of all stops.
All Activity
Race Residential Population Known Violent Crime 
Suspects
 Persons StoppedAll Known Crime 
Suspects
Asian/Pac.Isl 151/1.0%2,302/2.6% 81/1.2% 8/0.7%
Black 11,967/80.3%51,875/59.0% 5,155/79.1% 966/82.9%
Hispanic 2,213/14.8%19,626/22.3% 1,037/15.9% 176/15.1%
White 575/3.9%14,092/16.0% 241/3.7% 15/1.3%
58
0%
10%
20%
30%
40%
50%
60%
70%
80%
90%
100%
Asian/Pac.Isl Black Hispanic White
Residential
Population
All Known Crime
Suspects
Known Violent
Crime Suspects
Persons Stopped
9,709
10,811
6,744
42,455
  Reasonable Suspicion Stops
 Arrests and Criminal Court
Summonses Issued
 Total Crime Complaints
Radio Runs
Reasonable Suspicion Stops‐ 2012
81st Precinct
Total Reasonable Suspicion Stops= 9,709
Top Crime Suspected was ROBBERY, accounting for  27.5%  of all stops.
All Activity
Race Residential Population Known Violent Crime 
Suspects
 Persons StoppedAll Known Crime 
Suspects
Asian/Pac.Isl 50/0.5%1,140/1.9% 38/0.7% 4/0.5%
Black 8,184/87.8%47,163/76.9% 4,678/87.5% 741/91.6%
Hispanic 896/9.6%10,821/17.6% 521/9.7% 60/7.4%
White 186/2.0%2,243/3.7% 112/2.1% 4/0.5%
59
0%
10%
20%
30%
40%
50%
60%
70%
Asian/Pac.Isl Black Hispanic White
Residential
Population
All Known Crime
Suspects
Known Violent
Crime Suspects
Persons Stopped
11,811
14,648
7,051
61,150
  Reasonable Suspicion Stops
 Arrests and Criminal Court
Summonses Issued
 Total Crime Complaints
Radio Runs
Reasonable Suspicion Stops‐ 2012
83rd Precinct
Total Reasonable Suspicion Stops= 11,811
Top Crime Suspected was ROBBERY, accounting for  43.2%  of all stops.
All Activity
Race Residential Population Known Violent Crime 
Suspects
 Persons StoppedAll Known Crime 
Suspects
Asian/Pac.Isl 116/1.0%4,776/4.3% 64/1.2% 8/0.7%
Black 4,367/39.5%22,688/20.5% 2,284/42.6% 586/53.5%
Hispanic 5,920/53.5%73,616/66.5% 2,707/50.5% 476/43.4%
White 664/6.0%9,564/8.6% 305/5.7% 26/2.4%
60
0%
10%
20%
30%
40%
50%
60%
70%
80%
90%
Asian/Pac.Isl Black Hispanic White
Residential
Population
All Known Crime
Suspects
Known Violent
Crime Suspects
Persons Stopped
3,830
7,020
5,007
41,870
  Reasonable Suspicion Stops
 Arrests and Criminal Court
Summonses Issued
 Total Crime Complaints
Radio Runs
Reasonable Suspicion Stops‐ 2012
84th Precinct
Total Reasonable Suspicion Stops= 3,830
Top Crime Suspected was ROBBERY, accounting for  14.0%  of all stops.
All Activity
Race Residential Population Known Violent Crime 
Suspects
 Persons StoppedAll Known Crime 
Suspects
Asian/Pac.Isl 125/3.3%4,393/9.4% 78/2.4% 11/2.8%
Black 2,499/65.9%6,546/14.1% 2,185/67.5% 307/78.5%
Hispanic 709/18.7%6,622/14.2% 582/18.0% 53/13.6%
White 457/12.1%28,928/62.2% 391/12.1% 20/5.1%
61
0%
10%
20%
30%
40%
50%
60%
70%
80%
90%
100%
Asian/Pac.Isl Black Hispanic White
Residential
Population
All Known Crime
Suspects
Known Violent
Crime Suspects
Persons Stopped
5,948
6,766
5,087
34,074
  Reasonable Suspicion Stops
 Arrests and Criminal Court
Summonses Issued
 Total Crime Complaints
Radio Runs
Reasonable Suspicion Stops‐ 2012
88th Precinct
Total Reasonable Suspicion Stops= 5,948
Top Crime Suspected was ROBBERY, accounting for  24.3%  of all stops.
All Activity
Race Residential Population Known Violent Crime 
Suspects
 Persons StoppedAll Known Crime 
Suspects
Asian/Pac.Isl 63/1.1%3,378/6.8% 53/1.5% 5/0.8%
Black 4,458/77.7%21,395/43.3% 2,816/79.1% 526/86.8%
Hispanic 786/13.7%8,012/16.2% 510/14.3% 68/11.2%
White 429/7.5%16,592/33.6% 179/5.0% 7/1.2%
62
0%
10%
20%
30%
40%
50%
60%
Asian/Pac.Isl Black Hispanic White
Residential
Population
All Known Crime
Suspects
Known Violent
Crime Suspects
Persons Stopped
9,846
15,118
6,482
50,263
  Reasonable Suspicion Stops
 Arrests and Criminal Court
Summonses Issued
 Total Crime Complaints
Radio Runs
Reasonable Suspicion Stops‐ 2012
90th Precinct
Total Reasonable Suspicion Stops= 9,846
Top Crime Suspected was ROBBERY, accounting for  31.5%  of all stops.
All Activity
Race Residential Population Known Violent Crime 
Suspects
 Persons StoppedAll Known Crime 
Suspects
Asian/Pac.Isl 120/1.2%5,483/4.8% 58/1.4% 5/0.6%
Black 3,645/37.8%7,247/6.3% 1,553/37.2% 415/53.6%
Hispanic 4,954/51.4%37,725/32.8% 2,032/48.7% 316/40.8%
White 923/9.6%64,631/56.2% 529/12.7% 38/4.9%
63
0%
10%
20%
30%
40%
50%
60%
70%
80%
Asian/Pac.Isl Black Hispanic White
Residential
Population
All Known Crime
Suspects
Known Violent
Crime Suspects
Persons Stopped
2,092
5,651
3,524
27,198
  Reasonable Suspicion Stops
 Arrests and Criminal Court
Summonses Issued
 Total Crime Complaints
Radio Runs
Reasonable Suspicion Stops‐ 2012
94th Precinct
Total Reasonable Suspicion Stops= 2,092
Top Crime Suspected was BURGLARY, accounting for  21.1%  of all stops.
All Activity
Race Residential Population Known Violent Crime 
Suspects
 Persons StoppedAll Known Crime 
Suspects
Asian/Pac.Isl 64/3.1%3,228/5.9% 58/2.9% 3/1.0%
Black 509/24.9%1,735/3.2% 594/29.4% 138/47.9%
Hispanic 639/31.2%9,283/16.9% 535/26.5% 74/25.7%
White 836/40.8%40,680/74.1% 831/41.2% 73/25.3%
64
105105105105105105105105105105105105105105105105105105105105105105105105105105105105105105105105105105105105105105105105105105105105105105105105105
114114114114114114114114114114114114114114114114114114114114114114114114114114114114114114114114114114114114114114114114114114114114114114114114114
115115115115115115115115115115115115115115115115115115115115115115115115115115115115115115115115115115115115115115115115115115115115115115115115115
108108108108108108108108108108108108108108108108108108108108108108108108108108108108108108108108108108108108108108108108108108108108108108108108108
110110110110110110110110110110110110110110110110110110110110110110110110110110110110110110110110110110110110110110110110110110110110110110110110110
104104104104104104104104104104104104104104104104104104104104104104104104104104104104104104104104104104104104104104104104104104104104104104104104104
112112112112112112112112112112112112112112112112112112112112112112112112112112112112112112112112112112112112112112112112112112112112112112112112112
109109109109109109109109109109109109109109109109109109109109109109109109109109109109109109109109109109109109109109109109109109109109109109109109109
111111111111111111111111111111111111111111111111111111111111111111111111111111111111111111111111111111111111111111111111111111111111111111111111111
105105105105105105105105105105105105105105105105105105105105105105105105105105105105105105105105105105105105105105105105105105105105105105105105105
102102102102102102102102102102102102102102102102102102102102102102102102102102102102102102102102102102102102102102102102102102102102102102102102102
107107107107107107107107107107107107107107107107107107107107107107107107107107107107107107107107107107107107107107107107107107107107107107107107107
106106106106106106106106106106106106106106106106106106106106106106106106106106106106106106106106106106106106106106106106106106106106106106106106106
103103103103103103103103103103103103103103103103103103103103103103103103103103103103103103103103103103103103103103103103103103103103103103103103103
100100100100100100100100100100100100100100100100100100100100100100100100100100100100100100100100100100100100100100100100100100100100100100100100100
101101101101101101101101101101101101101101101101101101101101101101101101101101101101101101101101101101101101101101101101101101101101101101101101101
Produced by the Office of Manhagement Analysis and Planning - 1-23-13
QUEENS PRECINCTSQUEENS PRECINCTSQUEENS PRECINCTSQUEENS PRECINCTSQUEENS PRECINCTSQUEENS PRECINCTSQUEENS PRECINCTSQUEENS PRECINCTSQUEENS PRECINCTSQUEENS PRECINCTSQUEENS PRECINCTSQUEENS PRECINCTSQUEENS PRECINCTSQUEENS PRECINCTSQUEENS PRECINCTSQUEENS PRECINCTSQUEENS PRECINCTSQUEENS PRECINCTSQUEENS PRECINCTSQUEENS PRECINCTSQUEENS PRECINCTSQUEENS PRECINCTSQUEENS PRECINCTSQUEENS PRECINCTSQUEENS PRECINCTSQUEENS PRECINCTSQUEENS PRECINCTSQUEENS PRECINCTSQUEENS PRECINCTSQUEENS PRECINCTSQUEENS PRECINCTSQUEENS PRECINCTSQUEENS PRECINCTSQUEENS PRECINCTSQUEENS PRECINCTSQUEENS PRECINCTSQUEENS PRECINCTSQUEENS PRECINCTSQUEENS PRECINCTSQUEENS PRECINCTSQUEENS PRECINCTSQUEENS PRECINCTSQUEENS PRECINCTSQUEENS PRECINCTSQUEENS PRECINCTSQUEENS PRECINCTSQUEENS PRECINCTSQUEENS PRECINCTSQUEENS PRECINCTS
65
0%
10%
20%
30%
40%
50%
60%
70%
80%
Asian/Pac.Isl Black Hispanic White
Residential
Population
All Known Crime
Suspects
Known Violent
Crime Suspects
Persons Stopped
4,130
4,746
2,587
24,243
  Reasonable Suspicion Stops
 Arrests and Criminal Court
Summonses Issued
 Total Crime Complaints
Radio Runs
Reasonable Suspicion Stops‐ 2012
100th Precinct
Total Reasonable Suspicion Stops= 4,130
Top Crime Suspected was BURGLARY, accounting for  29.6%  of all stops.
All Activity
Race Residential Population Known Violent Crime 
Suspects
 Persons StoppedAll Known Crime 
Suspects
Asian/Pac.Isl 103/2.5%1,320/2.8% 28/1.5% 1/0.4%
Black 2,657/64.7%11,609/24.8% 1,012/55.3% 167/72.9%
Hispanic 666/16.2%7,161/15.3% 319/17.4% 35/15.3%
White 678/16.5%26,793/57.1% 472/25.8% 26/11.4%
66
0%
10%
20%
30%
40%
50%
60%
70%
80%
90%
100%
Asian/Pac.Isl Black Hispanic White
Residential
Population
All Known Crime
Suspects
Known Violent
Crime Suspects
Persons Stopped
9,770
7,880
4,021
37,384
  Reasonable Suspicion Stops
 Arrests and Criminal Court
Summonses Issued
 Total Crime Complaints
Radio Runs
Reasonable Suspicion Stops‐ 2012
101st Precinct
Total Reasonable Suspicion Stops= 9,770
Top Crime Suspected was WEAPONS POSSESSION, accounting for  49.0%  of all stops.
All Activity
Race Residential Population Known Violent Crime 
Suspects
 Persons StoppedAll Known Crime 
Suspects
Asian/Pac.Isl 61/0.6%1,235/1.9% 31/1.0% 4/0.8%
Black 8,430/88.0%33,054/50.9% 2,310/76.8% 384/80.2%
Hispanic 969/10.1%16,941/26.1% 552/18.3% 82/17.1%
White 118/1.2%13,666/21.1% 116/3.9% 9/1.9%
67
0%
5%
10%
15%
20%
25%
30%
35%
40%
45%
50%
Asian/Pac.Isl Black Hispanic White
Residential
Population
All Known Crime
Suspects
Known Violent
Crime Suspects
Persons Stopped
6,849
7,215
6,238
57,800
  Reasonable Suspicion Stops
 Arrests and Criminal Court
Summonses Issued
 Total Crime Complaints
Radio Runs
Reasonable Suspicion Stops‐ 2012
102nd Precinct
Total Reasonable Suspicion Stops= 6,849
Top Crime Suspected was ROBBERY, accounting for  38.6%  of all stops.
All Activity
Race Residential Population Known Violent Crime 
Suspects
 Persons StoppedAll Known Crime 
Suspects
Asian/Pac.Isl 1,592/24.2%31,134/23.8% 1,015/24.6% 165/20.4%
Black 1,398/21.3%12,027/9.2% 1,058/25.6% 343/42.5%
Hispanic 3,027/46.1%58,865/45.1% 1,579/38.2% 239/29.6%
White 554/8.4%28,578/21.9% 482/11.7% 61/7.5%
68
0%
10%
20%
30%
40%
50%
60%
70%
80%
Asian/Pac.Isl Black Hispanic White
Residential
Population
All Known Crime
Suspects
Known Violent
Crime Suspects
Persons Stopped
12,986
18,653
7,558
70,436
  Reasonable Suspicion Stops
 Arrests and Criminal Court
Summonses Issued
 Total Crime Complaints
Radio Runs
Reasonable Suspicion Stops‐ 2012
103rd Precinct
Total Reasonable Suspicion Stops= 12,986
Top Crime Suspected was ROBBERY, accounting for  29.6%  of all stops.
All Activity
Race Residential Population Known Violent Crime 
Suspects
 Persons StoppedAll Known Crime 
Suspects
Asian/Pac.Isl 631/5.0%17,819/18.6% 444/7.7% 47/4.9%
Black 8,850/70.5%45,855/47.9% 4,015/69.4% 728/75.5%
Hispanic 2,720/21.7%28,865/30.1% 1,143/19.8% 179/18.6%
White 345/2.7%3,287/3.4% 180/3.1% 10/1.0%
69
0%
10%
20%
30%
40%
50%
60%
70%
Asian/Pac.Isl Black Hispanic White
Residential
Population
All Known Crime
Suspects
Known Violent
Crime Suspects
Persons Stopped
4,893
8,440
8,321
58,852
  Reasonable Suspicion Stops
 Arrests and Criminal Court
Summonses Issued
 Total Crime Complaints
Radio Runs
Reasonable Suspicion Stops‐ 2012
104th Precinct
Total Reasonable Suspicion Stops= 4,893
Top Crime Suspected was ROBBERY, accounting for  28.0%  of all stops.
All Activity
Race Residential Population Known Violent Crime 
Suspects
 Persons StoppedAll Known Crime 
Suspects
Asian/Pac.Isl 115/2.4%13,144/7.8% 117/2.4% 15/2.3%
Black 534/11.1%2,373/1.4% 522/10.6% 142/21.4%
Hispanic 2,866/59.4%58,932/35.1% 2,283/46.5% 349/52.6%
White 1,307/27.1%93,396/55.6% 1,987/40.5% 158/23.8%
70
0%
10%
20%
30%
40%
50%
60%
70%
80%
90%
100%
Asian/Pac.Isl Black Hispanic White
Residential
Population
All Known Crime
Suspects
Known Violent
Crime Suspects
Persons Stopped
8,198
10,832
6,994
82,396
  Reasonable Suspicion Stops
 Arrests and Criminal Court
Summonses Issued
 Total Crime Complaints
Radio Runs
Reasonable Suspicion Stops‐ 2012
105th Precinct
Total Reasonable Suspicion Stops= 8,198
Top Crime Suspected was GRAND LARCENY AUTO, accounting for  27.3%  of all stops.
All Activity
Race Residential Population Known Violent Crime 
Suspects
 Persons StoppedAll Known Crime 
Suspects
Asian/Pac.Isl 450/5.8%27,373/15.3% 298/6.6% 21/2.5%
Black 6,196/79.4%104,502/58.4% 3,499/78.0% 729/87.7%
Hispanic 773/9.9%22,413/12.5% 381/8.5% 59/7.1%
White 387/5.0%24,602/13.8% 308/6.9% 22/2.6%
71
0%
10%
20%
30%
40%
50%
60%
Asian/Pac.Isl Black Hispanic White
Residential
Population
All Known Crime
Suspects
Known Violent
Crime Suspects
Persons Stopped
5,019
9,100
6,105
56,837
  Reasonable Suspicion Stops
 Arrests and Criminal Court
Summonses Issued
 Total Crime Complaints
Radio Runs
Reasonable Suspicion Stops‐ 2012
106th Precinct
Total Reasonable Suspicion Stops= 5,019
Top Crime Suspected was ROBBERY, accounting for  43.3%  of all stops.
All Activity
Race Residential Population Known Violent Crime 
Suspects
 Persons StoppedAll Known Crime 
Suspects
Asian/Pac.Isl 1,446/29.9%22,368/21.6% 1,166/31.3% 130/19.8%
Black 1,833/38.0%20,984/20.3% 1,155/31.0% 334/50.9%
Hispanic 1,116/23.1%28,246/27.3% 838/22.5% 149/22.7%
White 434/9.0%31,791/30.7% 570/15.3% 43/6.6%
72
0%
10%
20%
30%
40%
50%
60%
70%
Asian/Pac.Isl Black Hispanic White
Residential
Population
All Known Crime
Suspects
Known Violent
Crime Suspects
Persons Stopped
4,442
6,649
4,725
53,713
  Reasonable Suspicion Stops
 Arrests and Criminal Court
Summonses Issued
 Total Crime Complaints
Radio Runs
Reasonable Suspicion Stops‐ 2012
107th Precinct
Total Reasonable Suspicion Stops= 4,442
Top Crime Suspected was ROBBERY, accounting for  33.7%  of all stops.
All Activity
Race Residential Population Known Violent Crime 
Suspects
 Persons StoppedAll Known Crime 
Suspects
Asian/Pac.Isl 502/11.9%46,880/32.5% 343/12.1% 49/8.9%
Black 2,076/49.3%18,823/13.0% 1,291/45.5% 354/64.4%
Hispanic 1,055/25.1%26,069/18.1% 624/22.0% 104/18.9%
White 576/13.7%52,548/36.4% 579/20.4% 43/7.8%
73
0%
10%
20%
30%
40%
50%
60%
Asian/Pac.Isl Black Hispanic White
Residential
Population
All Known Crime
Suspects
Known Violent
Crime Suspects
Persons Stopped
4,096
5,296
4,837
50,213
  Reasonable Suspicion Stops
 Arrests and Criminal Court
Summonses Issued
 Total Crime Complaints
Radio Runs
Reasonable Suspicion Stops‐ 2012
108th Precinct
Total Reasonable Suspicion Stops= 4,096
Top Crime Suspected was BURGLARY, accounting for  33.5%  of all stops.
All Activity
Race Residential Population Known Violent Crime 
Suspects
 Persons StoppedAll Known Crime 
Suspects
Asian/Pac.Isl 602/14.9%36,485/33.1% 339/13.1% 37/10.9%
Black 537/13.3%2,138/1.9% 478/18.5% 87/25.7%
Hispanic 2,222/55.1%38,994/35.4% 1,204/46.5% 179/53.0%
White 673/16.7%32,448/29.5% 569/22.0% 35/10.4%
74
0%
10%
20%
30%
40%
50%
60%
Asian/Pac.Isl Black Hispanic White
Residential
Population
All Known Crime
Suspects
Known Violent
Crime Suspects
Persons Stopped
9,682
10,344
7,518
75,544
  Reasonable Suspicion Stops
 Arrests and Criminal Court
Summonses Issued
 Total Crime Complaints
Radio Runs
Reasonable Suspicion Stops‐ 2012
109th Precinct
Total Reasonable Suspicion Stops= 9,682
Top Crime Suspected was ROBBERY, accounting for  35.1%  of all stops.
All Activity
Race Residential Population Known Violent Crime 
Suspects
 Persons StoppedAll Known Crime 
Suspects
Asian/Pac.Isl 2,022/21.3%122,403/50.5% 1,596/31.2% 192/27.3%
Black 1,967/20.7%5,509/2.3% 920/18.0% 205/29.2%
Hispanic 4,226/44.5%40,985/16.9% 1,548/30.3% 232/33.0%
White 1,291/13.6%73,447/30.3% 1,053/20.6% 74/10.5%
75
0%
10%
20%
30%
40%
50%
60%
70%
80%
90%
100%
Asian/Pac.Isl Black Hispanic White
Residential
Population
All Known Crime
Suspects
Known Violent
Crime Suspects
Persons Stopped
9,090
14,802
6,639
62,278
  Reasonable Suspicion Stops
 Arrests and Criminal Court
Summonses Issued
 Total Crime Complaints
Radio Runs
Reasonable Suspicion Stops‐ 2012
110th Precinct
Total Reasonable Suspicion Stops= 9,090
Top Crime Suspected was ROBBERY, accounting for  48.2%  of all stops.
All Activity
Race Residential Population Known Violent Crime 
Suspects
 Persons StoppedAll Known Crime 
Suspects
Asian/Pac.Isl 348/3.9%56,420/33.4% 482/9.5% 46/5.6%
Black 542/6.0%9,277/5.5% 860/17.0% 162/19.6%
Hispanic 7,850/87.2%90,954/53.8% 3,243/64.1% 562/67.9%
White 261/2.9%12,300/7.3% 477/9.4% 58/7.0%
76
0%
10%
20%
30%
40%
50%
60%
Asian/Pac.Isl Black Hispanic White
Residential
Population
All Known Crime
Suspects
Known Violent
Crime Suspects
Persons Stopped
3,752
3,228
2,997
37,764
  Reasonable Suspicion Stops
 Arrests and Criminal Court
Summonses Issued
 Total Crime Complaints
Radio Runs
Reasonable Suspicion Stops‐ 2012
111th Precinct
Total Reasonable Suspicion Stops= 3,752
Top Crime Suspected was BURGLARY, accounting for  35.1%  of all stops.
All Activity
Race Residential Population Known Violent Crime 
Suspects
 Persons StoppedAll Known Crime 
Suspects
Asian/Pac.Isl 674/18.4%45,621/39.8% 260/16.8% 27/14.9%
Black 586/16.0%2,402/2.1% 290/18.7% 84/46.4%
Hispanic 1,058/29.0%11,801/10.3% 354/22.9% 25/13.8%
White 1,336/36.6%54,746/47.8% 644/41.6% 45/24.9%
77
0%
10%
20%
30%
40%
50%
60%
Asian/Pac.Isl Black Hispanic White
Residential
Population
All Known Crime
Suspects
Known Violent
Crime Suspects
Persons Stopped
2,799
4,771
3,641
38,713
  Reasonable Suspicion Stops
 Arrests and Criminal Court
Summonses Issued
 Total Crime Complaints
Radio Runs
Reasonable Suspicion Stops‐ 2012
112th Precinct
Total Reasonable Suspicion Stops= 2,799
Top Crime Suspected was BURGLARY, accounting for  26.7%  of all stops.
All Activity
Race Residential Population Known Violent Crime 
Suspects
 Persons StoppedAll Known Crime 
Suspects
Asian/Pac.Isl 163/6.2%29,199/26.8% 168/8.2% 11/4.9%
Black 611/23.2%2,789/2.6% 423/20.6% 83/37.2%
Hispanic 944/35.9%15,097/13.9% 560/27.3% 63/28.3%
White 914/34.7%61,897/56.8% 899/43.9% 66/29.6%
78
0%
10%
20%
30%
40%
50%
60%
70%
80%
90%
100%
Asian/Pac.Isl Black Hispanic White
Residential
Population
All Known Crime
Suspects
Known Violent
Crime Suspects
Persons Stopped
8,736
14,298
8,978
64,437
  Reasonable Suspicion Stops
 Arrests and Criminal Court
Summonses Issued
 Total Crime Complaints
Radio Runs
Reasonable Suspicion Stops‐ 2012
113th Precinct
Total Reasonable Suspicion Stops= 8,736
Top Crime Suspected was WEAPONS POSSESSION, accounting for  27.2%  of all stops.
All Activity
Race Residential Population Known Violent Crime 
Suspects
 Persons StoppedAll Known Crime 
Suspects
Asian/Pac.Isl 227/2.6%2,562/2.2% 227/3.5% 19/1.9%
Black 7,635/88.7%101,513/88.4% 5,248/81.0% 927/92.2%
Hispanic 608/7.1%9,791/8.5% 664/10.3% 48/4.8%
White 139/1.6%1,031/0.9% 337/5.2% 11/1.1%
79
0%
5%
10%
15%
20%
25%
30%
35%
40%
45%
50%
Asian/Pac.Isl Black Hispanic White
Residential
Population
All Known Crime
Suspects
Known Violent
Crime Suspects
Persons Stopped
8,464
13,691
9,035
79,176
  Reasonable Suspicion Stops
 Arrests and Criminal Court
Summonses Issued
 Total Crime Complaints
Radio Runs
Reasonable Suspicion Stops‐ 2012
114th Precinct
Total Reasonable Suspicion Stops= 8,464
Top Crime Suspected was ROBBERY, accounting for  25.4%  of all stops.
All Activity
Race Residential Population Known Violent Crime 
Suspects
 Persons StoppedAll Known Crime 
Suspects
Asian/Pac.Isl 511/6.4%28,945/14.8% 428/7.4% 51/6.4%
Black 2,889/36.3%21,019/10.7% 1,964/33.8% 380/47.6%
Hispanic 3,132/39.4%54,439/27.8% 1,913/33.0% 269/33.7%
White 1,420/17.9%91,527/46.7% 1,499/25.8% 99/12.4%
80
0%
10%
20%
30%
40%
50%
60%
70%
80%
90%
Asian/Pac.Isl Black Hispanic White
Residential
Population
All Known Crime
Suspects
Known Violent
Crime Suspects
Persons Stopped
8,068
19,946
7,445
61,942
  Reasonable Suspicion Stops
 Arrests and Criminal Court
Summonses Issued
 Total Crime Complaints
Radio Runs
Reasonable Suspicion Stops‐ 2012
115th Precinct
Total Reasonable Suspicion Stops= 8,068
Top Crime Suspected was ROBBERY, accounting for  34.9%  of all stops.
All Activity
Race Residential Population Known Violent Crime 
Suspects
 Persons StoppedAll Known Crime 
Suspects
Asian/Pac.Isl 245/3.1%27,591/16.4% 288/5.4% 26/3.4%
Black 859/10.9%10,494/6.2% 660/12.4% 133/17.6%
Hispanic 6,463/82.1%109,691/65.2% 3,997/75.0% 572/75.9%
White 308/3.9%20,452/12.2% 386/7.2% 23/3.1%
81
No Window
120120120120120120120120120120120120120120120120120120120120120120120120120120120120120120120120120120120120120120120120120120120120120120120120120
122122122122122122122122122122122122122122122122122122122122122122122122122122122122122122122122122122122122122122122122122122122122122122122122122
123123123123123123123123123123123123123123123123123123123123123123123123123123123123123123123123123123123123123123123123123123123123123123123123123
Produced by the Office of Manhagement Analysis and Planning - 1-23-13
STATEN ISLAND PRECINCTSSTATEN ISLAND PRECINCTSSTATEN ISLAND PRECINCTSSTATEN ISLAND PRECINCTSSTATEN ISLAND PRECINCTSSTATEN ISLAND PRECINCTSSTATEN ISLAND PRECINCTSSTATEN ISLAND PRECINCTSSTATEN ISLAND PRECINCTSSTATEN ISLAND PRECINCTSSTATEN ISLAND PRECINCTSSTATEN ISLAND PRECINCTSSTATEN ISLAND PRECINCTSSTATEN ISLAND PRECINCTSSTATEN ISLAND PRECINCTSSTATEN ISLAND PRECINCTSSTATEN ISLAND PRECINCTSSTATEN ISLAND PRECINCTSSTATEN ISLAND PRECINCTSSTATEN ISLAND PRECINCTSSTATEN ISLAND PRECINCTSSTATEN ISLAND PRECINCTSSTATEN ISLAND PRECINCTSSTATEN ISLAND PRECINCTSSTATEN ISLAND PRECINCTSSTATEN ISLAND PRECINCTSSTATEN ISLAND PRECINCTSSTATEN ISLAND PRECINCTSSTATEN ISLAND PRECINCTSSTATEN ISLAND PRECINCTSSTATEN ISLAND PRECINCTSSTATEN ISLAND PRECINCTSSTATEN ISLAND PRECINCTSSTATEN ISLAND PRECINCTSSTATEN ISLAND PRECINCTSSTATEN ISLAND PRECINCTSSTATEN ISLAND PRECINCTSSTATEN ISLAND PRECINCTSSTATEN ISLAND PRECINCTSSTATEN ISLAND PRECINCTSSTATEN ISLAND PRECINCTSSTATEN ISLAND PRECINCTSSTATEN ISLAND PRECINCTSSTATEN ISLAND PRECINCTSSTATEN ISLAND PRECINCTSSTATEN ISLAND PRECINCTSSTATEN ISLAND PRECINCTSSTATEN ISLAND PRECINCTSSTATEN ISLAND PRECINCTS
82
0%
10%
20%
30%
40%
50%
60%
70%
Asian/Pac.Isl Black Hispanic White
Residential
Population
All Known Crime
Suspects
Known Violent
Crime Suspects
Persons Stopped
12,368
16,907
11,787
90,882
  Reasonable Suspicion Stops
 Arrests and Criminal Court
Summonses Issued
 Total Crime Complaints
Radio Runs
Reasonable Suspicion Stops‐ 2012
120th Precinct
Total Reasonable Suspicion Stops= 12,368
Top Crime Suspected was WEAPONS POSSESSION, accounting for  21.7%  of all stops.
All Activity
Race Residential Population Known Violent Crime 
Suspects
 Persons StoppedAll Known Crime 
Suspects
Asian/Pac.Isl 147/1.2%13,111/7.6% 88/1.1% 10/1.2%
Black 7,176/59.3%38,621/22.5% 4,099/51.5% 530/61.0%
Hispanic 3,042/25.1%50,065/29.2% 2,037/25.6% 210/24.2%
White 1,745/14.4%69,591/40.6% 1,728/21.7% 119/13.7%
83
0%
10%
20%
30%
40%
50%
60%
70%
80%
90%
Asian/Pac.Isl Black Hispanic White
Residential
Population
All Known Crime
Suspects
Known Violent
Crime Suspects
Persons Stopped
6,420
7,982
8,432
73,738
  Reasonable Suspicion Stops
 Arrests and Criminal Court
Summonses Issued
 Total Crime Complaints
Radio Runs
Reasonable Suspicion Stops‐ 2012
122nd Precinct
Total Reasonable Suspicion Stops= 6,420
Top Crime Suspected was BURGLARY, accounting for  29.6%  of all stops.
All Activity
Race Residential Population Known Violent Crime 
Suspects
 Persons StoppedAll Known Crime 
Suspects
Asian/Pac.Isl 136/2.2%17,101/8.9% 110/2.1% 2/0.6%
Black 931/15.2%4,477/2.3% 931/17.9% 112/32.5%
Hispanic 1,083/17.7%23,008/12.0% 778/15.0% 71/20.6%
White 3,960/64.8%147,256/76.8% 3,382/65.0% 160/46.4%
84
0%
10%
20%
30%
40%
50%
60%
70%
80%
90%
100%
Asian/Pac.Isl Black Hispanic White
Residential
Population
All Known Crime
Suspects
Known Violent
Crime Suspects
Persons Stopped
1,940
3,280
3,123
26,278
  Reasonable Suspicion Stops
 Arrests and Criminal Court
Summonses Issued
 Total Crime Complaints
Radio Runs
Reasonable Suspicion Stops‐ 2012
123rd Precinct
Total Reasonable Suspicion Stops= 1,940
Top Crime Suspected was BURGLARY, accounting for  26.2%  of all stops.
All Activity
Race Residential Population Known Violent Crime 
Suspects
 Persons StoppedAll Known Crime 
Suspects
Asian/Pac.Isl 31/1.6%4,485/4.6% 14/0.7% 0/0.0%
Black 104/5.4%1,215/1.3% 131/6.6% 18/16.2%
Hispanic 181/9.4%7,978/8.2% 177/8.9% 19/17.1%
White 1,619/83.7%83,322/85.9% 1,659/83.7% 74/66.7%
85


New Yo
Office o
DEPUT
ASSISTA
ork City Pol
of Managem
TY COMM
ANT COM
CAPTA
ice Depart
ment Anal
MICHAE
MISSION
PHILIP
MMISSION
THOM
IN, RESOU
tment  
ysis and Pl


EL J. FAR
NER, STR
 
P MCGUI
NER, PRO
 
MAS J. TAF
URCE ANAL
lanning  
RRELL 
RATEGIC 
IRE 
GRAMS A
FFE 
LYSIS SECT
INITIAT
AND POL
TION 
TIVES 
LICIES 
86

2012_sqf_final_04_02_2013

  • 1.
  • 2.
    New York CityPolice Department  Reasonable Suspicion Stops: 2012   Introduction    The  following  pages  present  data  on  the  residential  population  of  police  precincts, as reported by the 2010 U.S. Census, as well as the benchmark of crime  suspect description in that precinct, by race, as compared to stop activity in that  precinct, by race. These precinct pages also include an overview of other police  activity in the precinct compared to reasonable suspicion stops.  The first page  illustrates this data on a Citywide basis.               1
  • 3.
    Explanation of Data and Statistical Notes  Top Crime Suspected‐ The crime suspected (when initiating a stop) is entered by a  police officer in a field of the Department Stop, Question and Frisk worksheet and  information taken from that worksheet is entered into the NYPD Stop, Question  and Frisk database. In this report, the percentages of the Top Crime Suspected are  based  on  data publically  released  on  the  Department  website  from  the  NYPD  Stop, Question and Frisk database. The percentage compares the number of stops  reported for each specific crime suspected to the total number of stops reported  in each precinct on a Stop, Question and Frisk report.  Residential  Population* ‐  Residential  figures  are  based  on  the  2010  census,  broken  down  by  race  and  police  precinct.  Data  provided  by  New  York  City  Department of City Planning‐Population Division.  All Known Suspects/Violent Crime Suspects* ‐ In order to properly determine the  “known  arrested  and  un‐arrested  suspects”  for  crime  complaints  recorded  in  2012 the following procedures were employed: all crime reports with a recorded  occurrence date in 2012, as of January 27th , 2013, supplied information on un‐ arrested suspects and; the arrests effected in 2012, no more than 24 hours after  the  recording  of  complaints  occurring  in  2012,  supplied  the  arrested  suspect  information.**  For the purpose of this report, violent crime includes murder, rape,  robbery, and felony assault.  The process of determining the known arrested and un‐arrested suspects made  use of most of the complaints recorded in 2012 (497,323 of 503,780) but only a  portion of the arrests recorded in 2012. One hundred ninety‐five thousand eight  hundred sixty arrests were used in the merge. The remaining arrests recorded in  2012 were excluded because they were made for complaints occurring prior to  2012, they were made for complaints occurring in 2012 but as a result of follow‐ up investigations after the 24 hour period, or they were arrests for instances in  which a complaint report is not prepared.                                                                   * Figures include Asian, Black, Hispanic, and White races only. Unknown and other races are not included in these  figures.  **  The 24 hour rule was employed to avoid double counting suspects as both arrested and un‐arrested, as follow‐ up investigations produced arrests of individuals who were originally recorded as un‐arrested suspects.  2
  • 4.
    Persons Stopped* ‐ Percentages of race are based on supplied identification, self‐ identification or officer identification as reported on the Stop, Question and Frisk  report and returned from the NYPD Stop, Question and Frisk database.  Radio Runs‐ Number of radio runs created in response to calls for service from  the  public.  Number based  on  all  requests  for  assistance  that  were  transmitted  over  police  radio  and  assigned  a  “job  number,”  including  911  calls,  patrol  encounters, and request for assistance from a person on the street.  Requests from a person walking into or calling a precinct directly and requests  through the 311 system are not included unless the officer subsequently radios  the  request  to  the  dispatcher.  Self‐initiated  jobs  not  resulting  from  a  citizen  complaint or contact (i.e.: interior building patrol, directed park patrol, etc.) are  not included.   Total Crime Complaints Reported‐ Number based on felony, misdemeanor, and  violation complaint reports recorded in the specific precinct, occurring in 2012, as  reported through the NYPD complaint reporting system as of January 27th , 2013.  This  does  not  include  arrests  where  no  complaint  report  was  generated  or  complaint  reports  used  to  record  an  event  of  a  non‐criminal  nature  (e.g.  lost  property).  Arrests  and  Criminal  Court  Summonses  Issued‐  Number  based  on  all  arrests  made and all criminal court summonses issued in the specific precinct as reported  in the 2012 year end Compstat Report. Parking summonses and moving violation  summonses are excluded.  Reasonable  Suspicion  Stops‐  NYPD  officers  are  required  to  record  information  regarding a reasonable suspicion stop on a Stop, Question and Frisk form. This  information  is  entered  in  to  an  electronic  database,  the  content  of  which  is  authorized under New York State Criminal Procedure Law section 140.50(4). The  NYPD is required to report the number of stops within thirty days of the end of  each calendar quarter to the New York City Council pursuant to 14‐150(5) of the  New  York  City  Administrative  Code.  Following  the  end  of  each  year,  the  Department compiles the database entries and produces and posts publically the  information of the database on the NYPD website. The data in this report is based   on that dataset. The data is available  at: http://www.nyc.gov/html/nypd/html/analysis_and_planning/stop_question_a nd_frisk_report.shtml  3
  • 5.
    0% 10% 20% 30% 40% 50% 60% 70% Asian/Pac.Isl Black HispanicWhite Residential Population All Known Crime Suspects Known Violent Crime Suspects Persons Stopped 532,911 873,528 497,323 4,107,144   Reasonable Suspicion Stops  Arrests and Criminal Court Summonses Issued  Total Crime Complaints Radio Runs Reasonable Suspicion Stops‐ 2012 Citywide Total Reasonable Suspicion Stops= 532,911 Top Crime Suspected was WEAPONS POSSESSION, accounting for  24.3%  of all stops. All Activity Race Residential Population Known Violent Crime  Suspects  Persons StoppedAll Known Crime  Suspects Asian/Pac.Isl 17,058/3.3%1,028,046/12.9% 13,797/3.9% 1,306/2.7% Black 284,229/55.0%1,861,136/23.4% 180,492/50.7% 29,651/61.3% Hispanic 165,140/32.0%2,335,928/29.4% 112,338/31.6% 14,109/29.2% White 50,366/9.7%2,722,877/34.3% 49,117/13.8% 3,325/6.9% 4
  • 6.
    CPPCPPCPPCPPCPPCPPCPPCPPCPPCPPCPPCPPCPPCPPCPPCPPCPPCPPCPPCPPCPPCPPCPPCPPCPPCPPCPPCPPCPPCPPCPPCPPCPPCPPCPPCPPCPPCPPCPPCPPCPPCPPCPPCPPCPPCPPCPPCPPCPP 25252525252525252525252525252525252525252525252525252525252525252525252525252525252525252525252525 32323232323232323232323232323232323232323232323232323232323232323232323232323232323232323232323232 MTSMTSMTSMTSMTSMTSMTSMTSMTSMTSMTSMTSMTSMTSMTSMTSMTSMTSMTSMTSMTSMTSMTSMTSMTSMTSMTSMTSMTSMTSMTSMTSMTSMTSMTSMTSMTSMTSMTSMTSMTSMTSMTSMTSMTSMTSMTSMTSMTS MTNMTNMTNMTNMTNMTNMTNMTNMTNMTNMTNMTNMTNMTNMTNMTNMTNMTNMTNMTNMTNMTNMTNMTNMTNMTNMTNMTNMTNMTNMTNMTNMTNMTNMTNMTNMTNMTNMTNMTNMTNMTNMTNMTNMTNMTNMTNMTNMTN CPPCPPCPPCPPCPPCPPCPPCPPCPPCPPCPPCPPCPPCPPCPPCPPCPPCPPCPPCPPCPPCPPCPPCPPCPPCPPCPPCPPCPPCPPCPPCPPCPPCPPCPPCPPCPPCPPCPPCPPCPPCPPCPPCPPCPPCPPCPPCPPCPP 25252525252525252525252525252525252525252525252525252525252525252525252525252525252525252525252525 32323232323232323232323232323232323232323232323232323232323232323232323232323232323232323232323232 20202020202020202020202020202020202020202020202020202020202020202020202020202020202020202020202020 24242424242424242424242424242424242424242424242424242424242424242424242424242424242424242424242424 19191919191919191919191919191919191919191919191919191919191919191919191919191919191919191919191919 26262626262626262626262626262626262626262626262626262626262626262626262626262626262626262626262626 30303030303030303030303030303030303030303030303030303030303030303030303030303030303030303030303030 28282828282828282828282828282828282828282828282828282828282828282828282828282828282828282828282828 33333333333333333333333333333333333333333333333333333333333333333333333333333333333333333333333333 23232323232323232323232323232323232323232323232323232323232323232323232323232323232323232323232323 34343434343434343434343434343434343434343434343434343434343434343434343434343434343434343434343434 MTSMTSMTSMTSMTSMTSMTSMTSMTSMTSMTSMTSMTSMTSMTSMTSMTSMTSMTSMTSMTSMTSMTSMTSMTSMTSMTSMTSMTSMTSMTSMTSMTSMTSMTSMTSMTSMTSMTSMTSMTSMTSMTSMTSMTSMTSMTSMTSMTS MTNMTNMTNMTNMTNMTNMTNMTNMTNMTNMTNMTNMTNMTNMTNMTNMTNMTNMTNMTNMTNMTNMTNMTNMTNMTNMTNMTNMTNMTNMTNMTNMTNMTNMTNMTNMTNMTNMTNMTNMTNMTNMTNMTNMTNMTNMTNMTNMTN 1111111111111111111111111111111111111111111111111 5555555555555555555555555555555555555555555555555 9999999999999999999999999999999999999999999999999 6666666666666666666666666666666666666666666666666 7777777777777777777777777777777777777777777777777 13131313131313131313131313131313131313131313131313131313131313131313131313131313131313131313131313 10101010101010101010101010101010101010101010101010101010101010101010101010101010101010101010101010 17171717171717171717171717171717171717171717171717171717171717171717171717171717171717171717171717 Produced bythe Office of Manhagement Analysis and Planning - 1-23-13 MANHATTAN PRECINCTSMANHATTAN PRECINCTSMANHATTAN PRECINCTSMANHATTAN PRECINCTSMANHATTAN PRECINCTSMANHATTAN PRECINCTSMANHATTAN PRECINCTSMANHATTAN PRECINCTSMANHATTAN PRECINCTSMANHATTAN PRECINCTSMANHATTAN PRECINCTSMANHATTAN PRECINCTSMANHATTAN PRECINCTSMANHATTAN PRECINCTSMANHATTAN PRECINCTSMANHATTAN PRECINCTSMANHATTAN PRECINCTSMANHATTAN PRECINCTSMANHATTAN PRECINCTSMANHATTAN PRECINCTSMANHATTAN PRECINCTSMANHATTAN PRECINCTSMANHATTAN PRECINCTSMANHATTAN PRECINCTSMANHATTAN PRECINCTSMANHATTAN PRECINCTSMANHATTAN PRECINCTSMANHATTAN PRECINCTSMANHATTAN PRECINCTSMANHATTAN PRECINCTSMANHATTAN PRECINCTSMANHATTAN PRECINCTSMANHATTAN PRECINCTSMANHATTAN PRECINCTSMANHATTAN PRECINCTSMANHATTAN PRECINCTSMANHATTAN PRECINCTSMANHATTAN PRECINCTSMANHATTAN PRECINCTSMANHATTAN PRECINCTSMANHATTAN PRECINCTSMANHATTAN PRECINCTSMANHATTAN PRECINCTSMANHATTAN PRECINCTSMANHATTAN PRECINCTSMANHATTAN PRECINCTSMANHATTAN PRECINCTSMANHATTAN PRECINCTSMANHATTAN PRECINCTS 5
  • 7.
    0% 10% 20% 30% 40% 50% 60% 70% 80% Asian/Pac.Isl Black HispanicWhite Residential Population All Known Crime Suspects Known Violent Crime Suspects Persons Stopped 3,053 8,794 6,172 48,124   Reasonable Suspicion Stops  Arrests and Criminal Court Summonses Issued  Total Crime Complaints Radio Runs Reasonable Suspicion Stops‐ 2012 1st Precinct Total Reasonable Suspicion Stops= 3,053 Top Crime Suspected was GRAND LARCENY, accounting for  24.5%  of all stops. All Activity Race Residential Population Known Violent Crime  Suspects  Persons StoppedAll Known Crime  Suspects Asian/Pac.Isl 201/6.8%10,520/16.3% 374/9.1% 7/2.7% Black 1,671/56.1%1,984/3.1% 1,884/45.8% 140/53.4% Hispanic 522/17.5%4,676/7.3% 702/17.1% 55/21.0% White 583/19.6%47,231/73.3% 1,155/28.1% 60/22.9% 6
  • 8.
    0% 10% 20% 30% 40% 50% 60% 70% Asian/Pac.Isl Black HispanicWhite Residential Population All Known Crime Suspects Known Violent Crime Suspects Persons Stopped 2,782 10,935 4,573 38,608   Reasonable Suspicion Stops  Arrests and Criminal Court Summonses Issued  Total Crime Complaints Radio Runs Reasonable Suspicion Stops‐ 2012 5th Precinct Total Reasonable Suspicion Stops= 2,782 Top Crime Suspected was GRAND LARCENY, accounting for  17.0%  of all stops. All Activity Race Residential Population Known Violent Crime  Suspects  Persons StoppedAll Known Crime  Suspects Asian/Pac.Isl 351/13.5%31,866/61.6% 597/17.7% 38/10.8% Black 1,066/41.0%2,309/4.5% 1,476/43.6% 182/51.9% Hispanic 729/28.0%6,051/11.7% 824/24.4% 97/27.6% White 454/17.5%11,490/22.2% 485/14.3% 34/9.7% 7
  • 9.
    0% 10% 20% 30% 40% 50% 60% 70% 80% 90% Asian/Pac.Isl Black HispanicWhite Residential Population All Known Crime Suspects Known Violent Crime Suspects Persons Stopped 3,637 8,396 5,467 36,778   Reasonable Suspicion Stops  Arrests and Criminal Court Summonses Issued  Total Crime Complaints Radio Runs Reasonable Suspicion Stops‐ 2012 6th Precinct Total Reasonable Suspicion Stops= 3,637 Top Crime Suspected was GRAND LARCENY, accounting for  19.1%  of all stops. All Activity Race Residential Population Known Violent Crime  Suspects  Persons StoppedAll Known Crime  Suspects Asian/Pac.Isl 80/2.3%4,925/8.2% 127/3.8% 4/1.2% Black 2,171/61.9%1,204/2.0% 1,545/46.7% 188/58.6% Hispanic 690/19.7%3,736/6.2% 637/19.3% 74/23.1% White 566/16.1%50,482/83.7% 999/30.2% 55/17.1% 8
  • 10.
    0% 10% 20% 30% 40% 50% 60% Asian/Pac.Isl Black HispanicWhite Residential Population All Known Crime Suspects Known Violent Crime Suspects Persons Stopped 3,501 8,400 4,122 30,060   Reasonable Suspicion Stops  Arrests and Criminal Court Summonses Issued  Total Crime Complaints Radio Runs Reasonable Suspicion Stops‐ 2012 7th Precinct Total Reasonable Suspicion Stops= 3,501 Top Crime Suspected was WEAPONS POSSESSION, accounting for  20.4%  of all stops. All Activity Race Residential Population Known Violent Crime  Suspects  Persons StoppedAll Known Crime  Suspects Asian/Pac.Isl 98/2.9%20,034/36.3% 164/4.9% 20/5.2% Black 1,405/41.2%4,566/8.3% 1,234/36.7% 203/52.5% Hispanic 1,485/43.5%17,835/32.3% 1,352/40.2% 142/36.7% White 423/12.4%12,728/23.1% 611/18.2% 22/5.7% 9
  • 11.
    0% 10% 20% 30% 40% 50% 60% Asian/Pac.Isl Black HispanicWhite Residential Population All Known Crime Suspects Known Violent Crime Suspects Persons Stopped 5,282 8,987 6,227 48,494   Reasonable Suspicion Stops  Arrests and Criminal Court Summonses Issued  Total Crime Complaints Radio Runs Reasonable Suspicion Stops‐ 2012 9th Precinct Total Reasonable Suspicion Stops= 5,282 Top Crime Suspected was ROBBERY, accounting for  16.9%  of all stops. All Activity Race Residential Population Known Violent Crime  Suspects  Persons StoppedAll Known Crime  Suspects Asian/Pac.Isl 143/2.8%10,889/14.7% 143/3.4% 9/2.1% Black 1,824/36.0%5,476/7.4% 1,519/36.6% 196/46.4% Hispanic 2,031/40.1%18,336/24.7% 1,491/35.9% 163/38.6% White 1,071/21.1%39,546/53.3% 1,000/24.1% 54/12.8% 10
  • 12.
    0% 10% 20% 30% 40% 50% 60% 70% Asian/Pac.Isl Black HispanicWhite Residential Population All Known Crime Suspects Known Violent Crime Suspects Persons Stopped 2,406 7,172 4,209 37,473   Reasonable Suspicion Stops  Arrests and Criminal Court Summonses Issued  Total Crime Complaints Radio Runs Reasonable Suspicion Stops‐ 2012 10th Precinct Total Reasonable Suspicion Stops= 2,406 Top Crime Suspected was GRAND LARCENY, accounting for  17.1%  of all stops. All Activity Race Residential Population Known Violent Crime  Suspects  Persons StoppedAll Known Crime  Suspects Asian/Pac.Isl 65/2.8%5,983/12.2% 102/4.0% 6/2.5% Black 1,305/56.3%3,378/6.9% 1,210/47.4% 152/63.1% Hispanic 534/23.0%8,714/17.8% 631/24.7% 55/22.8% White 416/17.9%30,889/63.1% 611/23.9% 28/11.6% 11
  • 13.
    0% 10% 20% 30% 40% 50% 60% 70% 80% Asian/Pac.Isl Black HispanicWhite Residential Population All Known Crime Suspects Known Violent Crime Suspects Persons Stopped 3,830 8,767 7,033 60,098   Reasonable Suspicion Stops  Arrests and Criminal Court Summonses Issued  Total Crime Complaints Radio Runs Reasonable Suspicion Stops‐ 2012 13th Precinct Total Reasonable Suspicion Stops= 3,830 Top Crime Suspected was GRAND LARCENY, accounting for  20.9%  of all stops. All Activity Race Residential Population Known Violent Crime  Suspects  Persons StoppedAll Known Crime  Suspects Asian/Pac.Isl 102/2.7%12,714/14.0% 171/4.3% 3/0.8% Black 1,783/47.5%4,129/4.5% 1,822/45.4% 247/63.2% Hispanic 1,076/28.7%8,573/9.4% 996/24.8% 87/22.3% White 794/21.1%65,405/72.0% 1,024/25.5% 54/13.8% 12
  • 14.
    0% 10% 20% 30% 40% 50% 60% 70% Asian/Pac.Isl Black HispanicWhite Residential Population All Known Crime Suspects Known Violent Crime Suspects Persons Stopped 8,945 26,488 11,259 74,789   Reasonable Suspicion Stops  Arrests and Criminal Court Summonses Issued  Total Crime Complaints Radio Runs Reasonable Suspicion Stops‐ 2012 Midtown South Precinct (MTS) Total Reasonable Suspicion Stops= 8,945 Top Crime Suspected was GRAND LARCENY, accounting for  21.4%  of all stops. All Activity Race Residential Population Known Violent Crime  Suspects  Persons StoppedAll Known Crime  Suspects Asian/Pac.Isl 329/3.8%4,187/21.0% 482/5.9% 10/2.2% Black 4,925/56.7%1,390/7.0% 3,865/47.5% 305/65.6% Hispanic 1,879/21.6%2,306/11.6% 2,158/26.5% 92/19.8% White 1,559/17.9%12,037/60.4% 1,639/20.1% 58/12.5% 13
  • 15.
    0% 10% 20% 30% 40% 50% 60% 70% 80% 90% Asian/Pac.Isl Black HispanicWhite Residential Population All Known Crime Suspects Known Violent Crime Suspects Persons Stopped 1,331 6,229 3,178 36,815   Reasonable Suspicion Stops  Arrests and Criminal Court Summonses Issued  Total Crime Complaints Radio Runs Reasonable Suspicion Stops‐ 2012 17th Precinct Total Reasonable Suspicion Stops= 1,331 Top Crime Suspected was BURGLARY, accounting for  14.7%  of all stops. All Activity Race Residential Population Known Violent Crime  Suspects  Persons StoppedAll Known Crime  Suspects Asian/Pac.Isl 68/5.5%11,201/14.5% 121/6.6% 8/5.1% Black 503/40.9%1,791/2.3% 656/35.5% 71/44.9% Hispanic 358/29.1%4,799/6.2% 456/24.7% 31/19.6% White 302/24.5%59,712/77.0% 614/33.2% 48/30.4% 14
  • 16.
    0% 10% 20% 30% 40% 50% 60% 70% Asian/Pac.Isl Black HispanicWhite Residential Population All Known Crime Suspects Known Violent Crime Suspects Persons Stopped 2,978 10,823 7,816 68,136   Reasonable Suspicion Stops  Arrests and Criminal Court Summonses Issued  Total Crime Complaints Radio Runs Reasonable Suspicion Stops‐ 2012 Midtown North Precinct (MTN) Total Reasonable Suspicion Stops= 2,978 Top Crime Suspected was GRAND LARCENY, accounting for  35.4%  of all stops. All Activity Race Residential Population Known Violent Crime  Suspects  Persons StoppedAll Known Crime  Suspects Asian/Pac.Isl 80/2.8%8,519/16.2% 245/5.3% 10/3.2% Black 1,520/52.3%2,648/5.0% 1,877/40.8% 167/52.7% Hispanic 815/28.0%8,583/16.4% 1,130/24.6% 88/27.8% White 493/17.0%32,743/62.4% 1,345/29.3% 52/16.4% 15
  • 17.
    0% 10% 20% 30% 40% 50% 60% 70% 80% 90% Asian/Pac.Isl Black HispanicWhite Residential Population All Known Crime Suspects Known Violent Crime Suspects Persons Stopped 4,652 11,658 6,295 68,995   Reasonable Suspicion Stops  Arrests and Criminal Court Summonses Issued  Total Crime Complaints Radio Runs Reasonable Suspicion Stops‐ 2012 19th Precinct Total Reasonable Suspicion Stops= 4,652 Top Crime Suspected was GRAND LARCENY, accounting for  28.0%  of all stops. All Activity Race Residential Population Known Violent Crime  Suspects  Persons StoppedAll Known Crime  Suspects Asian/Pac.Isl 187/4.2%16,727/8.2% 132/3.7% 9/3.2% Black 1,665/37.0%4,817/2.4% 1,560/43.6% 139/49.1% Hispanic 1,653/36.7%13,827/6.8% 827/23.1% 64/22.6% White 997/22.1%168,711/82.7% 1,062/29.7% 71/25.1% 16
  • 18.
    0% 10% 20% 30% 40% 50% 60% 70% 80% 90% Asian/Pac.Isl Black HispanicWhite Residential Population All Known Crime Suspects Known Violent Crime Suspects Persons Stopped 3,266 5,318 4,031 32,923   Reasonable Suspicion Stops  Arrests and Criminal Court Summonses Issued  Total Crime Complaints Radio Runs Reasonable Suspicion Stops‐ 2012 20th Precinct Total Reasonable Suspicion Stops= 3,266 Top Crime Suspected was GRAND LARCENY, accounting for  19.0%  of all stops. All Activity Race Residential Population Known Violent Crime  Suspects  Persons StoppedAll Known Crime  Suspects Asian/Pac.Isl 164/5.1%9,029/9.0% 76/3.6% 3/1.7% Black 1,322/41.3%3,902/3.9% 796/38.1% 82/47.7% Hispanic 935/29.2%8,662/8.6% 580/27.8% 60/34.9% White 779/24.3%78,749/78.5% 638/30.5% 27/15.7% 17
  • 19.
    0% 10% 20% 30% 40% 50% 60% Asian/Pac.Isl Black HispanicWhite Residential Population All Known Crime Suspects Known Violent Crime Suspects Persons Stopped 592 6,855 523 3,901   Reasonable Suspicion Stops  Arrests and Criminal Court Summonses Issued  Total Crime Complaints Radio Runs Reasonable Suspicion Stops‐ 2012 Central Park Precinct (CPP) Total Reasonable Suspicion Stops= 592 Top Crime Suspected was MARIJUANA POSSESSION, accounting for  29.1%  of all stops. All Activity Race Residential Population Known Violent Crime  Suspects  Persons StoppedAll Known Crime  Suspects Asian/Pac.Isl 28/4.8%0/0.0% 19/4.8% 0/0.0% Black 258/44.1%0/0.0% 143/36.2% 16/50.0% Hispanic 185/31.6%0/0.0% 101/25.6% 11/34.4% White 114/19.5%0/0.0% 132/33.4% 5/15.6% 18
  • 20.
    0% 10% 20% 30% 40% 50% 60% 70% Asian/Pac.Isl Black HispanicWhite Residential Population All Known Crime Suspects Known Violent Crime Suspects Persons Stopped 11,095 12,974 6,206 44,286   Reasonable Suspicion Stops  Arrests and Criminal Court Summonses Issued  Total Crime Complaints Radio Runs Reasonable Suspicion Stops‐ 2012 23rd Precinct Total Reasonable Suspicion Stops= 11,095 Top Crime Suspected was WEAPONS POSSESSION, accounting for  36.4%  of all stops. All Activity Race Residential Population Known Violent Crime  Suspects  Persons StoppedAll Known Crime  Suspects Asian/Pac.Isl 130/1.2%5,360/7.5% 42/0.8% 6/0.9% Black 6,861/63.3%18,191/25.5% 2,673/50.7% 386/57.4% Hispanic 3,601/33.2%36,740/51.5% 2,330/44.2% 271/40.3% White 242/2.2%11,050/15.5% 229/4.3% 9/1.3% 19
  • 21.
    0% 10% 20% 30% 40% 50% 60% 70% Asian/Pac.Isl Black HispanicWhite Residential Population All Known Crime Suspects Known Violent Crime Suspects Persons Stopped 4,218 7,185 4,778 38,497   Reasonable Suspicion Stops  Arrests and Criminal Court Summonses Issued  Total Crime Complaints Radio Runs Reasonable Suspicion Stops‐ 2012 24th Precinct Total Reasonable Suspicion Stops= 4,218 Top Crime Suspected was ROBBERY, accounting for  15.4%  of all stops. All Activity Race Residential Population Known Violent Crime  Suspects  Persons StoppedAll Known Crime  Suspects Asian/Pac.Isl 89/2.1%6,975/6.7% 47/1.5% 3/0.7% Black 2,069/49.9%11,979/11.6% 1,545/48.3% 237/56.3% Hispanic 1,529/36.9%22,738/21.9% 1,085/33.9% 140/33.3% White 459/11.1%61,970/59.8% 524/16.4% 41/9.7% 20
  • 22.
    0% 10% 20% 30% 40% 50% 60% 70% 80% Asian/Pac.Isl Black HispanicWhite Residential Population All Known Crime Suspects Known Violent Crime Suspects Persons Stopped 6,373 16,650 6,651 48,708   Reasonable Suspicion Stops  Arrests and Criminal Court Summonses Issued  Total Crime Complaints Radio Runs Reasonable Suspicion Stops‐ 2012 25th Precinct Total Reasonable Suspicion Stops= 6,373 Top Crime Suspected was WEAPONS POSSESSION, accounting for  30.0%  of all stops. All Activity Race Residential Population Known Violent Crime  Suspects  Persons StoppedAll Known Crime  Suspects Asian/Pac.Isl 53/0.9%1,294/2.8% 42/0.8% 1/0.2% Black 4,216/68.6%19,399/41.6% 3,411/61.5% 449/71.0% Hispanic 1,673/27.2%22,550/48.4% 1,806/32.5% 169/26.7% White 206/3.4%3,392/7.3% 290/5.2% 13/2.1% 21
  • 23.
    0% 10% 20% 30% 40% 50% 60% 70% 80% Asian/Pac.Isl Black HispanicWhite Residential Population All Known Crime Suspects Known Violent Crime Suspects Persons Stopped 5,488 7,632 3,501 24,749   Reasonable Suspicion Stops  Arrests and Criminal Court Summonses Issued  Total Crime Complaints Radio Runs Reasonable Suspicion Stops‐ 2012 26th Precinct Total Reasonable Suspicion Stops= 5,488 Top Crime Suspected was WEAPONS POSSESSION, accounting for  26.2%  of all stops. All Activity Race Residential Population Known Violent Crime  Suspects  Persons StoppedAll Known Crime  Suspects Asian/Pac.Isl 56/1.1%6,174/12.9% 39/1.4% 3/0.9% Black 3,718/70.4%10,006/20.9% 1,671/61.8% 220/69.4% Hispanic 1,289/24.4%12,428/26.0% 803/29.7% 83/26.2% White 216/4.1%19,198/40.2% 192/7.1% 11/3.5% 22
  • 24.
    0% 10% 20% 30% 40% 50% 60% 70% 80% 90% Asian/Pac.Isl Black HispanicWhite Residential Population All Known Crime Suspects Known Violent Crime Suspects Persons Stopped 6,707 11,748 5,083 39,884   Reasonable Suspicion Stops  Arrests and Criminal Court Summonses Issued  Total Crime Complaints Radio Runs Reasonable Suspicion Stops‐ 2012 28th Precinct Total Reasonable Suspicion Stops= 6,707 Top Crime Suspected was WEAPONS POSSESSION, accounting for  24.9%  of all stops. All Activity Race Residential Population Known Violent Crime  Suspects  Persons StoppedAll Known Crime  Suspects Asian/Pac.Isl 54/0.8%1,542/3.6% 32/0.7% 2/0.3% Black 5,308/80.1%25,150/58.3% 3,411/79.4% 472/82.2% Hispanic 1,055/15.9%9,421/21.8% 706/16.4% 89/15.5% White 211/3.2%7,060/16.4% 145/3.4% 11/1.9% 23
  • 25.
    0% 10% 20% 30% 40% 50% 60% 70% Asian/Pac.Isl Black HispanicWhite Residential Population All Known Crime Suspects Known Violent Crime Suspects Persons Stopped 6,169 9,712 4,926 32,632   Reasonable Suspicion Stops  Arrests and Criminal Court Summonses Issued  Total Crime Complaints Radio Runs Reasonable Suspicion Stops‐ 2012 30th Precinct Total Reasonable Suspicion Stops= 6,169 Top Crime Suspected was ROBBERY, accounting for  22.1%  of all stops. All Activity Race Residential Population Known Violent Crime  Suspects  Persons StoppedAll Known Crime  Suspects Asian/Pac.Isl 79/1.3%1,358/2.3% 50/1.2% 1/0.2% Black 2,759/46.3%17,103/28.8% 2,124/49.2% 338/56.6% Hispanic 2,960/49.6%34,674/58.5% 1,967/45.5% 250/41.9% White 164/2.8%6,187/10.4% 179/4.1% 8/1.3% 24
  • 26.
    0% 10% 20% 30% 40% 50% 60% 70% 80% 90% 100% Asian/Pac.Isl Black HispanicWhite Residential Population All Known Crime Suspects Known Violent Crime Suspects Persons Stopped 10,764 14,242 6,596 51,896   Reasonable Suspicion Stops  Arrests and Criminal Court Summonses Issued  Total Crime Complaints Radio Runs Reasonable Suspicion Stops‐ 2012 32nd Precinct Total Reasonable Suspicion Stops= 10,764 Top Crime Suspected was WEAPONS POSSESSION, accounting for  38.8%  of all stops. All Activity Race Residential Population Known Violent Crime  Suspects  Persons StoppedAll Known Crime  Suspects Asian/Pac.Isl 60/0.6%1,245/1.8% 31/0.6% 3/0.5% Black 9,113/86.9%47,708/68.9% 4,619/83.2% 545/84.9% Hispanic 1,143/10.9%16,271/23.5% 775/14.0% 89/13.9% White 172/1.6%3,990/5.8% 126/2.3% 5/0.8% 25
  • 27.
    0% 10% 20% 30% 40% 50% 60% 70% 80% Asian/Pac.Isl Black HispanicWhite Residential Population All Known Crime Suspects Known Violent Crime Suspects Persons Stopped 3,620 13,196 4,037 40,312   Reasonable Suspicion Stops  Arrests and Criminal Court Summonses Issued  Total Crime Complaints Radio Runs Reasonable Suspicion Stops‐ 2012 33rd Precinct Total Reasonable Suspicion Stops= 3,620 Top Crime Suspected was WEAPONS POSSESSION, accounting for  30.0%  of all stops. All Activity Race Residential Population Known Violent Crime  Suspects  Persons StoppedAll Known Crime  Suspects Asian/Pac.Isl 23/0.7%2,154/2.8% 27/1.0% 0/0.0% Black 794/22.7%8,592/11.3% 673/23.8% 95/20.7% Hispanic 2,519/72.0%57,057/75.2% 1,958/69.2% 347/75.6% White 161/4.6%8,073/10.6% 173/6.1% 17/3.7% 26
  • 28.
    0% 10% 20% 30% 40% 50% 60% 70% 80% 90% Asian/Pac.Isl Black HispanicWhite Residential Population All Known Crime Suspects Known Violent Crime Suspects Persons Stopped 9,675 19,832 5,161 52,758   Reasonable Suspicion Stops  Arrests and Criminal Court Summonses Issued  Total Crime Complaints Radio Runs Reasonable Suspicion Stops‐ 2012 34th Precinct Total Reasonable Suspicion Stops= 9,675 Top Crime Suspected was WEAPONS POSSESSION, accounting for  23.7%  of all stops. All Activity Race Residential Population Known Violent Crime  Suspects  Persons StoppedAll Known Crime  Suspects Asian/Pac.Isl 48/0.5%2,640/2.4% 24/0.7% 0/0.0% Black 871/9.8%5,362/4.8% 530/14.7% 84/15.6% Hispanic 7,615/85.4%77,919/70.0% 2,832/78.7% 441/81.7% White 384/4.3%25,369/22.8% 211/5.9% 15/2.8% 27
  • 29.
    52525252525252525252525252525252525252525252525252525252525252525252525252525252525252525252525252 47474747474747474747474747474747474747474747474747474747474747474747474747474747474747474747474747 52525252525252525252525252525252525252525252525252525252525252525252525252525252525252525252525252 47474747474747474747474747474747474747474747474747474747474747474747474747474747474747474747474747 40404040404040404040404040404040404040404040404040404040404040404040404040404040404040404040404040 41414141414141414141414141414141414141414141414141414141414141414141414141414141414141414141414141 4242424242424242424242424242424242424242424242424242424242424242424242424242424242424242424242424244444444444444444444444444444444444444444444444444444444444444444444444444444444444444444444444444 46464646464646464646464646464646464646464646464646464646464646464646464646464646464646464646464646 48484848484848484848484848484848484848484848484848484848484848484848484848484848484848484848484848 50505050505050505050505050505050505050505050505050505050505050505050505050505050505050505050505050 43434343434343434343434343434343434343434343434343434343434343434343434343434343434343434343434343 49494949494949494949494949494949494949494949494949494949494949494949494949494949494949494949494949 45454545454545454545454545454545454545454545454545454545454545454545454545454545454545454545454545 52525252525252525252525252525252525252525252525252525252525252525252525252525252525252525252525252 47474747474747474747474747474747474747474747474747474747474747474747474747474747474747474747474747 52525252525252525252525252525252525252525252525252525252525252525252525252525252525252525252525252 47474747474747474747474747474747474747474747474747474747474747474747474747474747474747474747474747 40404040404040404040404040404040404040404040404040404040404040404040404040404040404040404040404040 41414141414141414141414141414141414141414141414141414141414141414141414141414141414141414141414141 4242424242424242424242424242424242424242424242424242424242424242424242424242424242424242424242424244444444444444444444444444444444444444444444444444444444444444444444444444444444444444444444444444 46464646464646464646464646464646464646464646464646464646464646464646464646464646464646464646464646 48484848484848484848484848484848484848484848484848484848484848484848484848484848484848484848484848 50505050505050505050505050505050505050505050505050505050505050505050505050505050505050505050505050 43434343434343434343434343434343434343434343434343434343434343434343434343434343434343434343434343 49494949494949494949494949494949494949494949494949494949494949494949494949494949494949494949494949 45454545454545454545454545454545454545454545454545454545454545454545454545454545454545454545454545 Produced by theOffice of Manhagement Analysis and Planning - 1-23-13 BRONX PRECINCTSBRONX PRECINCTSBRONX PRECINCTSBRONX PRECINCTSBRONX PRECINCTSBRONX PRECINCTSBRONX PRECINCTSBRONX PRECINCTSBRONX PRECINCTSBRONX PRECINCTSBRONX PRECINCTSBRONX PRECINCTSBRONX PRECINCTSBRONX PRECINCTSBRONX PRECINCTSBRONX PRECINCTSBRONX PRECINCTSBRONX PRECINCTSBRONX PRECINCTSBRONX PRECINCTSBRONX PRECINCTSBRONX PRECINCTSBRONX PRECINCTSBRONX PRECINCTSBRONX PRECINCTSBRONX PRECINCTSBRONX PRECINCTSBRONX PRECINCTSBRONX PRECINCTSBRONX PRECINCTSBRONX PRECINCTSBRONX PRECINCTSBRONX PRECINCTSBRONX PRECINCTSBRONX PRECINCTSBRONX PRECINCTSBRONX PRECINCTSBRONX PRECINCTSBRONX PRECINCTSBRONX PRECINCTSBRONX PRECINCTSBRONX PRECINCTSBRONX PRECINCTSBRONX PRECINCTSBRONX PRECINCTSBRONX PRECINCTSBRONX PRECINCTSBRONX PRECINCTSBRONX PRECINCTS 28
  • 30.
    0% 10% 20% 30% 40% 50% 60% 70% 80% Asian/Pac.Isl Black HispanicWhite Residential Population All Known Crime Suspects Known Violent Crime Suspects Persons Stopped 18,276 31,508 11,696 86,913   Reasonable Suspicion Stops  Arrests and Criminal Court Summonses Issued  Total Crime Complaints Radio Runs Reasonable Suspicion Stops‐ 2012 40th Precinct Total Reasonable Suspicion Stops= 18,276 Top Crime Suspected was WEAPONS POSSESSION, accounting for  50.9%  of all stops. All Activity Race Residential Population Known Violent Crime  Suspects  Persons StoppedAll Known Crime  Suspects Asian/Pac.Isl 80/0.4%528/0.6% 36/0.4% 1/0.1% Black 9,284/51.7%23,701/26.2% 4,265/46.3% 530/56.4% Hispanic 8,384/46.7%64,882/71.7% 4,746/51.5% 402/42.8% White 220/1.2%1,438/1.6% 162/1.8% 7/0.7% 29
  • 31.
    0% 10% 20% 30% 40% 50% 60% 70% 80% Asian/Pac.Isl Black HispanicWhite Residential Population All Known Crime Suspects Known Violent Crime Suspects Persons Stopped 8,611 17,066 6,906 43,866   Reasonable Suspicion Stops  Arrests and Criminal Court Summonses Issued  Total Crime Complaints Radio Runs Reasonable Suspicion Stops‐ 2012 41st Precinct Total Reasonable Suspicion Stops= 8,611 Top Crime Suspected was WEAPONS POSSESSION, accounting for  33.4%  of all stops. All Activity Race Residential Population Known Violent Crime  Suspects  Persons StoppedAll Known Crime  Suspects Asian/Pac.Isl 73/0.9%312/0.6% 29/0.5% 3/0.3% Black 3,590/44.0%11,606/22.5% 2,722/45.2% 583/55.6% Hispanic 4,330/53.0%39,032/75.6% 3,098/51.5% 447/42.6% White 173/2.1%697/1.3% 170/2.8% 16/1.5% 30
  • 32.
    0% 10% 20% 30% 40% 50% 60% 70% 80% Asian/Pac.Isl Black HispanicWhite Residential Population All Known Crime Suspects Known Violent Crime Suspects Persons Stopped 7,761 14,082 7,530 60,887   Reasonable Suspicion Stops  Arrests and Criminal Court Summonses Issued  Total Crime Complaints Radio Runs Reasonable Suspicion Stops‐ 2012 42nd Precinct Total Reasonable Suspicion Stops= 7,761 Top Crime Suspected was WEAPONS POSSESSION, accounting for  51.7%  of all stops. All Activity Race Residential Population Known Violent Crime  Suspects  Persons StoppedAll Known Crime  Suspects Asian/Pac.Isl 43/0.6%375/0.5% 15/0.2% 4/0.5% Black 4,828/64.1%31,125/39.6% 3,576/58.3% 531/71.3% Hispanic 2,580/34.3%46,159/58.8% 2,464/40.2% 206/27.7% White 77/1.0%902/1.1% 81/1.3% 4/0.5% 31
  • 33.
    0% 10% 20% 30% 40% 50% 60% 70% Asian/Pac.Isl Black HispanicWhite Residential Population All Known Crime Suspects Known Violent Crime Suspects Persons Stopped 10,655 18,802 13,105 91,042   Reasonable Suspicion Stops  Arrests and Criminal Court Summonses Issued  Total Crime Complaints Radio Runs Reasonable Suspicion Stops‐ 2012 43rd Precinct Total Reasonable Suspicion Stops= 10,655 Top Crime Suspected was WEAPONS POSSESSION, accounting for  39.8%  of all stops. All Activity Race Residential Population Known Violent Crime  Suspects  Persons StoppedAll Known Crime  Suspects Asian/Pac.Isl 112/1.1%9,909/5.9% 149/1.4% 5/0.4% Black 5,114/49.8%53,052/31.8% 4,698/45.6% 767/57.6% Hispanic 4,822/46.9%99,234/59.4% 5,163/50.1% 540/40.6% White 225/2.2%4,764/2.9% 292/2.8% 19/1.4% 32
  • 34.
    0% 10% 20% 30% 40% 50% 60% 70% Asian/Pac.Isl Black HispanicWhite Residential Population All Known Crime Suspects Known Violent Crime Suspects Persons Stopped 15,414 23,763 12,713 89,733   Reasonable Suspicion Stops  Arrests and Criminal Court Summonses Issued  Total Crime Complaints Radio Runs Reasonable Suspicion Stops‐ 2012 44th Precinct Total Reasonable Suspicion Stops= 15,414 Top Crime Suspected was WEAPONS POSSESSION, accounting for  44.3%  of all stops. All Activity Race Residential Population Known Violent Crime  Suspects  Persons StoppedAll Known Crime  Suspects Asian/Pac.Isl 96/0.6%2,231/1.5% 45/0.4% 3/0.2% Black 7,525/50.9%47,850/33.0% 5,163/45.4% 657/48.9% Hispanic 6,921/46.8%92,916/64.0% 5,874/51.6% 662/49.3% White 237/1.6%2,194/1.5% 300/2.6% 22/1.6% 33
  • 35.
    0% 5% 10% 15% 20% 25% 30% 35% 40% 45% 50% Asian/Pac.Isl Black HispanicWhite Residential Population All Known Crime Suspects Known Violent Crime Suspects Persons Stopped 3,995 8,762 5,729 51,253   Reasonable Suspicion Stops  Arrests and Criminal Court Summonses Issued  Total Crime Complaints Radio Runs Reasonable Suspicion Stops‐ 2012 45th Precinct Total Reasonable Suspicion Stops= 3,995 Top Crime Suspected was ROBBERY, accounting for  26.3%  of all stops. All Activity Race Residential Population Known Violent Crime  Suspects  Persons StoppedAll Known Crime  Suspects Asian/Pac.Isl 67/1.7%5,457/4.6% 60/1.6% 4/0.8% Black 1,505/39.2%26,986/22.8% 1,350/36.5% 209/43.5% Hispanic 1,511/39.4%44,143/37.4% 1,490/40.3% 178/37.0% White 752/19.6%41,557/35.2% 794/21.5% 90/18.7% 34
  • 36.
    0% 10% 20% 30% 40% 50% 60% 70% 80% Asian/Pac.Isl Black HispanicWhite Residential Population All Known Crime Suspects Known Violent Crime Suspects Persons Stopped 5,628 17,768 9,651 81,445   Reasonable Suspicion Stops  Arrests and Criminal Court Summonses Issued  Total Crime Complaints Radio Runs Reasonable Suspicion Stops‐ 2012 46th Precinct Total Reasonable Suspicion Stops= 5,628 Top Crime Suspected was WEAPONS POSSESSION, accounting for  60.3%  of all stops. All Activity Race Residential Population Known Violent Crime  Suspects  Persons StoppedAll Known Crime  Suspects Asian/Pac.Isl 35/0.6%1,927/1.5% 53/0.6% 2/0.2% Black 2,461/44.2%36,108/28.8% 3,624/43.9% 536/53.7% Hispanic 3,006/54.0%85,280/68.1% 4,380/53.0% 455/45.6% White 64/1.1%1,844/1.5% 204/2.5% 5/0.5% 35
  • 37.
    0% 10% 20% 30% 40% 50% 60% 70% 80% 90% Asian/Pac.Isl Black HispanicWhite Residential Population All Known Crime Suspects Known Violent Crime Suspects Persons Stopped 8,948 14,926 9,079 81,564   Reasonable Suspicion Stops  Arrests and Criminal Court Summonses Issued  Total Crime Complaints Radio Runs Reasonable Suspicion Stops‐ 2012 47th Precinct Total Reasonable Suspicion Stops= 8,948 Top Crime Suspected was WEAPONS POSSESSION, accounting for  41.3%  of all stops. All Activity Race Residential Population Known Violent Crime  Suspects  Persons StoppedAll Known Crime  Suspects Asian/Pac.Isl 86/1.0%2,868/1.9% 56/0.8% 3/0.3% Black 6,647/76.5%98,349/66.7% 5,232/74.6% 931/82.5% Hispanic 1,754/20.2%35,313/24.0% 1,473/21.0% 178/15.8% White 204/2.3%10,860/7.4% 248/3.5% 17/1.5% 36
  • 38.
    0% 10% 20% 30% 40% 50% 60% 70% Asian/Pac.Isl Black HispanicWhite Residential Population All Known Crime Suspects Known Violent Crime Suspects Persons Stopped 5,430 13,413 7,801 65,897   Reasonable Suspicion Stops  Arrests and Criminal Court Summonses Issued  Total Crime Complaints Radio Runs Reasonable Suspicion Stops‐ 2012 48th Precinct Total Reasonable Suspicion Stops= 5,430 Top Crime Suspected was WEAPONS POSSESSION, accounting for  45.0%  of all stops. All Activity Race Residential Population Known Violent Crime  Suspects  Persons StoppedAll Known Crime  Suspects Asian/Pac.Isl 39/0.8%890/1.1% 41/0.6% 1/0.1% Black 2,295/45.4%21,995/26.8% 2,792/44.0% 541/51.4% Hispanic 2,524/49.9%53,383/65.1% 3,283/51.7% 481/45.7% White 197/3.9%5,787/7.1% 235/3.7% 30/2.8% 37
  • 39.
    0% 10% 20% 30% 40% 50% 60% Asian/Pac.Isl Black HispanicWhite Residential Population All Known Crime Suspects Known Violent Crime Suspects Persons Stopped 5,778 7,599 6,542 54,727   Reasonable Suspicion Stops  Arrests and Criminal Court Summonses Issued  Total Crime Complaints Radio Runs Reasonable Suspicion Stops‐ 2012 49th Precinct Total Reasonable Suspicion Stops= 5,778 Top Crime Suspected was WEAPONS POSSESSION, accounting for  36.7%  of all stops. All Activity Race Residential Population Known Violent Crime  Suspects  Persons StoppedAll Known Crime  Suspects Asian/Pac.Isl 94/1.7%8,705/7.7% 90/2.0% 6/0.9% Black 2,682/48.1%24,073/21.4% 1,934/43.9% 375/53.3% Hispanic 2,054/36.9%48,342/43.0% 1,823/41.4% 263/37.4% White 741/13.3%31,257/27.8% 560/12.7% 60/8.5% 38
  • 40.
    0% 10% 20% 30% 40% 50% 60% 70% Asian/Pac.Isl Black HispanicWhite Residential Population All Known Crime Suspects Known Violent Crime Suspects Persons Stopped 1,832 4,632 4,304 35,845   Reasonable Suspicion Stops  Arrests and Criminal Court Summonses Issued  Total Crime Complaints Radio Runs Reasonable Suspicion Stops‐ 2012 50th Precinct Total Reasonable Suspicion Stops= 1,832 Top Crime Suspected was WEAPONS POSSESSION, accounting for  19.5%  of all stops. All Activity Race Residential Population Known Violent Crime  Suspects  Persons StoppedAll Known Crime  Suspects Asian/Pac.Isl 32/1.8%4,980/5.0% 39/1.5% 0/0.0% Black 527/29.6%11,656/11.7% 730/28.4% 153/42.4% Hispanic 1,031/58.0%44,040/44.2% 1,417/55.2% 180/49.9% White 188/10.6%39,069/39.2% 382/14.9% 28/7.8% 39
  • 41.
    0% 10% 20% 30% 40% 50% 60% 70% Asian/Pac.Isl Black HispanicWhite Residential Population All Known Crime Suspects Known Violent Crime Suspects Persons Stopped 9,811 25,831 10,605 80,574   Reasonable Suspicion Stops  Arrests and Criminal Court Summonses Issued  Total Crime Complaints Radio Runs Reasonable Suspicion Stops‐ 2012 52nd Precinct Total Reasonable Suspicion Stops= 9,811 Top Crime Suspected was WEAPONS POSSESSION, accounting for  43.4%  of all stops. All Activity Race Residential Population Known Violent Crime  Suspects  Persons StoppedAll Known Crime  Suspects Asian/Pac.Isl 82/0.9%9,215/6.8% 93/1.2% 2/0.2% Black 3,098/32.8%25,808/18.9% 2,797/34.8% 457/43.8% Hispanic 5,989/63.4%90,755/66.6% 4,685/58.3% 555/53.2% White 271/2.9%10,518/7.7% 458/5.7% 29/2.8% 40
  • 42.
    90909090909090909090909090909090909090909090909090909090909090909090909090909090909090909090909090 94949494949494949494949494949494949494949494949494949494949494949494949494949494949494949494949494 84848484848484848484848484848484848484848484848484848484848484848484848484848484848484848484848484 88888888888888888888888888888888888888888888888888888888888888888888888888888888888888888888888888 79797979797979797979797979797979797979797979797979797979797979797979797979797979797979797979797979 81818181818181818181818181818181818181818181818181818181818181818181818181818181818181818181818181 83838383838383838383838383838383838383838383838383838383838383838383838383838383838383838383838383 75757575757575757575757575757575757575757575757575757575757575757575757575757575757575757575757575 77777777777777777777777777777777777777777777777777777777777777777777777777777777777777777777777777 73737373737373737373737373737373737373737373737373737373737373737373737373737373737373737373737373 76767676767676767676767676767676767676767676767676767676767676767676767676767676767676767676767676 78787878787878787878787878787878787878787878787878787878787878787878787878787878787878787878787878 72727272727272727272727272727272727272727272727272727272727272727272727272727272727272727272727272 71717171717171717171717171717171717171717171717171717171717171717171717171717171717171717171717171 68686868686868686868686868686868686868686868686868686868686868686868686868686868686868686868686868 62626262626262626262626262626262626262626262626262626262626262626262626262626262626262626262626262 66666666666666666666666666666666666666666666666666666666666666666666666666666666666666666666666666 60606060606060606060606060606060606060606060606060606060606060606060606060606060606060606060606060 70707070707070707070707070707070707070707070707070707070707070707070707070707070707070707070707070 67676767676767676767676767676767676767676767676767676767676767676767676767676767676767676767676767 61616161616161616161616161616161616161616161616161616161616161616161616161616161616161616161616161 63636363636363636363636363636363636363636363636363636363636363636363636363636363636363636363636363 69696969696969696969696969696969696969696969696969696969696969696969696969696969696969696969696969 Producedby the Office of Manhagement Analysis and Planning - 1-23-13 BROOKLYN PRECINCTSBROOKLYN PRECINCTSBROOKLYN PRECINCTSBROOKLYN PRECINCTSBROOKLYN PRECINCTSBROOKLYN PRECINCTSBROOKLYN PRECINCTSBROOKLYN PRECINCTSBROOKLYN PRECINCTSBROOKLYN PRECINCTSBROOKLYN PRECINCTSBROOKLYN PRECINCTSBROOKLYN PRECINCTSBROOKLYN PRECINCTSBROOKLYN PRECINCTSBROOKLYN PRECINCTSBROOKLYN PRECINCTSBROOKLYN PRECINCTSBROOKLYN PRECINCTSBROOKLYN PRECINCTSBROOKLYN PRECINCTSBROOKLYN PRECINCTSBROOKLYN PRECINCTSBROOKLYN PRECINCTSBROOKLYN PRECINCTSBROOKLYN PRECINCTSBROOKLYN PRECINCTSBROOKLYN PRECINCTSBROOKLYN PRECINCTSBROOKLYN PRECINCTSBROOKLYN PRECINCTSBROOKLYN PRECINCTSBROOKLYN PRECINCTSBROOKLYN PRECINCTSBROOKLYN PRECINCTSBROOKLYN PRECINCTSBROOKLYN PRECINCTSBROOKLYN PRECINCTSBROOKLYN PRECINCTSBROOKLYN PRECINCTSBROOKLYN PRECINCTSBROOKLYN PRECINCTSBROOKLYN PRECINCTSBROOKLYN PRECINCTSBROOKLYN PRECINCTSBROOKLYN PRECINCTSBROOKLYN PRECINCTSBROOKLYN PRECINCTSBROOKLYN PRECINCTS 41
  • 43.
    0% 10% 20% 30% 40% 50% 60% 70% Asian/Pac.Isl Black HispanicWhite Residential Population All Known Crime Suspects Known Violent Crime Suspects Persons Stopped 7,785 10,007 6,195 52,011   Reasonable Suspicion Stops  Arrests and Criminal Court Summonses Issued  Total Crime Complaints Radio Runs Reasonable Suspicion Stops‐ 2012 60th Precinct Total Reasonable Suspicion Stops= 7,785 Top Crime Suspected was WEAPONS POSSESSION, accounting for  22.4%  of all stops. All Activity Race Residential Population Known Violent Crime  Suspects  Persons StoppedAll Known Crime  Suspects Asian/Pac.Isl 172/2.3%12,027/11.7% 107/2.5% 14/2.0% Black 3,633/48.3%13,396/13.1% 2,032/48.4% 446/64.9% Hispanic 1,882/25.0%17,294/16.9% 847/20.2% 123/17.9% White 1,839/24.4%59,839/58.3% 1,215/28.9% 104/15.1% 42
  • 44.
    0% 10% 20% 30% 40% 50% 60% 70% 80% Asian/Pac.Isl Black HispanicWhite Residential Population All Known Crime Suspects Known Violent Crime Suspects Persons Stopped 6,690 8,253 6,161 63,689   Reasonable Suspicion Stops  Arrests and Criminal Court Summonses Issued  Total Crime Complaints Radio Runs Reasonable Suspicion Stops‐ 2012 61st Precinct Total Reasonable Suspicion Stops= 6,690 Top Crime Suspected was ROBBERY, accounting for  32.2%  of all stops. All Activity Race Residential Population Known Violent Crime  Suspects  Persons StoppedAll Known Crime  Suspects Asian/Pac.Isl 271/4.1%24,370/15.5% 137/3.4% 11/2.0% Black 1,734/26.1%5,301/3.4% 1,097/27.3% 240/43.7% Hispanic 1,234/18.5%13,048/8.3% 585/14.6% 103/18.8% White 3,417/51.3%114,291/72.8% 2,197/54.7% 195/35.5% 43
  • 45.
    0% 10% 20% 30% 40% 50% 60% Asian/Pac.Isl Black HispanicWhite Residential Population All Known Crime Suspects Known Violent Crime Suspects Persons Stopped 4,471 6,070 5,628 47,211   Reasonable Suspicion Stops  Arrests and Criminal Court Summonses Issued  Total Crime Complaints Radio Runs Reasonable Suspicion Stops‐ 2012 62nd Precinct Total Reasonable Suspicion Stops= 4,471 Top Crime Suspected was ROBBERY, accounting for  35.0%  of all stops. All Activity Race Residential Population Known Violent Crime  Suspects  Persons StoppedAll Known Crime  Suspects Asian/Pac.Isl 452/10.3%62,662/35.0% 255/7.7% 23/4.8% Black 386/8.8%1,357/0.8% 388/11.6% 126/26.5% Hispanic 1,338/30.4%24,189/13.5% 885/26.6% 125/26.3% White 2,225/50.6%90,917/50.8% 1,805/54.2% 202/42.4% 44
  • 46.
    0% 10% 20% 30% 40% 50% 60% 70% 80% 90% 100% Asian/Pac.Isl Black HispanicWhite Residential Population All Known Crime Suspects Known Violent Crime Suspects Persons Stopped 3,663 4,898 5,176 44,893   Reasonable Suspicion Stops  Arrests and Criminal Court Summonses Issued  Total Crime Complaints Radio Runs Reasonable Suspicion Stops‐ 2012 63rd Precinct Total Reasonable Suspicion Stops= 3,663 Top Crime Suspected was ROBBERY, accounting for  30.8%  of all stops. All Activity Race Residential Population Known Violent Crime  Suspects  Persons StoppedAll Known Crime  Suspects Asian/Pac.Isl 41/1.1%5,063/4.8% 57/1.7% 4/0.6% Black 2,764/76.5%46,130/43.5% 2,332/71.1% 545/86.0% Hispanic 234/6.5%9,222/8.7% 248/7.6% 40/6.3% White 574/15.9%45,673/43.1% 641/19.6% 45/7.1% 45
  • 47.
    0% 10% 20% 30% 40% 50% 60% 70% Asian/Pac.Isl Black HispanicWhite Residential Population All Known Crime Suspects Known Violent Crime Suspects Persons Stopped 3,435 4,275 4,852 51,884   Reasonable Suspicion Stops  Arrests and Criminal Court Summonses Issued  Total Crime Complaints Radio Runs Reasonable Suspicion Stops‐ 2012 66th Precinct Total Reasonable Suspicion Stops= 3,435 Top Crime Suspected was ROBBERY, accounting for  25.9%  of all stops. All Activity Race Residential Population Known Violent Crime  Suspects  Persons StoppedAll Known Crime  Suspects Asian/Pac.Isl 395/12.2%34,918/18.6% 367/12.8% 62/13.1% Black 368/11.4%4,158/2.2% 443/15.4% 124/26.3% Hispanic 1,637/50.6%25,154/13.4% 995/34.6% 200/42.4% White 834/25.8%123,907/65.9% 1,067/37.2% 86/18.2% 46
  • 48.
    0% 10% 20% 30% 40% 50% 60% 70% 80% 90% 100% Asian/Pac.Isl Black HispanicWhite Residential Population All Known Crime Suspects Known Violent Crime Suspects Persons Stopped 10,832 14,305 9,189 80,638   Reasonable Suspicion Stops  Arrests and Criminal Court Summonses Issued  Total Crime Complaints Radio Runs Reasonable Suspicion Stops‐ 2012 67th Precinct Total Reasonable Suspicion Stops= 10,832 Top Crime Suspected was WEAPONS POSSESSION, accounting for  33.5%  of all stops. All Activity Race Residential Population Known Violent Crime  Suspects  Persons StoppedAll Known Crime  Suspects Asian/Pac.Isl 148/1.4%1,750/1.2% 50/0.7% 4/0.3% Black 10,139/94.7%137,110/90.2% 7,037/93.6% 1,330/95.2% Hispanic 329/3.1%10,795/7.1% 350/4.7% 57/4.1% White 90/0.8%2,277/1.5% 85/1.1% 6/0.4% 47
  • 49.
    0% 10% 20% 30% 40% 50% 60% 70% Asian/Pac.Isl Black HispanicWhite Residential Population All Known Crime Suspects Known Violent Crime Suspects Persons Stopped 2,557 4,729 5,001 44,613   Reasonable Suspicion Stops  Arrests and Criminal Court Summonses Issued  Total Crime Complaints Radio Runs Reasonable Suspicion Stops‐ 2012 68th Precinct Total Reasonable Suspicion Stops= 2,557 Top Crime Suspected was BURGLARY, accounting for  22.6%  of all stops. All Activity Race Residential Population Known Violent Crime  Suspects  Persons StoppedAll Known Crime  Suspects Asian/Pac.Isl 169/6.7%25,359/20.8% 207/7.2% 15/5.7% Black 149/5.9%1,691/1.4% 253/8.8% 47/17.9% Hispanic 659/26.2%18,375/15.1% 720/25.1% 60/22.9% White 1,541/61.2%76,425/62.7% 1,692/58.9% 140/53.4% 48
  • 50.
    0% 20% 40% 60% 80% 100% 120% Asian/Pac.Isl Black HispanicWhite Residential Population All Known Crime Suspects Known Violent Crime Suspects Persons Stopped 5,369 5,780 5,175 42,004   Reasonable Suspicion Stops  Arrests and Criminal Court Summonses Issued  Total Crime Complaints Radio Runs Reasonable Suspicion Stops‐ 2012 69th Precinct Total Reasonable Suspicion Stops= 5,369 Top Crime Suspected was ROBBERY, accounting for  27.2%  of all stops. All Activity Race Residential Population Known Violent Crime  Suspects  Persons StoppedAll Known Crime  Suspects Asian/Pac.Isl 54/1.0%2,205/2.7% 31/0.8% 3/0.5% Black 4,843/90.5%68,440/82.8% 3,509/90.2% 532/95.7% Hispanic 350/6.5%7,030/8.5% 224/5.8% 17/3.1% White 102/1.9%4,943/6.0% 125/3.2% 4/0.7% 49
  • 51.
    0% 10% 20% 30% 40% 50% 60% 70% 80% 90% Asian/Pac.Isl Black HispanicWhite Residential Population All Known Crime Suspects Known Violent Crime Suspects Persons Stopped 11,248 11,530 7,782 78,795   Reasonable Suspicion Stops  Arrests and Criminal Court Summonses Issued  Total Crime Complaints Radio Runs Reasonable Suspicion Stops‐ 2012 70th Precinct Total Reasonable Suspicion Stops= 11,248 Top Crime Suspected was ROBBERY, accounting for  45.2%  of all stops. All Activity Race Residential Population Known Violent Crime  Suspects  Persons StoppedAll Known Crime  Suspects Asian/Pac.Isl 259/2.4%14,847/9.5% 193/3.5% 17/2.0% Black 8,056/75.0%57,447/36.6% 3,786/68.0% 658/77.8% Hispanic 1,598/14.9%24,865/15.8% 769/13.8% 112/13.2% White 824/7.7%59,757/38.1% 818/14.7% 59/7.0% 50
  • 52.
    0% 10% 20% 30% 40% 50% 60% 70% 80% 90% 100% Asian/Pac.Isl Black HispanicWhite Residential Population All Known Crime Suspects Known Violent Crime Suspects Persons Stopped 4,676 8,911 7,023 52,351   Reasonable Suspicion Stops  Arrests and Criminal Court Summonses Issued  Total Crime Complaints Radio Runs Reasonable Suspicion Stops‐ 2012 71st Precinct Total Reasonable Suspicion Stops= 4,676 Top Crime Suspected was WEAPONS POSSESSION, accounting for  26.2%  of all stops. All Activity Race Residential Population Known Violent Crime  Suspects  Persons StoppedAll Known Crime  Suspects Asian/Pac.Isl 37/0.8%1,190/1.2% 18/0.3% 2/0.3% Black 4,202/90.2%67,770/70.5% 4,525/87.9% 719/92.7% Hispanic 258/5.5%9,218/9.6% 361/7.0% 39/5.0% White 163/3.5%17,995/18.7% 244/4.7% 16/2.1% 51
  • 53.
    0% 10% 20% 30% 40% 50% 60% 70% 80% 90% Asian/Pac.Isl Black HispanicWhite Residential Population All Known Crime Suspects Known Violent Crime Suspects Persons Stopped 5,199 9,823 5,403 49,284   Reasonable Suspicion Stops  Arrests and Criminal Court Summonses Issued  Total Crime Complaints Radio Runs Reasonable Suspicion Stops‐ 2012 72nd Precinct Total Reasonable Suspicion Stops= 5,199 Top Crime Suspected was ROBBERY, accounting for  27.2%  of all stops. All Activity Race Residential Population Known Violent Crime  Suspects  Persons StoppedAll Known Crime  Suspects Asian/Pac.Isl 267/5.3%33,172/26.7% 356/10.0% 40/7.0% Black 488/9.6%3,959/3.2% 461/12.9% 116/20.2% Hispanic 3,892/76.6%56,799/45.7% 2,173/60.7% 375/65.4% White 431/8.5%30,258/24.4% 587/16.4% 42/7.3% 52
  • 54.
    0% 10% 20% 30% 40% 50% 60% 70% 80% 90% 100% Asian/Pac.Isl Black HispanicWhite Residential Population All Known Crime Suspects Known Violent Crime Suspects Persons Stopped 22,148 21,506 11,679 72,606   Reasonable Suspicion Stops  Arrests and Criminal Court Summonses Issued  Total Crime Complaints Radio Runs Reasonable Suspicion Stops‐ 2012 73rd Precinct Total Reasonable Suspicion Stops= 22,148 Top Crime Suspected was ROBBERY, accounting for  30.4%  of all stops. All Activity Race Residential Population Known Violent Crime  Suspects  Persons StoppedAll Known Crime  Suspects Asian/Pac.Isl 177/0.8%606/0.7% 38/0.4% 2/0.1% Black 19,067/88.1%66,019/77.9% 8,256/85.1% 1,200/88.8% Hispanic 2,203/10.2%17,263/20.4% 1,256/12.9% 142/10.5% White 201/0.9%874/1.0% 154/1.6% 7/0.5% 53
  • 55.
    0% 10% 20% 30% 40% 50% 60% 70% 80% 90% Asian/Pac.Isl Black HispanicWhite Residential Population All Known Crime Suspects Known Violent Crime Suspects Persons Stopped 24,408 28,831 17,034 113,411   Reasonable Suspicion Stops  Arrests and Criminal Court Summonses Issued  Total Crime Complaints Radio Runs Reasonable Suspicion Stops‐ 2012 75th Precinct Total Reasonable Suspicion Stops= 24,408 Top Crime Suspected was ROBBERY, accounting for  29.6%  of all stops. All Activity Race Residential Population Known Violent Crime  Suspects  Persons StoppedAll Known Crime  Suspects Asian/Pac.Isl 356/1.5%9,000/5.1% 212/1.6% 24/1.1% Black 17,884/75.4%94,636/53.5% 9,718/71.8% 1,620/77.5% Hispanic 5,049/21.3%67,135/37.9% 3,222/23.8% 431/20.6% White 419/1.8%6,241/3.5% 390/2.9% 15/0.7% 54
  • 56.
    0% 10% 20% 30% 40% 50% 60% 70% 80% Asian/Pac.Isl Black HispanicWhite Residential Population All Known Crime Suspects Known Violent Crime Suspects Persons Stopped 4,480 6,805 3,047 26,397   Reasonable Suspicion Stops  Arrests and Criminal Court Summonses Issued  Total Crime Complaints Radio Runs Reasonable Suspicion Stops‐ 2012 76th Precinct Total Reasonable Suspicion Stops= 4,480 Top Crime Suspected was ROBBERY, accounting for  25.8%  of all stops. All Activity Race Residential Population Known Violent Crime  Suspects  Persons StoppedAll Known Crime  Suspects Asian/Pac.Isl 107/2.5%2,042/4.8% 40/1.9% 3/1.0% Black 2,168/50.2%5,904/13.9% 1,181/54.6% 207/68.3% Hispanic 1,374/31.8%9,305/21.9% 577/26.7% 70/23.1% White 673/15.6%25,289/59.4% 364/16.8% 23/7.6% 55
  • 57.
    0% 10% 20% 30% 40% 50% 60% 70% 80% 90% 100% Asian/Pac.Isl Black HispanicWhite Residential Population All Known Crime Suspects Known Violent Crime Suspects Persons Stopped 9,934 13,657 7,847 56,721   Reasonable Suspicion Stops  Arrests and Criminal Court Summonses Issued  Total Crime Complaints Radio Runs Reasonable Suspicion Stops‐ 2012 77th Precinct Total Reasonable Suspicion Stops= 9,934 Top Crime Suspected was WEAPONS POSSESSION, accounting for  23.1%  of all stops. All Activity Race Residential Population Known Violent Crime  Suspects  Persons StoppedAll Known Crime  Suspects Asian/Pac.Isl 83/0.8%2,673/2.9% 29/0.5% 1/0.1% Black 8,703/88.4%62,313/66.8% 5,119/88.2% 729/91.8% Hispanic 738/7.5%11,324/12.1% 488/8.4% 51/6.4% White 321/3.3%16,933/18.2% 166/2.9% 13/1.6% 56
  • 58.
    0% 10% 20% 30% 40% 50% 60% 70% 80% Asian/Pac.Isl Black HispanicWhite Residential Population All Known Crime Suspects Known Violent Crime Suspects Persons Stopped 3,281 6,515 3,499 28,431   Reasonable Suspicion Stops  Arrests and Criminal Court Summonses Issued  Total Crime Complaints Radio Runs Reasonable Suspicion Stops‐ 2012 78th Precinct Total Reasonable Suspicion Stops= 3,281 Top Crime Suspected was ROBBERY, accounting for  31.0%  of all stops. All Activity Race Residential Population Known Violent Crime  Suspects  Persons StoppedAll Known Crime  Suspects Asian/Pac.Isl 48/1.5%3,533/6.0% 35/1.8% 4/1.2% Black 1,522/49.1%4,782/8.1% 1,097/55.1% 247/76.0% Hispanic 1,065/34.4%9,537/16.2% 477/24.0% 50/15.4% White 462/14.9%40,951/69.6% 382/19.2% 24/7.4% 57
  • 59.
    0% 10% 20% 30% 40% 50% 60% 70% 80% 90% Asian/Pac.Isl Black HispanicWhite Residential Population All Known Crime Suspects Known Violent Crime Suspects Persons Stopped 15,294 19,414 8,251 59,907   Reasonable Suspicion Stops  Arrests and Criminal Court Summonses Issued  Total Crime Complaints Radio Runs Reasonable Suspicion Stops‐ 2012 79th Precinct Total Reasonable Suspicion Stops= 15,294 Top Crime Suspected was WEAPONS POSSESSION, accounting for  26.2%  of all stops. All Activity Race Residential Population Known Violent Crime  Suspects  Persons StoppedAll Known Crime  Suspects Asian/Pac.Isl 151/1.0%2,302/2.6% 81/1.2% 8/0.7% Black 11,967/80.3%51,875/59.0% 5,155/79.1% 966/82.9% Hispanic 2,213/14.8%19,626/22.3% 1,037/15.9% 176/15.1% White 575/3.9%14,092/16.0% 241/3.7% 15/1.3% 58
  • 60.
    0% 10% 20% 30% 40% 50% 60% 70% 80% 90% 100% Asian/Pac.Isl Black HispanicWhite Residential Population All Known Crime Suspects Known Violent Crime Suspects Persons Stopped 9,709 10,811 6,744 42,455   Reasonable Suspicion Stops  Arrests and Criminal Court Summonses Issued  Total Crime Complaints Radio Runs Reasonable Suspicion Stops‐ 2012 81st Precinct Total Reasonable Suspicion Stops= 9,709 Top Crime Suspected was ROBBERY, accounting for  27.5%  of all stops. All Activity Race Residential Population Known Violent Crime  Suspects  Persons StoppedAll Known Crime  Suspects Asian/Pac.Isl 50/0.5%1,140/1.9% 38/0.7% 4/0.5% Black 8,184/87.8%47,163/76.9% 4,678/87.5% 741/91.6% Hispanic 896/9.6%10,821/17.6% 521/9.7% 60/7.4% White 186/2.0%2,243/3.7% 112/2.1% 4/0.5% 59
  • 61.
    0% 10% 20% 30% 40% 50% 60% 70% Asian/Pac.Isl Black HispanicWhite Residential Population All Known Crime Suspects Known Violent Crime Suspects Persons Stopped 11,811 14,648 7,051 61,150   Reasonable Suspicion Stops  Arrests and Criminal Court Summonses Issued  Total Crime Complaints Radio Runs Reasonable Suspicion Stops‐ 2012 83rd Precinct Total Reasonable Suspicion Stops= 11,811 Top Crime Suspected was ROBBERY, accounting for  43.2%  of all stops. All Activity Race Residential Population Known Violent Crime  Suspects  Persons StoppedAll Known Crime  Suspects Asian/Pac.Isl 116/1.0%4,776/4.3% 64/1.2% 8/0.7% Black 4,367/39.5%22,688/20.5% 2,284/42.6% 586/53.5% Hispanic 5,920/53.5%73,616/66.5% 2,707/50.5% 476/43.4% White 664/6.0%9,564/8.6% 305/5.7% 26/2.4% 60
  • 62.
    0% 10% 20% 30% 40% 50% 60% 70% 80% 90% Asian/Pac.Isl Black HispanicWhite Residential Population All Known Crime Suspects Known Violent Crime Suspects Persons Stopped 3,830 7,020 5,007 41,870   Reasonable Suspicion Stops  Arrests and Criminal Court Summonses Issued  Total Crime Complaints Radio Runs Reasonable Suspicion Stops‐ 2012 84th Precinct Total Reasonable Suspicion Stops= 3,830 Top Crime Suspected was ROBBERY, accounting for  14.0%  of all stops. All Activity Race Residential Population Known Violent Crime  Suspects  Persons StoppedAll Known Crime  Suspects Asian/Pac.Isl 125/3.3%4,393/9.4% 78/2.4% 11/2.8% Black 2,499/65.9%6,546/14.1% 2,185/67.5% 307/78.5% Hispanic 709/18.7%6,622/14.2% 582/18.0% 53/13.6% White 457/12.1%28,928/62.2% 391/12.1% 20/5.1% 61
  • 63.
    0% 10% 20% 30% 40% 50% 60% 70% 80% 90% 100% Asian/Pac.Isl Black HispanicWhite Residential Population All Known Crime Suspects Known Violent Crime Suspects Persons Stopped 5,948 6,766 5,087 34,074   Reasonable Suspicion Stops  Arrests and Criminal Court Summonses Issued  Total Crime Complaints Radio Runs Reasonable Suspicion Stops‐ 2012 88th Precinct Total Reasonable Suspicion Stops= 5,948 Top Crime Suspected was ROBBERY, accounting for  24.3%  of all stops. All Activity Race Residential Population Known Violent Crime  Suspects  Persons StoppedAll Known Crime  Suspects Asian/Pac.Isl 63/1.1%3,378/6.8% 53/1.5% 5/0.8% Black 4,458/77.7%21,395/43.3% 2,816/79.1% 526/86.8% Hispanic 786/13.7%8,012/16.2% 510/14.3% 68/11.2% White 429/7.5%16,592/33.6% 179/5.0% 7/1.2% 62
  • 64.
    0% 10% 20% 30% 40% 50% 60% Asian/Pac.Isl Black HispanicWhite Residential Population All Known Crime Suspects Known Violent Crime Suspects Persons Stopped 9,846 15,118 6,482 50,263   Reasonable Suspicion Stops  Arrests and Criminal Court Summonses Issued  Total Crime Complaints Radio Runs Reasonable Suspicion Stops‐ 2012 90th Precinct Total Reasonable Suspicion Stops= 9,846 Top Crime Suspected was ROBBERY, accounting for  31.5%  of all stops. All Activity Race Residential Population Known Violent Crime  Suspects  Persons StoppedAll Known Crime  Suspects Asian/Pac.Isl 120/1.2%5,483/4.8% 58/1.4% 5/0.6% Black 3,645/37.8%7,247/6.3% 1,553/37.2% 415/53.6% Hispanic 4,954/51.4%37,725/32.8% 2,032/48.7% 316/40.8% White 923/9.6%64,631/56.2% 529/12.7% 38/4.9% 63
  • 65.
    0% 10% 20% 30% 40% 50% 60% 70% 80% Asian/Pac.Isl Black HispanicWhite Residential Population All Known Crime Suspects Known Violent Crime Suspects Persons Stopped 2,092 5,651 3,524 27,198   Reasonable Suspicion Stops  Arrests and Criminal Court Summonses Issued  Total Crime Complaints Radio Runs Reasonable Suspicion Stops‐ 2012 94th Precinct Total Reasonable Suspicion Stops= 2,092 Top Crime Suspected was BURGLARY, accounting for  21.1%  of all stops. All Activity Race Residential Population Known Violent Crime  Suspects  Persons StoppedAll Known Crime  Suspects Asian/Pac.Isl 64/3.1%3,228/5.9% 58/2.9% 3/1.0% Black 509/24.9%1,735/3.2% 594/29.4% 138/47.9% Hispanic 639/31.2%9,283/16.9% 535/26.5% 74/25.7% White 836/40.8%40,680/74.1% 831/41.2% 73/25.3% 64
  • 66.
    105105105105105105105105105105105105105105105105105105105105105105105105105105105105105105105105105105105105105105105105105105105105105105105105105 114114114114114114114114114114114114114114114114114114114114114114114114114114114114114114114114114114114114114114114114114114114114114114114114114 115115115115115115115115115115115115115115115115115115115115115115115115115115115115115115115115115115115115115115115115115115115115115115115115115 108108108108108108108108108108108108108108108108108108108108108108108108108108108108108108108108108108108108108108108108108108108108108108108108108 110110110110110110110110110110110110110110110110110110110110110110110110110110110110110110110110110110110110110110110110110110110110110110110110110 104104104104104104104104104104104104104104104104104104104104104104104104104104104104104104104104104104104104104104104104104104104104104104104104104 112112112112112112112112112112112112112112112112112112112112112112112112112112112112112112112112112112112112112112112112112112112112112112112112112 109109109109109109109109109109109109109109109109109109109109109109109109109109109109109109109109109109109109109109109109109109109109109109109109109 111111111111111111111111111111111111111111111111111111111111111111111111111111111111111111111111111111111111111111111111111111111111111111111111111 105105105105105105105105105105105105105105105105105105105105105105105105105105105105105105105105105105105105105105105105105105105105105105105105105 102102102102102102102102102102102102102102102102102102102102102102102102102102102102102102102102102102102102102102102102102102102102102102102102102 107107107107107107107107107107107107107107107107107107107107107107107107107107107107107107107107107107107107107107107107107107107107107107107107107 106106106106106106106106106106106106106106106106106106106106106106106106106106106106106106106106106106106106106106106106106106106106106106106106106 103103103103103103103103103103103103103103103103103103103103103103103103103103103103103103103103103103103103103103103103103103103103103103103103103 100100100100100100100100100100100100100100100100100100100100100100100100100100100100100100100100100100100100100100100100100100100100100100100100100 101101101101101101101101101101101101101101101101101101101101101101101101101101101101101101101101101101101101101101101101101101101101101101101101101 Produced by theOffice of Manhagement Analysis and Planning - 1-23-13 QUEENS PRECINCTSQUEENS PRECINCTSQUEENS PRECINCTSQUEENS PRECINCTSQUEENS PRECINCTSQUEENS PRECINCTSQUEENS PRECINCTSQUEENS PRECINCTSQUEENS PRECINCTSQUEENS PRECINCTSQUEENS PRECINCTSQUEENS PRECINCTSQUEENS PRECINCTSQUEENS PRECINCTSQUEENS PRECINCTSQUEENS PRECINCTSQUEENS PRECINCTSQUEENS PRECINCTSQUEENS PRECINCTSQUEENS PRECINCTSQUEENS PRECINCTSQUEENS PRECINCTSQUEENS PRECINCTSQUEENS PRECINCTSQUEENS PRECINCTSQUEENS PRECINCTSQUEENS PRECINCTSQUEENS PRECINCTSQUEENS PRECINCTSQUEENS PRECINCTSQUEENS PRECINCTSQUEENS PRECINCTSQUEENS PRECINCTSQUEENS PRECINCTSQUEENS PRECINCTSQUEENS PRECINCTSQUEENS PRECINCTSQUEENS PRECINCTSQUEENS PRECINCTSQUEENS PRECINCTSQUEENS PRECINCTSQUEENS PRECINCTSQUEENS PRECINCTSQUEENS PRECINCTSQUEENS PRECINCTSQUEENS PRECINCTSQUEENS PRECINCTSQUEENS PRECINCTSQUEENS PRECINCTS 65
  • 67.
    0% 10% 20% 30% 40% 50% 60% 70% 80% Asian/Pac.Isl Black HispanicWhite Residential Population All Known Crime Suspects Known Violent Crime Suspects Persons Stopped 4,130 4,746 2,587 24,243   Reasonable Suspicion Stops  Arrests and Criminal Court Summonses Issued  Total Crime Complaints Radio Runs Reasonable Suspicion Stops‐ 2012 100th Precinct Total Reasonable Suspicion Stops= 4,130 Top Crime Suspected was BURGLARY, accounting for  29.6%  of all stops. All Activity Race Residential Population Known Violent Crime  Suspects  Persons StoppedAll Known Crime  Suspects Asian/Pac.Isl 103/2.5%1,320/2.8% 28/1.5% 1/0.4% Black 2,657/64.7%11,609/24.8% 1,012/55.3% 167/72.9% Hispanic 666/16.2%7,161/15.3% 319/17.4% 35/15.3% White 678/16.5%26,793/57.1% 472/25.8% 26/11.4% 66
  • 68.
    0% 10% 20% 30% 40% 50% 60% 70% 80% 90% 100% Asian/Pac.Isl Black HispanicWhite Residential Population All Known Crime Suspects Known Violent Crime Suspects Persons Stopped 9,770 7,880 4,021 37,384   Reasonable Suspicion Stops  Arrests and Criminal Court Summonses Issued  Total Crime Complaints Radio Runs Reasonable Suspicion Stops‐ 2012 101st Precinct Total Reasonable Suspicion Stops= 9,770 Top Crime Suspected was WEAPONS POSSESSION, accounting for  49.0%  of all stops. All Activity Race Residential Population Known Violent Crime  Suspects  Persons StoppedAll Known Crime  Suspects Asian/Pac.Isl 61/0.6%1,235/1.9% 31/1.0% 4/0.8% Black 8,430/88.0%33,054/50.9% 2,310/76.8% 384/80.2% Hispanic 969/10.1%16,941/26.1% 552/18.3% 82/17.1% White 118/1.2%13,666/21.1% 116/3.9% 9/1.9% 67
  • 69.
    0% 5% 10% 15% 20% 25% 30% 35% 40% 45% 50% Asian/Pac.Isl Black HispanicWhite Residential Population All Known Crime Suspects Known Violent Crime Suspects Persons Stopped 6,849 7,215 6,238 57,800   Reasonable Suspicion Stops  Arrests and Criminal Court Summonses Issued  Total Crime Complaints Radio Runs Reasonable Suspicion Stops‐ 2012 102nd Precinct Total Reasonable Suspicion Stops= 6,849 Top Crime Suspected was ROBBERY, accounting for  38.6%  of all stops. All Activity Race Residential Population Known Violent Crime  Suspects  Persons StoppedAll Known Crime  Suspects Asian/Pac.Isl 1,592/24.2%31,134/23.8% 1,015/24.6% 165/20.4% Black 1,398/21.3%12,027/9.2% 1,058/25.6% 343/42.5% Hispanic 3,027/46.1%58,865/45.1% 1,579/38.2% 239/29.6% White 554/8.4%28,578/21.9% 482/11.7% 61/7.5% 68
  • 70.
    0% 10% 20% 30% 40% 50% 60% 70% 80% Asian/Pac.Isl Black HispanicWhite Residential Population All Known Crime Suspects Known Violent Crime Suspects Persons Stopped 12,986 18,653 7,558 70,436   Reasonable Suspicion Stops  Arrests and Criminal Court Summonses Issued  Total Crime Complaints Radio Runs Reasonable Suspicion Stops‐ 2012 103rd Precinct Total Reasonable Suspicion Stops= 12,986 Top Crime Suspected was ROBBERY, accounting for  29.6%  of all stops. All Activity Race Residential Population Known Violent Crime  Suspects  Persons StoppedAll Known Crime  Suspects Asian/Pac.Isl 631/5.0%17,819/18.6% 444/7.7% 47/4.9% Black 8,850/70.5%45,855/47.9% 4,015/69.4% 728/75.5% Hispanic 2,720/21.7%28,865/30.1% 1,143/19.8% 179/18.6% White 345/2.7%3,287/3.4% 180/3.1% 10/1.0% 69
  • 71.
    0% 10% 20% 30% 40% 50% 60% 70% Asian/Pac.Isl Black HispanicWhite Residential Population All Known Crime Suspects Known Violent Crime Suspects Persons Stopped 4,893 8,440 8,321 58,852   Reasonable Suspicion Stops  Arrests and Criminal Court Summonses Issued  Total Crime Complaints Radio Runs Reasonable Suspicion Stops‐ 2012 104th Precinct Total Reasonable Suspicion Stops= 4,893 Top Crime Suspected was ROBBERY, accounting for  28.0%  of all stops. All Activity Race Residential Population Known Violent Crime  Suspects  Persons StoppedAll Known Crime  Suspects Asian/Pac.Isl 115/2.4%13,144/7.8% 117/2.4% 15/2.3% Black 534/11.1%2,373/1.4% 522/10.6% 142/21.4% Hispanic 2,866/59.4%58,932/35.1% 2,283/46.5% 349/52.6% White 1,307/27.1%93,396/55.6% 1,987/40.5% 158/23.8% 70
  • 72.
    0% 10% 20% 30% 40% 50% 60% 70% 80% 90% 100% Asian/Pac.Isl Black HispanicWhite Residential Population All Known Crime Suspects Known Violent Crime Suspects Persons Stopped 8,198 10,832 6,994 82,396   Reasonable Suspicion Stops  Arrests and Criminal Court Summonses Issued  Total Crime Complaints Radio Runs Reasonable Suspicion Stops‐ 2012 105th Precinct Total Reasonable Suspicion Stops= 8,198 Top Crime Suspected was GRAND LARCENY AUTO, accounting for  27.3%  of all stops. All Activity Race Residential Population Known Violent Crime  Suspects  Persons StoppedAll Known Crime  Suspects Asian/Pac.Isl 450/5.8%27,373/15.3% 298/6.6% 21/2.5% Black 6,196/79.4%104,502/58.4% 3,499/78.0% 729/87.7% Hispanic 773/9.9%22,413/12.5% 381/8.5% 59/7.1% White 387/5.0%24,602/13.8% 308/6.9% 22/2.6% 71
  • 73.
    0% 10% 20% 30% 40% 50% 60% Asian/Pac.Isl Black HispanicWhite Residential Population All Known Crime Suspects Known Violent Crime Suspects Persons Stopped 5,019 9,100 6,105 56,837   Reasonable Suspicion Stops  Arrests and Criminal Court Summonses Issued  Total Crime Complaints Radio Runs Reasonable Suspicion Stops‐ 2012 106th Precinct Total Reasonable Suspicion Stops= 5,019 Top Crime Suspected was ROBBERY, accounting for  43.3%  of all stops. All Activity Race Residential Population Known Violent Crime  Suspects  Persons StoppedAll Known Crime  Suspects Asian/Pac.Isl 1,446/29.9%22,368/21.6% 1,166/31.3% 130/19.8% Black 1,833/38.0%20,984/20.3% 1,155/31.0% 334/50.9% Hispanic 1,116/23.1%28,246/27.3% 838/22.5% 149/22.7% White 434/9.0%31,791/30.7% 570/15.3% 43/6.6% 72
  • 74.
    0% 10% 20% 30% 40% 50% 60% 70% Asian/Pac.Isl Black HispanicWhite Residential Population All Known Crime Suspects Known Violent Crime Suspects Persons Stopped 4,442 6,649 4,725 53,713   Reasonable Suspicion Stops  Arrests and Criminal Court Summonses Issued  Total Crime Complaints Radio Runs Reasonable Suspicion Stops‐ 2012 107th Precinct Total Reasonable Suspicion Stops= 4,442 Top Crime Suspected was ROBBERY, accounting for  33.7%  of all stops. All Activity Race Residential Population Known Violent Crime  Suspects  Persons StoppedAll Known Crime  Suspects Asian/Pac.Isl 502/11.9%46,880/32.5% 343/12.1% 49/8.9% Black 2,076/49.3%18,823/13.0% 1,291/45.5% 354/64.4% Hispanic 1,055/25.1%26,069/18.1% 624/22.0% 104/18.9% White 576/13.7%52,548/36.4% 579/20.4% 43/7.8% 73
  • 75.
    0% 10% 20% 30% 40% 50% 60% Asian/Pac.Isl Black HispanicWhite Residential Population All Known Crime Suspects Known Violent Crime Suspects Persons Stopped 4,096 5,296 4,837 50,213   Reasonable Suspicion Stops  Arrests and Criminal Court Summonses Issued  Total Crime Complaints Radio Runs Reasonable Suspicion Stops‐ 2012 108th Precinct Total Reasonable Suspicion Stops= 4,096 Top Crime Suspected was BURGLARY, accounting for  33.5%  of all stops. All Activity Race Residential Population Known Violent Crime  Suspects  Persons StoppedAll Known Crime  Suspects Asian/Pac.Isl 602/14.9%36,485/33.1% 339/13.1% 37/10.9% Black 537/13.3%2,138/1.9% 478/18.5% 87/25.7% Hispanic 2,222/55.1%38,994/35.4% 1,204/46.5% 179/53.0% White 673/16.7%32,448/29.5% 569/22.0% 35/10.4% 74
  • 76.
    0% 10% 20% 30% 40% 50% 60% Asian/Pac.Isl Black HispanicWhite Residential Population All Known Crime Suspects Known Violent Crime Suspects Persons Stopped 9,682 10,344 7,518 75,544   Reasonable Suspicion Stops  Arrests and Criminal Court Summonses Issued  Total Crime Complaints Radio Runs Reasonable Suspicion Stops‐ 2012 109th Precinct Total Reasonable Suspicion Stops= 9,682 Top Crime Suspected was ROBBERY, accounting for  35.1%  of all stops. All Activity Race Residential Population Known Violent Crime  Suspects  Persons StoppedAll Known Crime  Suspects Asian/Pac.Isl 2,022/21.3%122,403/50.5% 1,596/31.2% 192/27.3% Black 1,967/20.7%5,509/2.3% 920/18.0% 205/29.2% Hispanic 4,226/44.5%40,985/16.9% 1,548/30.3% 232/33.0% White 1,291/13.6%73,447/30.3% 1,053/20.6% 74/10.5% 75
  • 77.
    0% 10% 20% 30% 40% 50% 60% 70% 80% 90% 100% Asian/Pac.Isl Black HispanicWhite Residential Population All Known Crime Suspects Known Violent Crime Suspects Persons Stopped 9,090 14,802 6,639 62,278   Reasonable Suspicion Stops  Arrests and Criminal Court Summonses Issued  Total Crime Complaints Radio Runs Reasonable Suspicion Stops‐ 2012 110th Precinct Total Reasonable Suspicion Stops= 9,090 Top Crime Suspected was ROBBERY, accounting for  48.2%  of all stops. All Activity Race Residential Population Known Violent Crime  Suspects  Persons StoppedAll Known Crime  Suspects Asian/Pac.Isl 348/3.9%56,420/33.4% 482/9.5% 46/5.6% Black 542/6.0%9,277/5.5% 860/17.0% 162/19.6% Hispanic 7,850/87.2%90,954/53.8% 3,243/64.1% 562/67.9% White 261/2.9%12,300/7.3% 477/9.4% 58/7.0% 76
  • 78.
    0% 10% 20% 30% 40% 50% 60% Asian/Pac.Isl Black HispanicWhite Residential Population All Known Crime Suspects Known Violent Crime Suspects Persons Stopped 3,752 3,228 2,997 37,764   Reasonable Suspicion Stops  Arrests and Criminal Court Summonses Issued  Total Crime Complaints Radio Runs Reasonable Suspicion Stops‐ 2012 111th Precinct Total Reasonable Suspicion Stops= 3,752 Top Crime Suspected was BURGLARY, accounting for  35.1%  of all stops. All Activity Race Residential Population Known Violent Crime  Suspects  Persons StoppedAll Known Crime  Suspects Asian/Pac.Isl 674/18.4%45,621/39.8% 260/16.8% 27/14.9% Black 586/16.0%2,402/2.1% 290/18.7% 84/46.4% Hispanic 1,058/29.0%11,801/10.3% 354/22.9% 25/13.8% White 1,336/36.6%54,746/47.8% 644/41.6% 45/24.9% 77
  • 79.
    0% 10% 20% 30% 40% 50% 60% Asian/Pac.Isl Black HispanicWhite Residential Population All Known Crime Suspects Known Violent Crime Suspects Persons Stopped 2,799 4,771 3,641 38,713   Reasonable Suspicion Stops  Arrests and Criminal Court Summonses Issued  Total Crime Complaints Radio Runs Reasonable Suspicion Stops‐ 2012 112th Precinct Total Reasonable Suspicion Stops= 2,799 Top Crime Suspected was BURGLARY, accounting for  26.7%  of all stops. All Activity Race Residential Population Known Violent Crime  Suspects  Persons StoppedAll Known Crime  Suspects Asian/Pac.Isl 163/6.2%29,199/26.8% 168/8.2% 11/4.9% Black 611/23.2%2,789/2.6% 423/20.6% 83/37.2% Hispanic 944/35.9%15,097/13.9% 560/27.3% 63/28.3% White 914/34.7%61,897/56.8% 899/43.9% 66/29.6% 78
  • 80.
    0% 10% 20% 30% 40% 50% 60% 70% 80% 90% 100% Asian/Pac.Isl Black HispanicWhite Residential Population All Known Crime Suspects Known Violent Crime Suspects Persons Stopped 8,736 14,298 8,978 64,437   Reasonable Suspicion Stops  Arrests and Criminal Court Summonses Issued  Total Crime Complaints Radio Runs Reasonable Suspicion Stops‐ 2012 113th Precinct Total Reasonable Suspicion Stops= 8,736 Top Crime Suspected was WEAPONS POSSESSION, accounting for  27.2%  of all stops. All Activity Race Residential Population Known Violent Crime  Suspects  Persons StoppedAll Known Crime  Suspects Asian/Pac.Isl 227/2.6%2,562/2.2% 227/3.5% 19/1.9% Black 7,635/88.7%101,513/88.4% 5,248/81.0% 927/92.2% Hispanic 608/7.1%9,791/8.5% 664/10.3% 48/4.8% White 139/1.6%1,031/0.9% 337/5.2% 11/1.1% 79
  • 81.
    0% 5% 10% 15% 20% 25% 30% 35% 40% 45% 50% Asian/Pac.Isl Black HispanicWhite Residential Population All Known Crime Suspects Known Violent Crime Suspects Persons Stopped 8,464 13,691 9,035 79,176   Reasonable Suspicion Stops  Arrests and Criminal Court Summonses Issued  Total Crime Complaints Radio Runs Reasonable Suspicion Stops‐ 2012 114th Precinct Total Reasonable Suspicion Stops= 8,464 Top Crime Suspected was ROBBERY, accounting for  25.4%  of all stops. All Activity Race Residential Population Known Violent Crime  Suspects  Persons StoppedAll Known Crime  Suspects Asian/Pac.Isl 511/6.4%28,945/14.8% 428/7.4% 51/6.4% Black 2,889/36.3%21,019/10.7% 1,964/33.8% 380/47.6% Hispanic 3,132/39.4%54,439/27.8% 1,913/33.0% 269/33.7% White 1,420/17.9%91,527/46.7% 1,499/25.8% 99/12.4% 80
  • 82.
    0% 10% 20% 30% 40% 50% 60% 70% 80% 90% Asian/Pac.Isl Black HispanicWhite Residential Population All Known Crime Suspects Known Violent Crime Suspects Persons Stopped 8,068 19,946 7,445 61,942   Reasonable Suspicion Stops  Arrests and Criminal Court Summonses Issued  Total Crime Complaints Radio Runs Reasonable Suspicion Stops‐ 2012 115th Precinct Total Reasonable Suspicion Stops= 8,068 Top Crime Suspected was ROBBERY, accounting for  34.9%  of all stops. All Activity Race Residential Population Known Violent Crime  Suspects  Persons StoppedAll Known Crime  Suspects Asian/Pac.Isl 245/3.1%27,591/16.4% 288/5.4% 26/3.4% Black 859/10.9%10,494/6.2% 660/12.4% 133/17.6% Hispanic 6,463/82.1%109,691/65.2% 3,997/75.0% 572/75.9% White 308/3.9%20,452/12.2% 386/7.2% 23/3.1% 81
  • 83.
    No Window 120120120120120120120120120120120120120120120120120120120120120120120120120120120120120120120120120120120120120120120120120120120120120120120120120 122122122122122122122122122122122122122122122122122122122122122122122122122122122122122122122122122122122122122122122122122122122122122122122122122 123123123123123123123123123123123123123123123123123123123123123123123123123123123123123123123123123123123123123123123123123123123123123123123123123 Produced bythe Office of Manhagement Analysis and Planning - 1-23-13 STATEN ISLAND PRECINCTSSTATEN ISLAND PRECINCTSSTATEN ISLAND PRECINCTSSTATEN ISLAND PRECINCTSSTATEN ISLAND PRECINCTSSTATEN ISLAND PRECINCTSSTATEN ISLAND PRECINCTSSTATEN ISLAND PRECINCTSSTATEN ISLAND PRECINCTSSTATEN ISLAND PRECINCTSSTATEN ISLAND PRECINCTSSTATEN ISLAND PRECINCTSSTATEN ISLAND PRECINCTSSTATEN ISLAND PRECINCTSSTATEN ISLAND PRECINCTSSTATEN ISLAND PRECINCTSSTATEN ISLAND PRECINCTSSTATEN ISLAND PRECINCTSSTATEN ISLAND PRECINCTSSTATEN ISLAND PRECINCTSSTATEN ISLAND PRECINCTSSTATEN ISLAND PRECINCTSSTATEN ISLAND PRECINCTSSTATEN ISLAND PRECINCTSSTATEN ISLAND PRECINCTSSTATEN ISLAND PRECINCTSSTATEN ISLAND PRECINCTSSTATEN ISLAND PRECINCTSSTATEN ISLAND PRECINCTSSTATEN ISLAND PRECINCTSSTATEN ISLAND PRECINCTSSTATEN ISLAND PRECINCTSSTATEN ISLAND PRECINCTSSTATEN ISLAND PRECINCTSSTATEN ISLAND PRECINCTSSTATEN ISLAND PRECINCTSSTATEN ISLAND PRECINCTSSTATEN ISLAND PRECINCTSSTATEN ISLAND PRECINCTSSTATEN ISLAND PRECINCTSSTATEN ISLAND PRECINCTSSTATEN ISLAND PRECINCTSSTATEN ISLAND PRECINCTSSTATEN ISLAND PRECINCTSSTATEN ISLAND PRECINCTSSTATEN ISLAND PRECINCTSSTATEN ISLAND PRECINCTSSTATEN ISLAND PRECINCTSSTATEN ISLAND PRECINCTS 82
  • 84.
    0% 10% 20% 30% 40% 50% 60% 70% Asian/Pac.Isl Black HispanicWhite Residential Population All Known Crime Suspects Known Violent Crime Suspects Persons Stopped 12,368 16,907 11,787 90,882   Reasonable Suspicion Stops  Arrests and Criminal Court Summonses Issued  Total Crime Complaints Radio Runs Reasonable Suspicion Stops‐ 2012 120th Precinct Total Reasonable Suspicion Stops= 12,368 Top Crime Suspected was WEAPONS POSSESSION, accounting for  21.7%  of all stops. All Activity Race Residential Population Known Violent Crime  Suspects  Persons StoppedAll Known Crime  Suspects Asian/Pac.Isl 147/1.2%13,111/7.6% 88/1.1% 10/1.2% Black 7,176/59.3%38,621/22.5% 4,099/51.5% 530/61.0% Hispanic 3,042/25.1%50,065/29.2% 2,037/25.6% 210/24.2% White 1,745/14.4%69,591/40.6% 1,728/21.7% 119/13.7% 83
  • 85.
    0% 10% 20% 30% 40% 50% 60% 70% 80% 90% Asian/Pac.Isl Black HispanicWhite Residential Population All Known Crime Suspects Known Violent Crime Suspects Persons Stopped 6,420 7,982 8,432 73,738   Reasonable Suspicion Stops  Arrests and Criminal Court Summonses Issued  Total Crime Complaints Radio Runs Reasonable Suspicion Stops‐ 2012 122nd Precinct Total Reasonable Suspicion Stops= 6,420 Top Crime Suspected was BURGLARY, accounting for  29.6%  of all stops. All Activity Race Residential Population Known Violent Crime  Suspects  Persons StoppedAll Known Crime  Suspects Asian/Pac.Isl 136/2.2%17,101/8.9% 110/2.1% 2/0.6% Black 931/15.2%4,477/2.3% 931/17.9% 112/32.5% Hispanic 1,083/17.7%23,008/12.0% 778/15.0% 71/20.6% White 3,960/64.8%147,256/76.8% 3,382/65.0% 160/46.4% 84
  • 86.
    0% 10% 20% 30% 40% 50% 60% 70% 80% 90% 100% Asian/Pac.Isl Black HispanicWhite Residential Population All Known Crime Suspects Known Violent Crime Suspects Persons Stopped 1,940 3,280 3,123 26,278   Reasonable Suspicion Stops  Arrests and Criminal Court Summonses Issued  Total Crime Complaints Radio Runs Reasonable Suspicion Stops‐ 2012 123rd Precinct Total Reasonable Suspicion Stops= 1,940 Top Crime Suspected was BURGLARY, accounting for  26.2%  of all stops. All Activity Race Residential Population Known Violent Crime  Suspects  Persons StoppedAll Known Crime  Suspects Asian/Pac.Isl 31/1.6%4,485/4.6% 14/0.7% 0/0.0% Black 104/5.4%1,215/1.3% 131/6.6% 18/16.2% Hispanic 181/9.4%7,978/8.2% 177/8.9% 19/17.1% White 1,619/83.7%83,322/85.9% 1,659/83.7% 74/66.7% 85
  • 87.