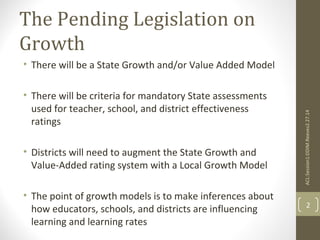
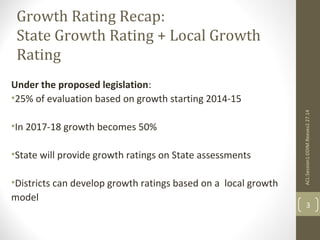
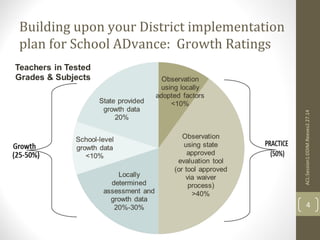
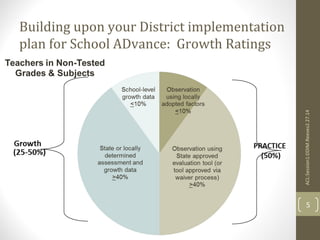
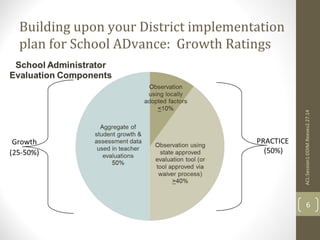
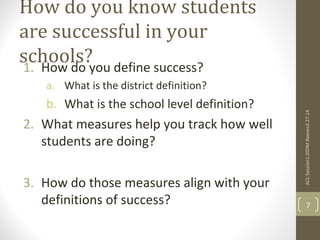
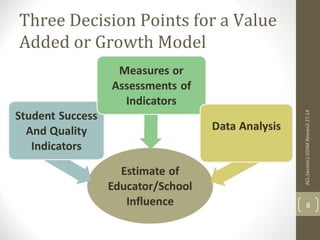
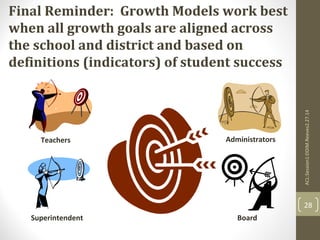
Making Inferences 
About Impact on 
Student Growth 
Dr. Patricia Reeves, Associate Professor Educational Leadership & Research 
Western Michigan University – February 2014 
Achievement Centered Leadership (ACL) Grant Project: Cohort 1 – Session 1 
ACL:Session1:DDIM.Reeves2.27.14 
1
The Pending Legislation on 
Growth 
• There will be a State Growth and/or Value Added Model 
• There will be criteria for mandatory State assessments 
used for teacher, school, and district effectiveness 
ratings 
• Districts will need to augment the State Growth and 
Value-Added rating system with a Local Growth Model 
• The point of growth models is to make inferences about 
how educators, schools, and districts are influencing 
learning and learning rates 
ACL:Session1:DDIM.Reeves2.27.14 
2
Growth Rating Recap: 
State Growth Rating + Local Growth 
Rating 
Under the proposed legislation: 
•25% of evaluation based on growth starting 2014-15 
•In 2017-18 growth becomes 50% 
•State will provide growth ratings on State assessments 
•Districts can develop growth ratings based on a local growth 
model 
ACL:Session1:DDIM.Reeves2.27.14 
3
Building upon your District implementation 
plan for School ADvance: Growth Ratings 
ACL:Session1:DDIM.Reeves2.27.14 
4
Building upon your District implementation 
plan for School ADvance: Growth Ratings 
ACL:Session1:DDIM.Reeves2.27.14 
5
Building upon your District implementation 
plan for School ADvance: Growth Ratings 
ACL:Session1:DDIM.Reeves2.27.14 
6
How do you know students 
are successful in your 
schools? 1. How do you define success? 
a. What is the district definition? 
b. What is the school level definition? 
2. What measures help you track how well 
students are doing? 
3. How do those measures align with your 
ACL:Session1:DDIM.Reeves2.27.14 
definitions of success? 7
Three Decision Points for a Value 
Added or Growth Model 
ACL:Session1:DDIM.Reeves2.27.14 
8
Influences on Student 
Learning 
ACL:Session1:DDIM.Reeves2.27.14 
9
Assessing School, Teacher, and 
Administrator Influence on 
Growth 
ACL:Session1:DDIM.Reeves2.27.14 
10
Developing a Local Growth 
Model 
1.What indicators and measures have you been using to 
evaluate teachers’ and administrators’ performance? 
2.How well aligned are those indicators with your school 
improvement plan and the district improvement plan? 
3.How well aligned are they with your definition of student 
success? 
ACL:Session1:DDIM.Reeves2.27.14 
11
Regardless of students’ entering 
achievement levels, growth is: 
KEEPING THEM MOVING UP AND EXPANDING: 
Goal is to either maintain or accelerate growth 
rates if at, or above, target achievement levels to 
stay ahead of a success track (e.g. hitting 3rd, 7th/8th, 
and 11th Grade targets) and to branch out. 
ACL:Session1:DDIM.Reeves2.27.14 
12 
MAKING SURE THEY KEEP UP: Goal is to maintain 
or accelerate the growth rates if at, or above, 
target achievement levels to stay on a success 
track (e.g. hitting 3rd, 7th/8th, and 11th Grade 
targets). 
MOVING THEM UP: Goal is to accelerate growth rates 
until these students are also on target to reach 
achievement targets by certain grades in order to get 
on a success track (e.g. hitting 3rd, 7th/8th, and 11th Grade 
targets). 
Higher 
Middle 
Lower
The Point of Growth Models 
• How are we doing at ensuring that our higher academic 
performers are continuing to MOVE UP and branch out*? 
• How are we doing at ensuring that our middle academic 
performers (the majority of our students) are continuing to 
either KEEP UP or MOVE UP and branch out*? 
• How are we doing at ensuring that our lowest performers are 
on track to CATCH UP? 
*Branch out means to expand development in other academic 
and/or non-academic indicators of student success, e.g. the arts, 
community service, athletics, and non-core curricular subjects 
(languages, logic, philosophy, social sciences, etc.) 
ACL:Session1:DDIM.Reeves2.27.14 
13
3 Common approaches for creating growth ratings 
Performance Status 
(descriptive stat models) 
Value-Added Models or VAM 
(linear stat models) 
Growth to Proficiency Models 
(curvi-linear stat models) 
Compares performance status of 
each student to fixed performance 
targets (e.g. proficiency level or X 
amount of pre-post growth). 
Ignores differences in student 
growth rates and differences in 
student background. 
Teachers rated on # or % of 
students achieving targets – based 
on either proficiency levels or 
growth levels. 
Teacher information shows where 
each student performed in 
relation to performance targets 
for that year. 
Compares growth of students to 
their academic peers and then 
compares groups of students to 
other groups of students by 
teacher. 
Often controls for differences in 
student background. 
Teachers rated on teacher to 
teacher comparisons of 
student growth by academic peer 
group or aggregate groups. 
Teacher information shows how 
each teacher’s class grew 
compared to other teachers’ 
classes for that year, either by 
whole comparison group or sub-groups 
(e.g. low SES, ESL, etc.) 
Compares growth of each student 
to growth of that student’s 
academic history and academic 
peers (i.e. students with the same 
performance history). 
ACL:Session1:DDIM.Reeves2.27.14 14 
Does not need to control for 
differences in student background 
because teachers not compared to 
one another. 
Teachers rated on how they are 
moving students toward growth 
targets; i.e. catching up, keeping 
up, moving up. 
Teacher information shows how 
each student is growing compared 
to growth targets for their 
academic peer group based on 
rate of growth needed to reach 
performance targets over several 
grades.
The Logic of a 
Local Growth Model 
Actual 
Achievement 
Projected 
Achievement 
Value-added 
Growth 
Instruction 
Individual Student Past Performance 
ACL:Session1:DDIM.Reeves2.27.14 
15
Growth & Value Added 
Value-Added 
Ratings 
Changes in student 
achievement and other success 
indicators across time 
Estimations of 
Teacher and 
school influence 
ACL:Session1:DDIM.Reeves2.27.14 16
Value-Added Models: 
How they work 
Pre-Test 
YEAR 1 
Post-Test 
YEAR 2 
Actual student 
scale score 
VALUE ADDED 
Predicted student 
scale score 
Student scale 
score 
Based on 
observationally 
similar students 
ACL:Session1:DDIM.Reeves2.27.14 17
Visualization with a SGP Model 
Each student 
plotted against a 
backdrop of 
typical growth 
and status 
ACL:Session1:DDIM.Reeves2.27.14 18
Individual Student Monitoring and 
RTI with a SGP Model 
ACL:Session1:DDIM.Reeves2.27.14 19
Setting Growth Standards 
Higher Than Expected 
Value-added 
Growth 
Growth 
Thresholds 
Expected Growth 
Lower Than Expected 
Unsatisfactory Growth 
Evaluation 
Categories 
Highly Effective 
Effective 
Needs Improvement 
Unsatisfactory 
ACL:Session1:DDIM.Reeves2.27.14 20
Teacher Evaluation Example with a 
SGP Model 
LGMs can 
create a single 
comparable 
growth metric 
across all tests. 
ACL:Session1:DDIM.Reeves2.27.14 21
Growth to proficiency SGM 
Sets yearly targets that will put low-achievers on pace 
to meet proficient and narrow achievement gaps 
Growth targets 
(based on proficient by grade 7) 
ACL:Session1:DDIM.Reeves2.27.14 22
Processing the Challenge of Rating 
Individual Teachers and Administrators 
on Student Growth 
1. With your district team, discuss what measures you are 
using now to determine how teachers are influencing 
student growth 
2. How are you analyzing the data to determine a value-added 
rating? 
3. Where do you think you need to go from here? 
4. What conversations will you have back in your district? 
ACL:Session1:DDIM.Reeves2.27.14 23
A tale of 2 teachers 
One has an Effective Rating 
The other, 
a Highly Effective Rating 
ACL:Session1:DDIM.Reeves2.27.14 
24
Reminder: Three Purposes for 
Performance Evaluation 
1. Achieve Organizational Goals, i.e. Student 
Outcomes 
2. Guide the learning, growth, and development of 
personnel, e.g. teachers and leaders 
3. Make decisions about hiring, placement, 
retention, promotion, and compensation 
ACL:Session1:DDIM.Reeves2.27.14 
25
Three Purposes for 
Performance Evaluation 
1. Achieve Organizational Goals, i.e. Student 
Outcomes 
2. Guide the learning, growth, and development 
of personnel, e.g. teachers and leaders 
3. Make decisions about hiring, placement, 
retention, promotion, and compensation 
26
Reminders: 
1. We can follow student success by identifying 
success indicators and measuring growth toward 
established performance standards and beyond 
2. We can grow student success by analyzing growth 
rates and intervening where/how needed with 
evidence based practices (strategies) 
3. We can grow teacher, administrator, school and 
district performance by assessing both practice 
and results (i.e. student growth) and setting 
improvement goals accordingly 
ACL:Session1:DDIM.Reeves2.27.14 
27
Final Reminder: Growth Models work best 
when all growth goals are aligned across 
the school and district and based on 
definitions (indicators) of student success 
ACL:Session1:DDIM.Reeves2.27.14 
28 
Teachers Administrators 
Superintendent Board

Student Growth Inferences

  • 1.
    Making Inferences AboutImpact on Student Growth Dr. Patricia Reeves, Associate Professor Educational Leadership & Research Western Michigan University – February 2014 Achievement Centered Leadership (ACL) Grant Project: Cohort 1 – Session 1 ACL:Session1:DDIM.Reeves2.27.14 1
  • 2.
    The Pending Legislationon Growth • There will be a State Growth and/or Value Added Model • There will be criteria for mandatory State assessments used for teacher, school, and district effectiveness ratings • Districts will need to augment the State Growth and Value-Added rating system with a Local Growth Model • The point of growth models is to make inferences about how educators, schools, and districts are influencing learning and learning rates ACL:Session1:DDIM.Reeves2.27.14 2
  • 3.
    Growth Rating Recap: State Growth Rating + Local Growth Rating Under the proposed legislation: •25% of evaluation based on growth starting 2014-15 •In 2017-18 growth becomes 50% •State will provide growth ratings on State assessments •Districts can develop growth ratings based on a local growth model ACL:Session1:DDIM.Reeves2.27.14 3
  • 4.
    Building upon yourDistrict implementation plan for School ADvance: Growth Ratings ACL:Session1:DDIM.Reeves2.27.14 4
  • 5.
    Building upon yourDistrict implementation plan for School ADvance: Growth Ratings ACL:Session1:DDIM.Reeves2.27.14 5
  • 6.
    Building upon yourDistrict implementation plan for School ADvance: Growth Ratings ACL:Session1:DDIM.Reeves2.27.14 6
  • 7.
    How do youknow students are successful in your schools? 1. How do you define success? a. What is the district definition? b. What is the school level definition? 2. What measures help you track how well students are doing? 3. How do those measures align with your ACL:Session1:DDIM.Reeves2.27.14 definitions of success? 7
  • 8.
    Three Decision Pointsfor a Value Added or Growth Model ACL:Session1:DDIM.Reeves2.27.14 8
  • 9.
    Influences on Student Learning ACL:Session1:DDIM.Reeves2.27.14 9
  • 10.
    Assessing School, Teacher,and Administrator Influence on Growth ACL:Session1:DDIM.Reeves2.27.14 10
  • 11.
    Developing a LocalGrowth Model 1.What indicators and measures have you been using to evaluate teachers’ and administrators’ performance? 2.How well aligned are those indicators with your school improvement plan and the district improvement plan? 3.How well aligned are they with your definition of student success? ACL:Session1:DDIM.Reeves2.27.14 11
  • 12.
    Regardless of students’entering achievement levels, growth is: KEEPING THEM MOVING UP AND EXPANDING: Goal is to either maintain or accelerate growth rates if at, or above, target achievement levels to stay ahead of a success track (e.g. hitting 3rd, 7th/8th, and 11th Grade targets) and to branch out. ACL:Session1:DDIM.Reeves2.27.14 12 MAKING SURE THEY KEEP UP: Goal is to maintain or accelerate the growth rates if at, or above, target achievement levels to stay on a success track (e.g. hitting 3rd, 7th/8th, and 11th Grade targets). MOVING THEM UP: Goal is to accelerate growth rates until these students are also on target to reach achievement targets by certain grades in order to get on a success track (e.g. hitting 3rd, 7th/8th, and 11th Grade targets). Higher Middle Lower
  • 13.
    The Point ofGrowth Models • How are we doing at ensuring that our higher academic performers are continuing to MOVE UP and branch out*? • How are we doing at ensuring that our middle academic performers (the majority of our students) are continuing to either KEEP UP or MOVE UP and branch out*? • How are we doing at ensuring that our lowest performers are on track to CATCH UP? *Branch out means to expand development in other academic and/or non-academic indicators of student success, e.g. the arts, community service, athletics, and non-core curricular subjects (languages, logic, philosophy, social sciences, etc.) ACL:Session1:DDIM.Reeves2.27.14 13
  • 14.
    3 Common approachesfor creating growth ratings Performance Status (descriptive stat models) Value-Added Models or VAM (linear stat models) Growth to Proficiency Models (curvi-linear stat models) Compares performance status of each student to fixed performance targets (e.g. proficiency level or X amount of pre-post growth). Ignores differences in student growth rates and differences in student background. Teachers rated on # or % of students achieving targets – based on either proficiency levels or growth levels. Teacher information shows where each student performed in relation to performance targets for that year. Compares growth of students to their academic peers and then compares groups of students to other groups of students by teacher. Often controls for differences in student background. Teachers rated on teacher to teacher comparisons of student growth by academic peer group or aggregate groups. Teacher information shows how each teacher’s class grew compared to other teachers’ classes for that year, either by whole comparison group or sub-groups (e.g. low SES, ESL, etc.) Compares growth of each student to growth of that student’s academic history and academic peers (i.e. students with the same performance history). ACL:Session1:DDIM.Reeves2.27.14 14 Does not need to control for differences in student background because teachers not compared to one another. Teachers rated on how they are moving students toward growth targets; i.e. catching up, keeping up, moving up. Teacher information shows how each student is growing compared to growth targets for their academic peer group based on rate of growth needed to reach performance targets over several grades.
  • 15.
    The Logic ofa Local Growth Model Actual Achievement Projected Achievement Value-added Growth Instruction Individual Student Past Performance ACL:Session1:DDIM.Reeves2.27.14 15
  • 16.
    Growth & ValueAdded Value-Added Ratings Changes in student achievement and other success indicators across time Estimations of Teacher and school influence ACL:Session1:DDIM.Reeves2.27.14 16
  • 17.
    Value-Added Models: Howthey work Pre-Test YEAR 1 Post-Test YEAR 2 Actual student scale score VALUE ADDED Predicted student scale score Student scale score Based on observationally similar students ACL:Session1:DDIM.Reeves2.27.14 17
  • 18.
    Visualization with aSGP Model Each student plotted against a backdrop of typical growth and status ACL:Session1:DDIM.Reeves2.27.14 18
  • 19.
    Individual Student Monitoringand RTI with a SGP Model ACL:Session1:DDIM.Reeves2.27.14 19
  • 20.
    Setting Growth Standards Higher Than Expected Value-added Growth Growth Thresholds Expected Growth Lower Than Expected Unsatisfactory Growth Evaluation Categories Highly Effective Effective Needs Improvement Unsatisfactory ACL:Session1:DDIM.Reeves2.27.14 20
  • 21.
    Teacher Evaluation Examplewith a SGP Model LGMs can create a single comparable growth metric across all tests. ACL:Session1:DDIM.Reeves2.27.14 21
  • 22.
    Growth to proficiencySGM Sets yearly targets that will put low-achievers on pace to meet proficient and narrow achievement gaps Growth targets (based on proficient by grade 7) ACL:Session1:DDIM.Reeves2.27.14 22
  • 23.
    Processing the Challengeof Rating Individual Teachers and Administrators on Student Growth 1. With your district team, discuss what measures you are using now to determine how teachers are influencing student growth 2. How are you analyzing the data to determine a value-added rating? 3. Where do you think you need to go from here? 4. What conversations will you have back in your district? ACL:Session1:DDIM.Reeves2.27.14 23
  • 24.
    A tale of2 teachers One has an Effective Rating The other, a Highly Effective Rating ACL:Session1:DDIM.Reeves2.27.14 24
  • 25.
    Reminder: Three Purposesfor Performance Evaluation 1. Achieve Organizational Goals, i.e. Student Outcomes 2. Guide the learning, growth, and development of personnel, e.g. teachers and leaders 3. Make decisions about hiring, placement, retention, promotion, and compensation ACL:Session1:DDIM.Reeves2.27.14 25
  • 26.
    Three Purposes for Performance Evaluation 1. Achieve Organizational Goals, i.e. Student Outcomes 2. Guide the learning, growth, and development of personnel, e.g. teachers and leaders 3. Make decisions about hiring, placement, retention, promotion, and compensation 26
  • 27.
    Reminders: 1. Wecan follow student success by identifying success indicators and measuring growth toward established performance standards and beyond 2. We can grow student success by analyzing growth rates and intervening where/how needed with evidence based practices (strategies) 3. We can grow teacher, administrator, school and district performance by assessing both practice and results (i.e. student growth) and setting improvement goals accordingly ACL:Session1:DDIM.Reeves2.27.14 27
  • 28.
    Final Reminder: GrowthModels work best when all growth goals are aligned across the school and district and based on definitions (indicators) of student success ACL:Session1:DDIM.Reeves2.27.14 28 Teachers Administrators Superintendent Board

Editor's Notes

  • #3 Revisiting the legislation to understand how districts will need to address Growth (i.e. Results)
  • #4 The pending legislation would phase in the percentage of a teacher’s or administrator’s evaluation rating that must be based on growth. For the 2014-15 through the 2016-17 academic years, this percentage would set at and remain at 25%, with as much as 60% of that based on the Local Growth Model
  • #5 Here is what the breakdown of how both the Growth portion and the Practice portion of a performance rating for teachers will look in 2017-18 when the new legislation takes full effect.
  • #6 Here is what the breakdown of how both the Growth portion and the Practice portion of a performance rating for teachers will look in 2017-18 when the new legislation takes full effect.
  • #7 And here is what it will look like for administrators, including the superintendent
  • #9 It is important to separate in our minds the parts of a growth model First a district must identify what indicators of student success they wish to track on an ongoing basis Second, the district must identify the measures that will allow them to track those indicators Third, the district must decide how the data from those measures will be analyzed to: (a) establish priority growth goals; (b) measure growth; and (c) make estimates of how teachers, administrators, and the superintendent are influencing that growth
  • #10 Estimating influence on growth can be tricky because there are so many factors that are associated with how and at what rates students grow. These are the major categories of those factors. The trick is to come up with a process of data analysis that factors out non-school based influences.
  • #11 The most commonly accepted approach to isolating growth that is actually influenced by the schools through the work of teachers and administrators uses the three types of analysis listed on this slide. Discuss each one briefly
  • #12 Most districts have been exploring and experimenting with how to develop local growth indicators, measures, and analysis. Boards should expect that their districts are in the early stages of understanding and building local growth models. Districts will continue to need guidance, training, and support on this work. In the meantime, to get started, let’s work with these questions: (Processing and facilitated table talk)
  • #13 Most state and local growth models look at growth for all students as illustrated above Most are also focused on growth to proficiency and beyond
  • #14 The three key questions of a robust growth model
  • #15 Reeves: Three common models for determining teacher ratings on growth in student achievement
  • #16 Reeves
  • #17 Reeves: A growth model describes the change in student achievement across time. A growth model becomes value-added when the growth is attributed to an entity.
  • #18 Reeves: When this model is used for teacher evaluation, the student’s growth in a teacher’s class is compared to a similar student’s growth in another teacher’s class
  • #19 Reeves
  • #20 Reeves
  • #21 Reeves
  • #22 Reeves
  • #23 Reeves
  • #24 Reeves
  • #25 To show you the sample final performance profile, I will provide you two examples, one each for a hypothetical superintendent. Together, let’s look at how their Boards came up with their final performance rating
  • #26 As you “learn-into” and adapt to the new evaluation models and requirements, remember what it is all about
  • #27 Reeves
  • #29 Most of all remember, none of the three goals for your educator evaluation system will be fully achieved unless all performers (teachers, administrators, the superintendent, and the board) are all aiming for the same targets. At the end of the day, educator evaluation and your superintendent’s evaluation are all about your district’s mission, vision, and goals for student success. If evaluators lose sight of the target, educator evaluation will become a frustrating and chaotic experience for everyone.