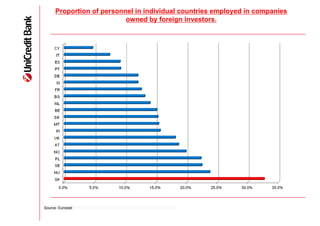
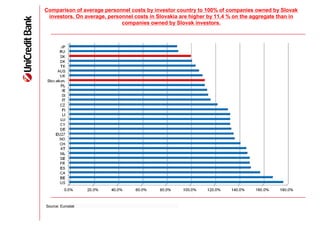
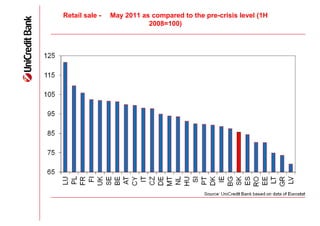
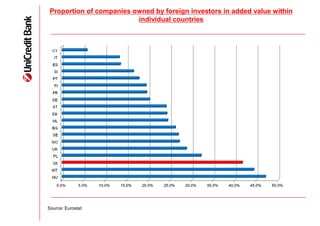
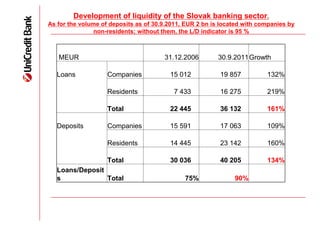
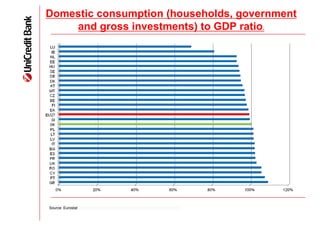
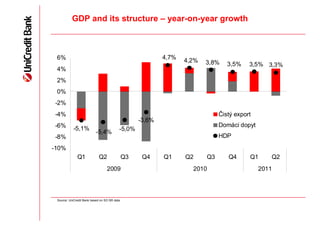
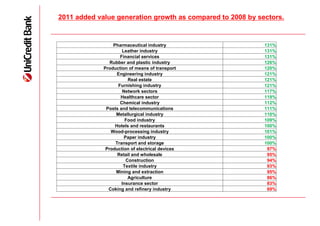
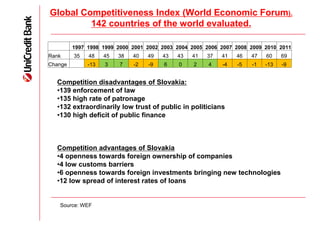
Foreign Investments


  Miroslav Štrokendl,
  Member of the Management Board of UniCredit bank Slovakia


Bratislava 23.11.2011
Why foreign investments? Their impact on the development of economy.


• Generation of internal resources of the Slovak economy is limited by the
  size of Slovakia and its historical development,


• Companies with foreign owners provide employment to a significant part
  of Slovak citizens (one third of all Slovak employees),


• Significantly higher average personnel costs in companies owned by
  foreign owners as compared to companies owned by domestic investors
  – faster creation of wealth of personnel in these companies,


• Industrial production focused mainly on export in relation to the number
  of Slovak residents and partially also in relation to lower purchasing
  power of citizens,
Why foreign investments? Their impact on the development of economy.


• Low volume of financial assets of citizens and companies owned by
  Slovak owners for development of Slovakia,

• Foreign investments carry new resources for development of economy
  and extend limited possibilities of development with respect to low
  financial assets of citizens and companies in banks, which will represent
  a limiting factor for further development of the Slovak economy. The
  Loan/Deposit indicator of the Slovak banking sector already amounts to
  90 % as compared to the end of 2006, when it amounted to 75 % only,

• The present retail consumption is only 85 % of the pre-crisis level, caused
  mainly by purchase of citizens in surrounding countries after introduction
  of the strong EUR exchange rate, exporting our limited sources abroad.

• Foreign investors are important for us to be included by the structure of
  Slovak GDP generation in the „healthy“ core – with a lower proportion of
  cumulative domestic demand below 100 % ,
Proportion of personnel in individual countries employed in companies
                           owned by foreign investors.


Source: Eurostat
Comparison of average personnel costs by investor country to 100% of companies owned by Slovak
 investors. On average, personnel costs in Slovakia are higher by 11.4 % on the aggregate than in
                             companies owned by Slovak investors.


Source: Eurostat
Retail sale -   May 2011 as compared to the pre-crisis level (1H
                           2008=100)
Proportion of companies owned by foreign investors in added value within
                         individual countries


Source: Eurostat
Development of liquidity of the Slovak banking sector.
As for the volume of deposits as of 30.9.2011, EUR 2 bn is located with companies by
                non-residents; without them, the L/D indicator is 95 %


   MEUR                                31.12.2006        30.9.2011Growth

   Loans            Companies            15 012           19 857          132%

                    Residents             7 433           16 275          219%

                    Total                22 445           36 132          161%

   Deposits         Companies            15 591           17 063          109%

                    Residents            14 445           23 142          160%

                    Total                30 036           40 205          134%
   Loans/Deposit
   s             Total                        75%              90%
Domestic consumption (households, government
    and gross investments) to GDP ratio.


Source: Eurostat
GDP and its structure – year-on-year growth


 6%                                                        4,7%
                                                                  4,2%   3,8%    3,5%    3,5% 3,3%
 4%
 2%
 0%
-2%
-4%                                                                           Čistý export
                                                   -3,6%
-6%                                                                           Domáci dopyt
           -5,1%                          -5,0%
                          -5,4%
-8%                                                                           HDP
-10%
              Q1            Q2                Q3    Q4     Q1     Q2     Q3      Q4      Q1     Q2
                                  2009                              2010                     2011


 Source: UniCredit Bank based on SO SR data
2011 added value generation growth as compared to 2008 by sectors.


                 Pharmaceutical industry                    131%
                     Leather industry                       131%
                    Financial services                      131%
                Rubber and plastic industry                 126%
             Production of means of transport               120%
                   Engineering industry                     121%
                        Real estate                         121%
                   Furnishing industry                      121%
                     Network sectors                        117%
                    Healthcare sector                       119%
                    Chemical industry                       112%
              Posts and telecommunications                  111%
                  Metallurgical industry                    110%
                       Food industry                        109%
                  Hotels and restaurants                    100%
                Wood-processing industry                    101%
                      Paper industry                        100%
                  Transport and storage                     100%
              Production of electrical devices               97%
                   Retail and wholesale                      95%
                       Construction                          94%
                      Textile industry                       93%
                  Mining and extraction                      95%
                        Agriculture                          86%
                     Insurance sector                        83%
               Coking and refinery industry                  69%
Global Competitiveness Index (World Economic Forum).
         142 countries of the world evaluated.

         1997 1998 1999 2000 2001 2002 2003 2004 2005 2006 2007 2008 2009 2010 2011
Rank     35   48    45   38   40   49   43   43   41   37   41   46   47   60    69
Change        -13   3    7    -2   -9   6    0    2    4    -4   -5   -1   -13   -9


  Competition disadvantages of Slovakia:
  •139 enforcement of law
  •135 high rate of patronage
  •132 extraordinarily low trust of public in politicians
  •130 high deficit of public finance


  Competition advantages of Slovakia
  •4 openness towards foreign ownership of companies
  •4 low customs barriers
  •6 openness towards foreign investments bringing new technologies
  •12 low spread of interest rates of loans


   Source: WEF
Public debt in EU countries (% of GDP, 2010).
Global Competitiveness Index (WEF).


                             Rank          Score
Switzerland                          1                5.7
Singapore                            2                5.6
Sweden                               3                5.6
Finland                              4                5.5
USA                                  5                5.4
Germany                              6                5.4
Netherlands                          7                5.4
Denmark                              8                5.4
Japan                                9                5.4
Great Britain                       10                5.4

Czech Republic                      38                4.5
Poland                              41                4.5
Hungary                             48                4.4
Slovakia                            69                4.2

  Source: WEF
Doing Business Conditions Analysis of World Bank.
          183 countries of the world evaluated.

                            Ranking 2012   Ranking 2011   Change
Establishment of company         76               74       -2
Construction permit               50              50        0
Supply of electric power         102              94       -8
Registration of property          10               8       -2
Obtaining loan                    24              21       -3
Protection of investments        111              108      -3
Payment of taxes                 130              126      -4
Foreign business                  95              91       -4
Enforcement of law                71              74        3
Insolvency proceedings            35              33       -2
Business in total                 48              43       -5


Source: World Bank
Looking ahead, is the business environment going to
     change or not...


16

Miroslav Strokendl: Conference on Foreign Investments 23rd November

  • 1.
    Foreign Investments Miroslav Štrokendl, Member of the Management Board of UniCredit bank Slovakia Bratislava 23.11.2011
  • 2.
    Why foreign investments?Their impact on the development of economy. • Generation of internal resources of the Slovak economy is limited by the size of Slovakia and its historical development, • Companies with foreign owners provide employment to a significant part of Slovak citizens (one third of all Slovak employees), • Significantly higher average personnel costs in companies owned by foreign owners as compared to companies owned by domestic investors – faster creation of wealth of personnel in these companies, • Industrial production focused mainly on export in relation to the number of Slovak residents and partially also in relation to lower purchasing power of citizens,
  • 3.
    Why foreign investments?Their impact on the development of economy. • Low volume of financial assets of citizens and companies owned by Slovak owners for development of Slovakia, • Foreign investments carry new resources for development of economy and extend limited possibilities of development with respect to low financial assets of citizens and companies in banks, which will represent a limiting factor for further development of the Slovak economy. The Loan/Deposit indicator of the Slovak banking sector already amounts to 90 % as compared to the end of 2006, when it amounted to 75 % only, • The present retail consumption is only 85 % of the pre-crisis level, caused mainly by purchase of citizens in surrounding countries after introduction of the strong EUR exchange rate, exporting our limited sources abroad. • Foreign investors are important for us to be included by the structure of Slovak GDP generation in the „healthy“ core – with a lower proportion of cumulative domestic demand below 100 % ,
  • 4.
    Proportion of personnelin individual countries employed in companies owned by foreign investors. Source: Eurostat
  • 5.
    Comparison of averagepersonnel costs by investor country to 100% of companies owned by Slovak investors. On average, personnel costs in Slovakia are higher by 11.4 % on the aggregate than in companies owned by Slovak investors. Source: Eurostat
  • 6.
    Retail sale - May 2011 as compared to the pre-crisis level (1H 2008=100)
  • 7.
    Proportion of companiesowned by foreign investors in added value within individual countries Source: Eurostat
  • 8.
    Development of liquidityof the Slovak banking sector. As for the volume of deposits as of 30.9.2011, EUR 2 bn is located with companies by non-residents; without them, the L/D indicator is 95 % MEUR 31.12.2006 30.9.2011Growth Loans Companies 15 012 19 857 132% Residents 7 433 16 275 219% Total 22 445 36 132 161% Deposits Companies 15 591 17 063 109% Residents 14 445 23 142 160% Total 30 036 40 205 134% Loans/Deposit s Total 75% 90%
  • 9.
    Domestic consumption (households,government and gross investments) to GDP ratio. Source: Eurostat
  • 10.
    GDP and itsstructure – year-on-year growth 6% 4,7% 4,2% 3,8% 3,5% 3,5% 3,3% 4% 2% 0% -2% -4% Čistý export -3,6% -6% Domáci dopyt -5,1% -5,0% -5,4% -8% HDP -10% Q1 Q2 Q3 Q4 Q1 Q2 Q3 Q4 Q1 Q2 2009 2010 2011 Source: UniCredit Bank based on SO SR data
  • 11.
    2011 added valuegeneration growth as compared to 2008 by sectors. Pharmaceutical industry 131% Leather industry 131% Financial services 131% Rubber and plastic industry 126% Production of means of transport 120% Engineering industry 121% Real estate 121% Furnishing industry 121% Network sectors 117% Healthcare sector 119% Chemical industry 112% Posts and telecommunications 111% Metallurgical industry 110% Food industry 109% Hotels and restaurants 100% Wood-processing industry 101% Paper industry 100% Transport and storage 100% Production of electrical devices 97% Retail and wholesale 95% Construction 94% Textile industry 93% Mining and extraction 95% Agriculture 86% Insurance sector 83% Coking and refinery industry 69%
  • 12.
    Global Competitiveness Index(World Economic Forum). 142 countries of the world evaluated. 1997 1998 1999 2000 2001 2002 2003 2004 2005 2006 2007 2008 2009 2010 2011 Rank 35 48 45 38 40 49 43 43 41 37 41 46 47 60 69 Change -13 3 7 -2 -9 6 0 2 4 -4 -5 -1 -13 -9 Competition disadvantages of Slovakia: •139 enforcement of law •135 high rate of patronage •132 extraordinarily low trust of public in politicians •130 high deficit of public finance Competition advantages of Slovakia •4 openness towards foreign ownership of companies •4 low customs barriers •6 openness towards foreign investments bringing new technologies •12 low spread of interest rates of loans Source: WEF
  • 13.
    Public debt inEU countries (% of GDP, 2010).
  • 14.
    Global Competitiveness Index(WEF). Rank Score Switzerland 1 5.7 Singapore 2 5.6 Sweden 3 5.6 Finland 4 5.5 USA 5 5.4 Germany 6 5.4 Netherlands 7 5.4 Denmark 8 5.4 Japan 9 5.4 Great Britain 10 5.4 Czech Republic 38 4.5 Poland 41 4.5 Hungary 48 4.4 Slovakia 69 4.2 Source: WEF
  • 15.
    Doing Business ConditionsAnalysis of World Bank. 183 countries of the world evaluated. Ranking 2012 Ranking 2011 Change Establishment of company 76 74 -2 Construction permit 50 50 0 Supply of electric power 102 94 -8 Registration of property 10 8 -2 Obtaining loan 24 21 -3 Protection of investments 111 108 -3 Payment of taxes 130 126 -4 Foreign business 95 91 -4 Enforcement of law 71 74 3 Insolvency proceedings 35 33 -2 Business in total 48 43 -5 Source: World Bank
  • 16.
    Looking ahead, isthe business environment going to change or not... 16