Download to read offline

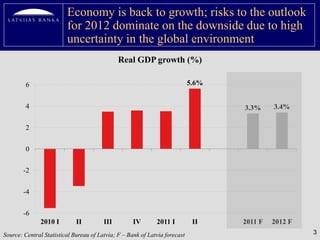
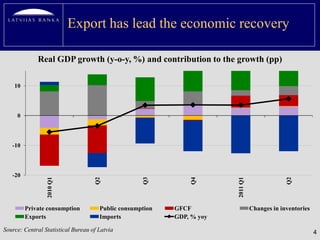
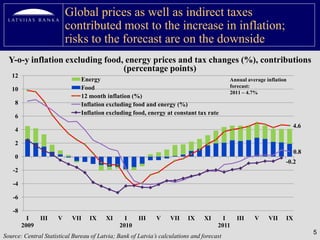
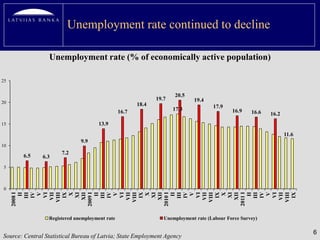
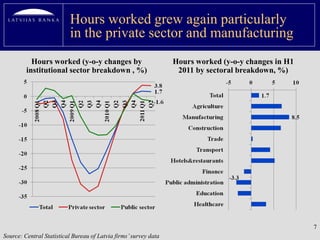

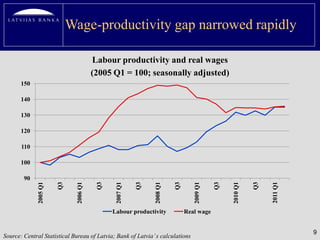

Latvia's economy is witnessing a resurgence with GDP growth and declining unemployment rates, despite global uncertainties posing risks for 2012. Strong export performance and improved competitiveness have contributed significantly to this recovery, with inflation pressures primarily fueled by rising global prices and indirect taxes. Nevertheless, challenges such as tightening credit conditions and high unemployment remain as the country navigates its economic landscape.


