Download to read offline

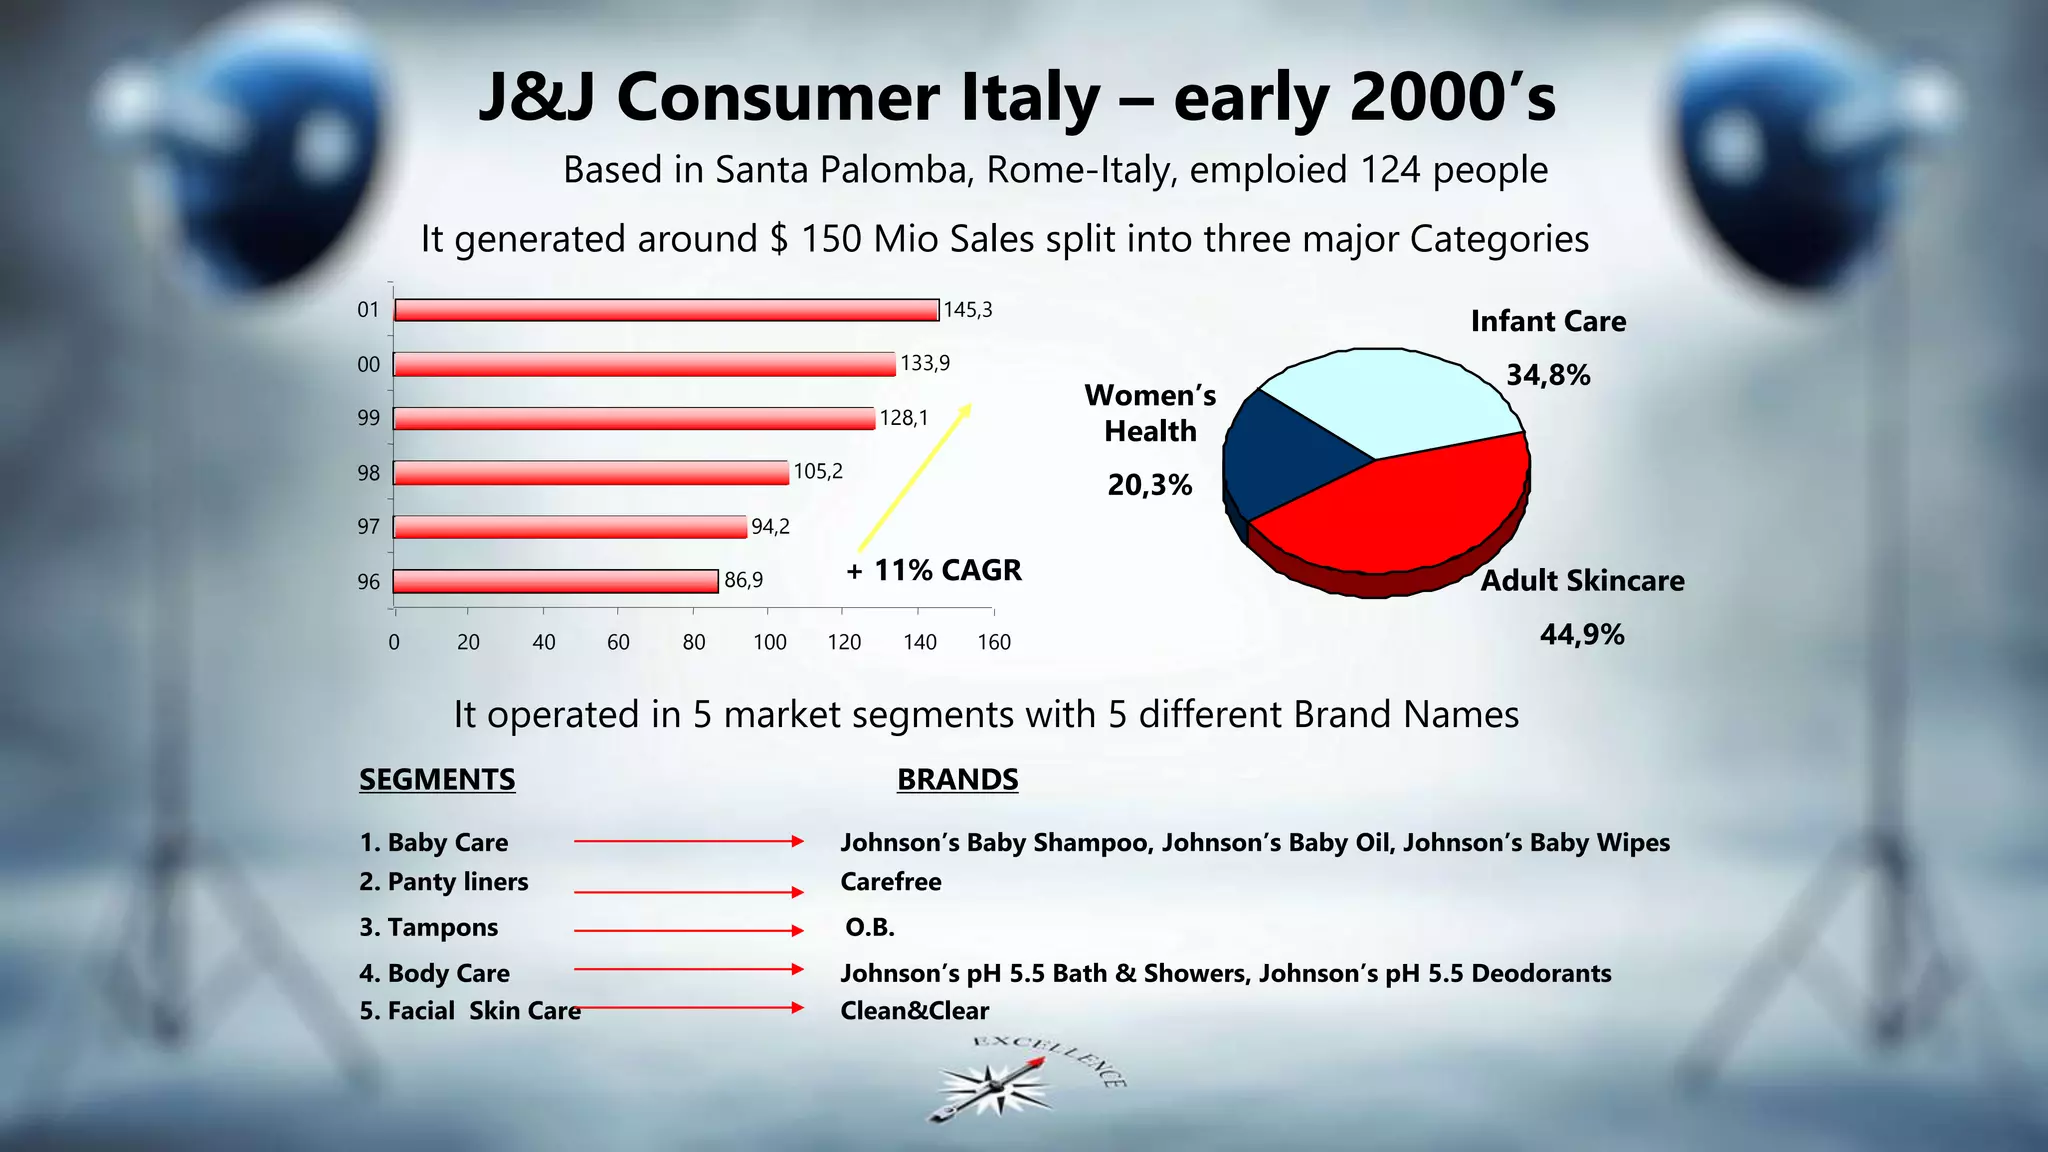


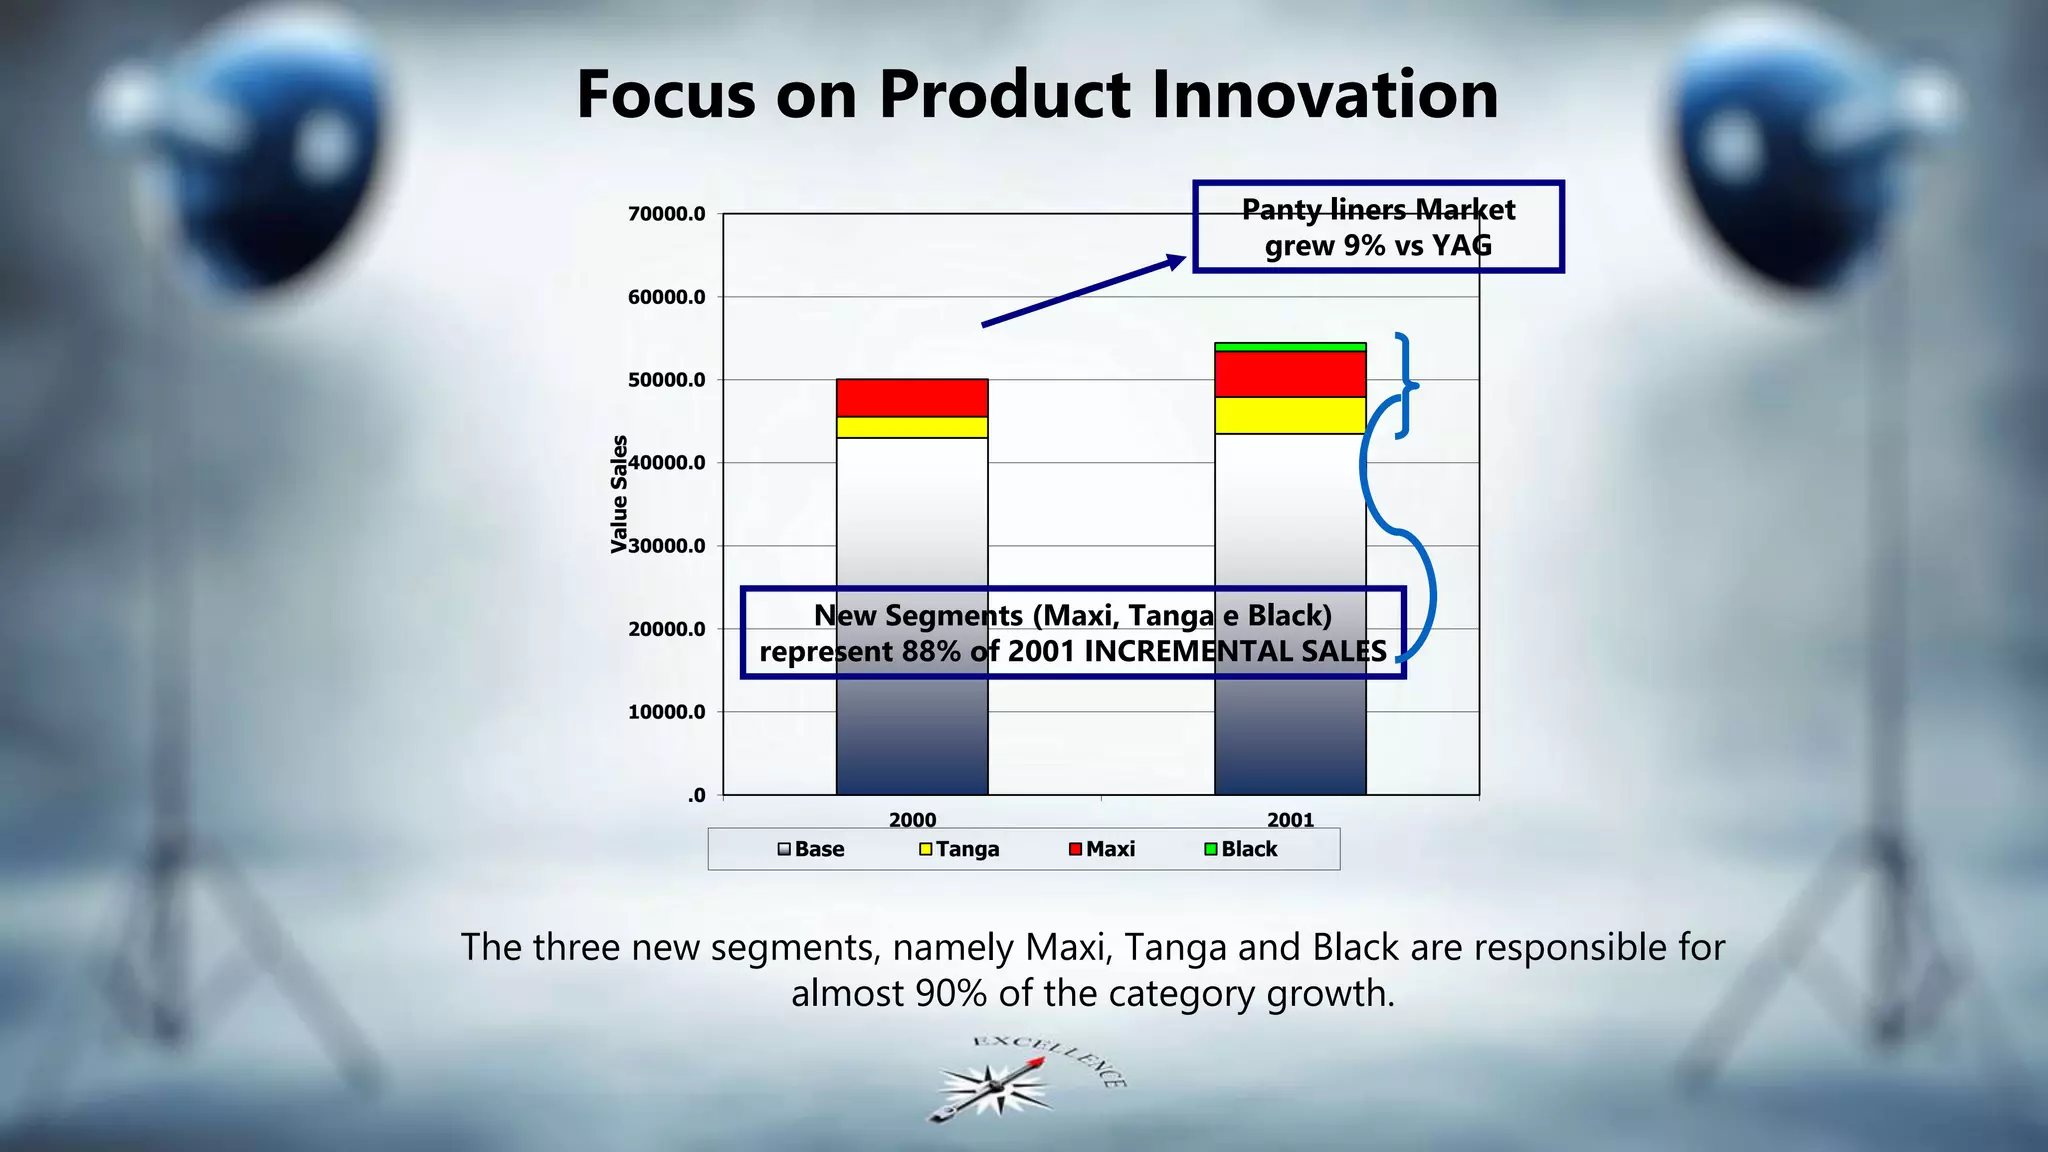


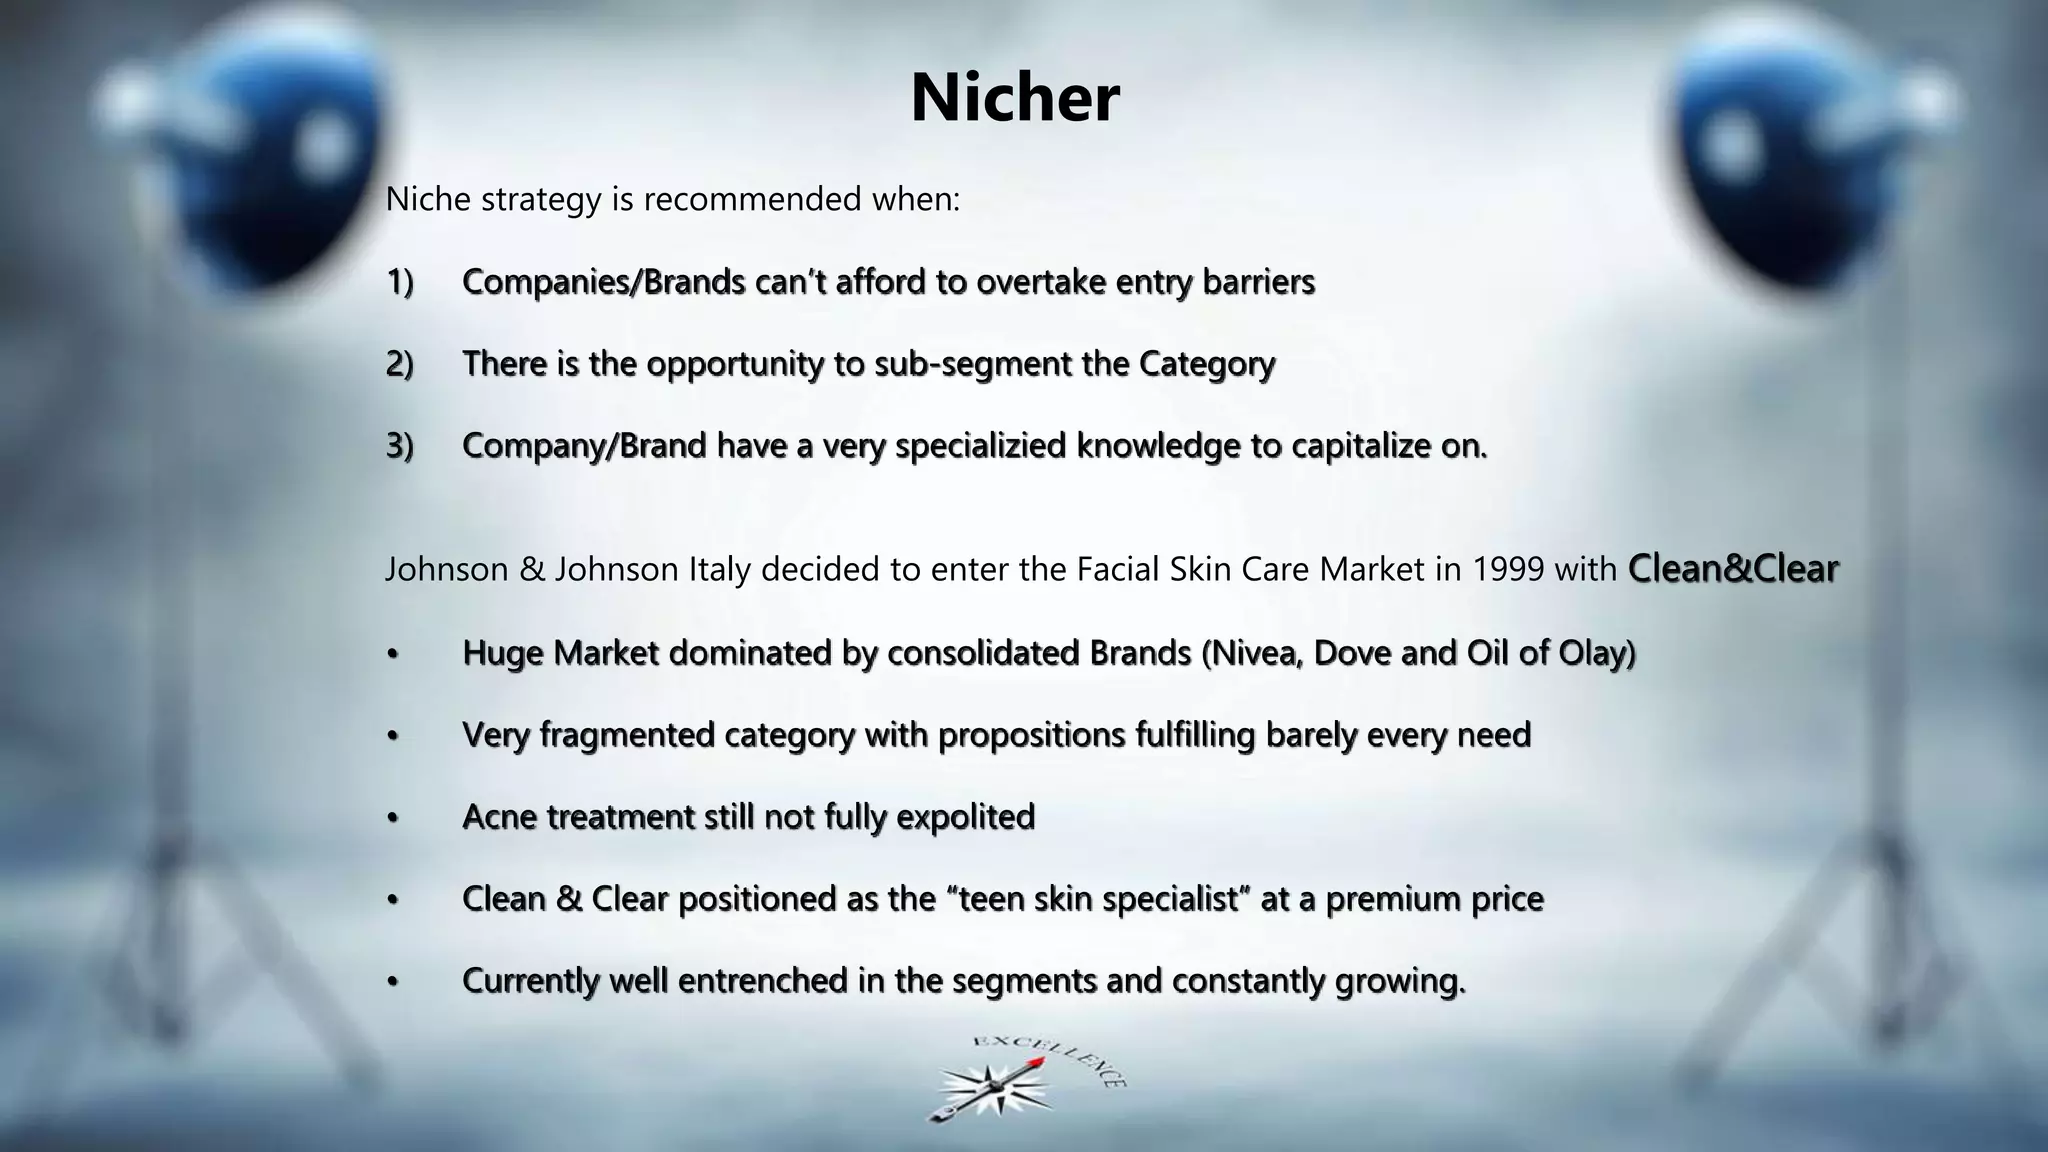


This document discusses Johnson & Johnson's strategy in Italy across various product categories. It provides examples of how J&J has established market leadership, challenged competitors, expanded market share as a follower, and successfully entered niche markets. For baby oil, J&J repositioned the product for adults and increased sales from $1M to $10M in 5 years. For panty liners, J&J improved products and advertising to regain market share from a competitor. J&J also expanded its pH 5.5 line and successfully entered the facial skin care market with its Clean&Clear brand. The document emphasizes product innovation, superiority, cost control, and advertising to drive growth.


