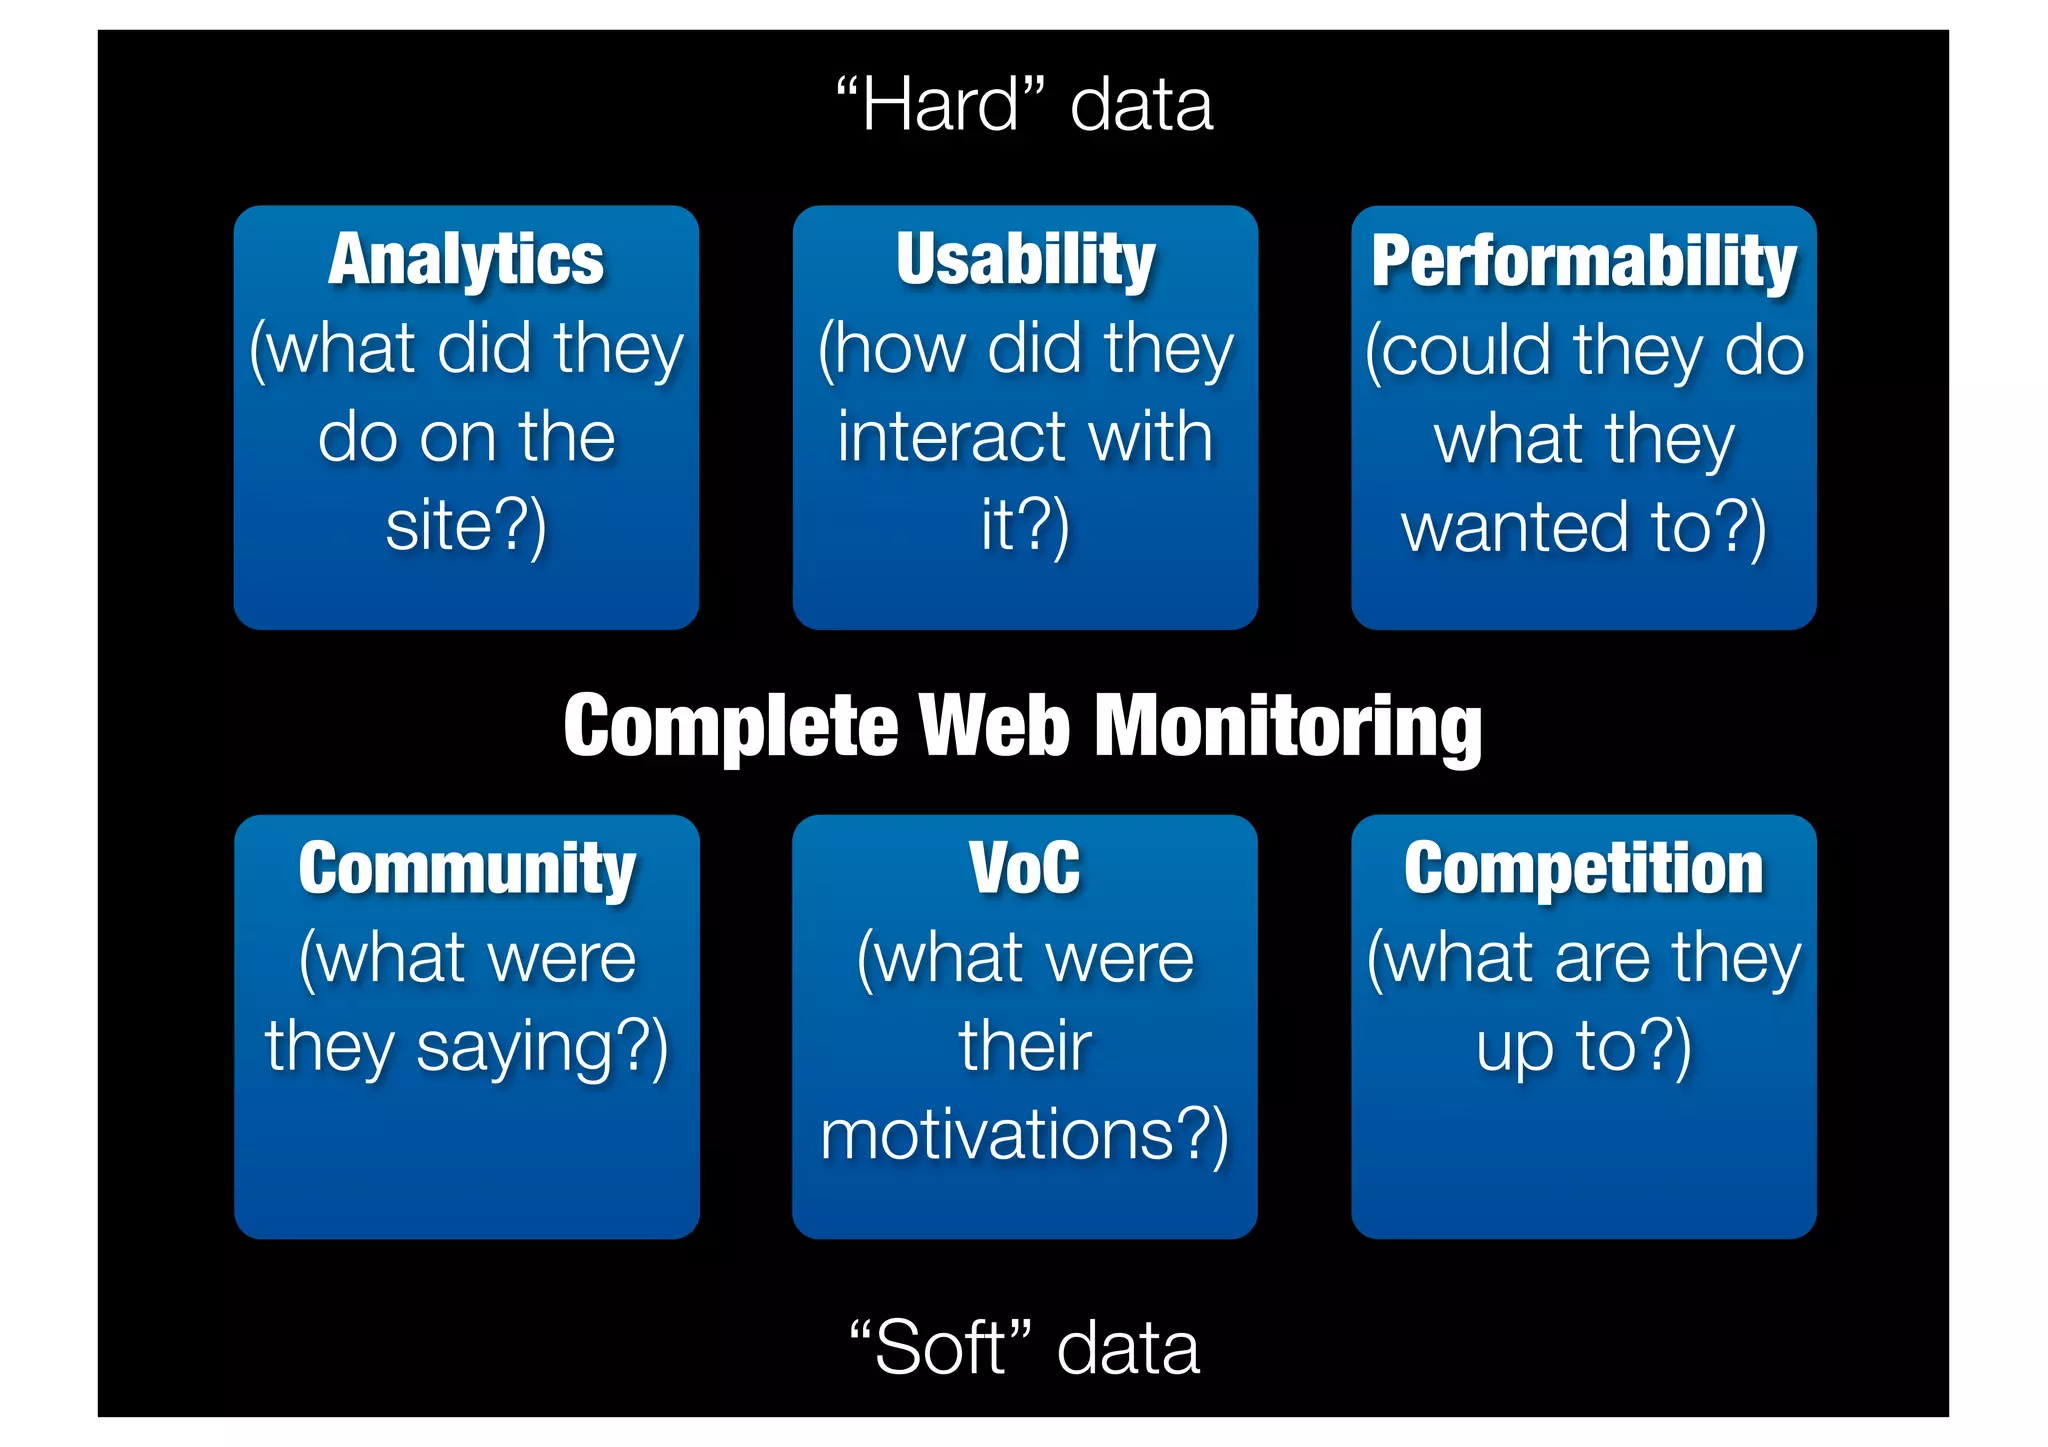
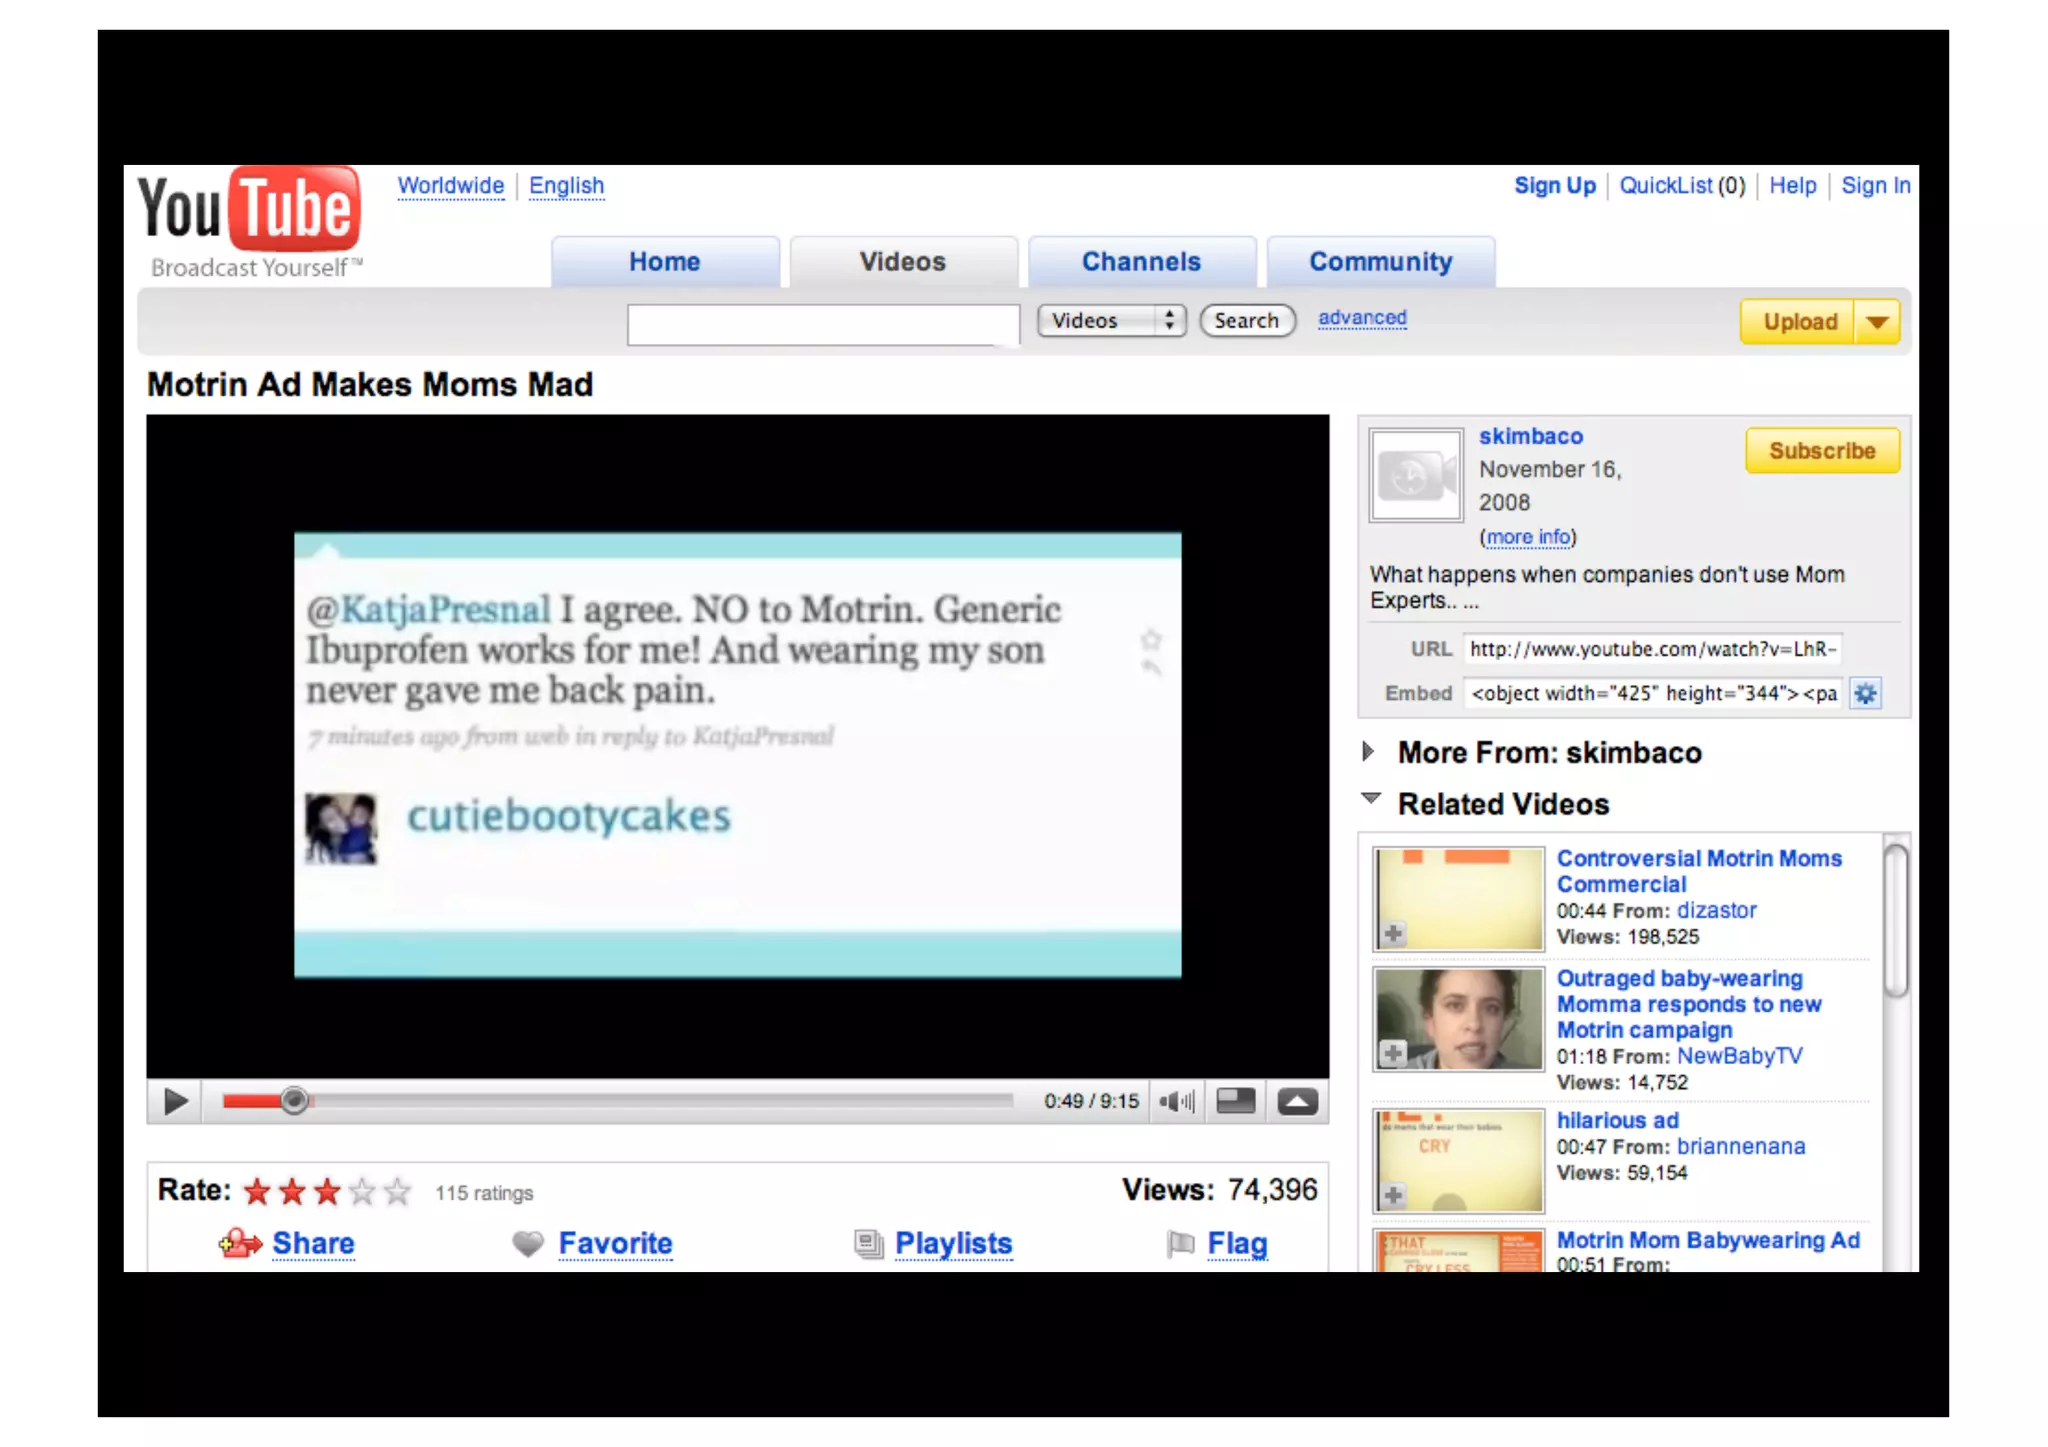
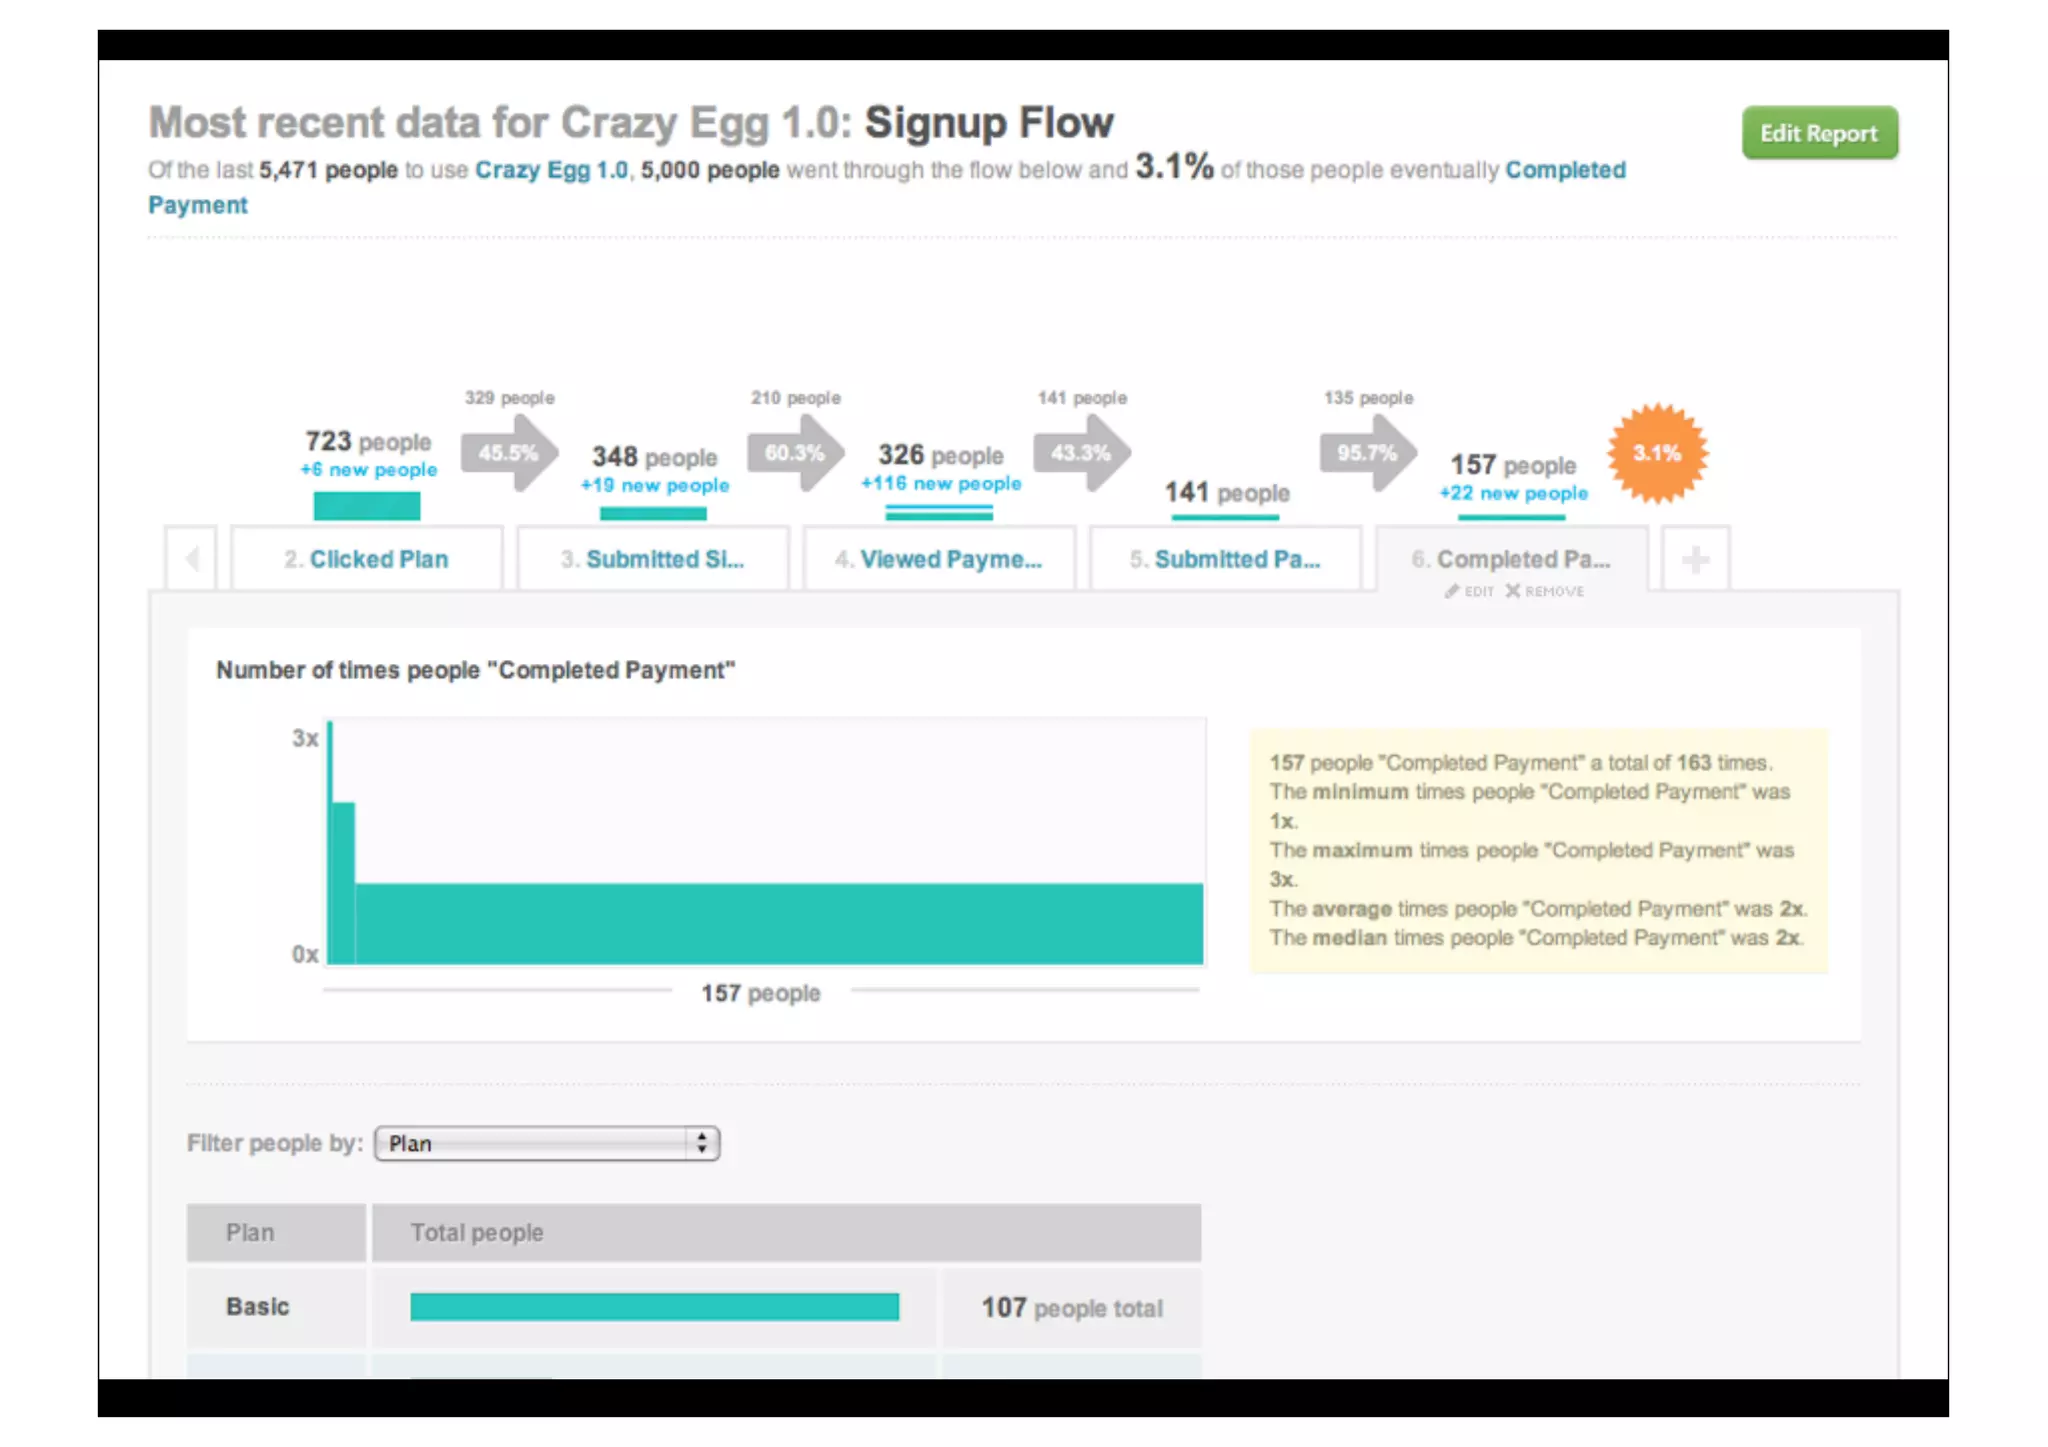
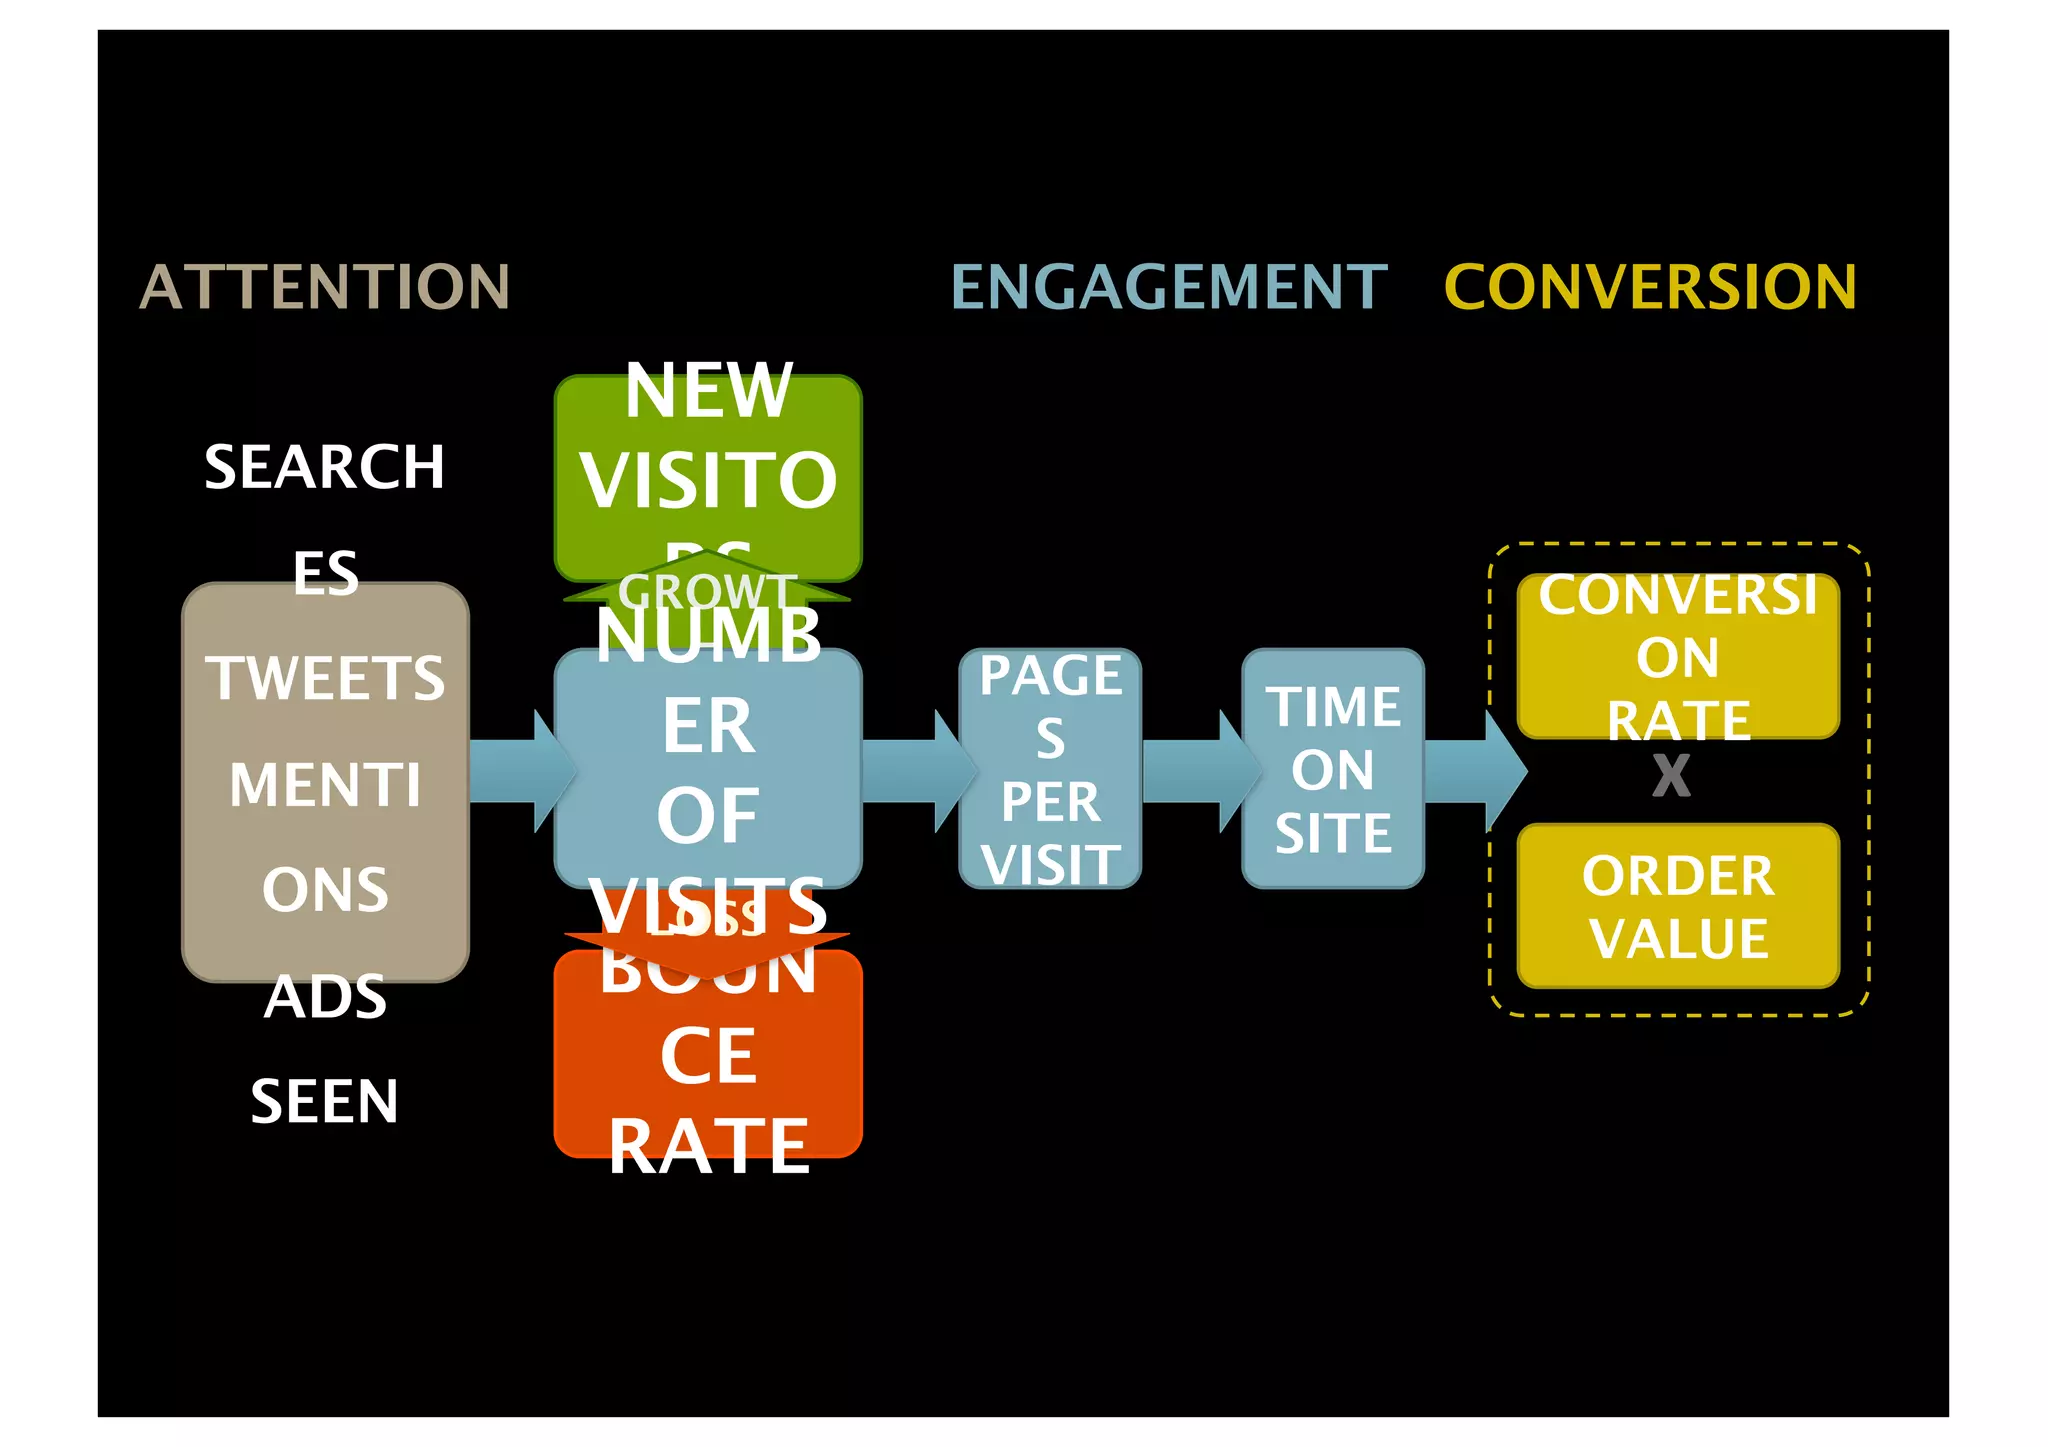
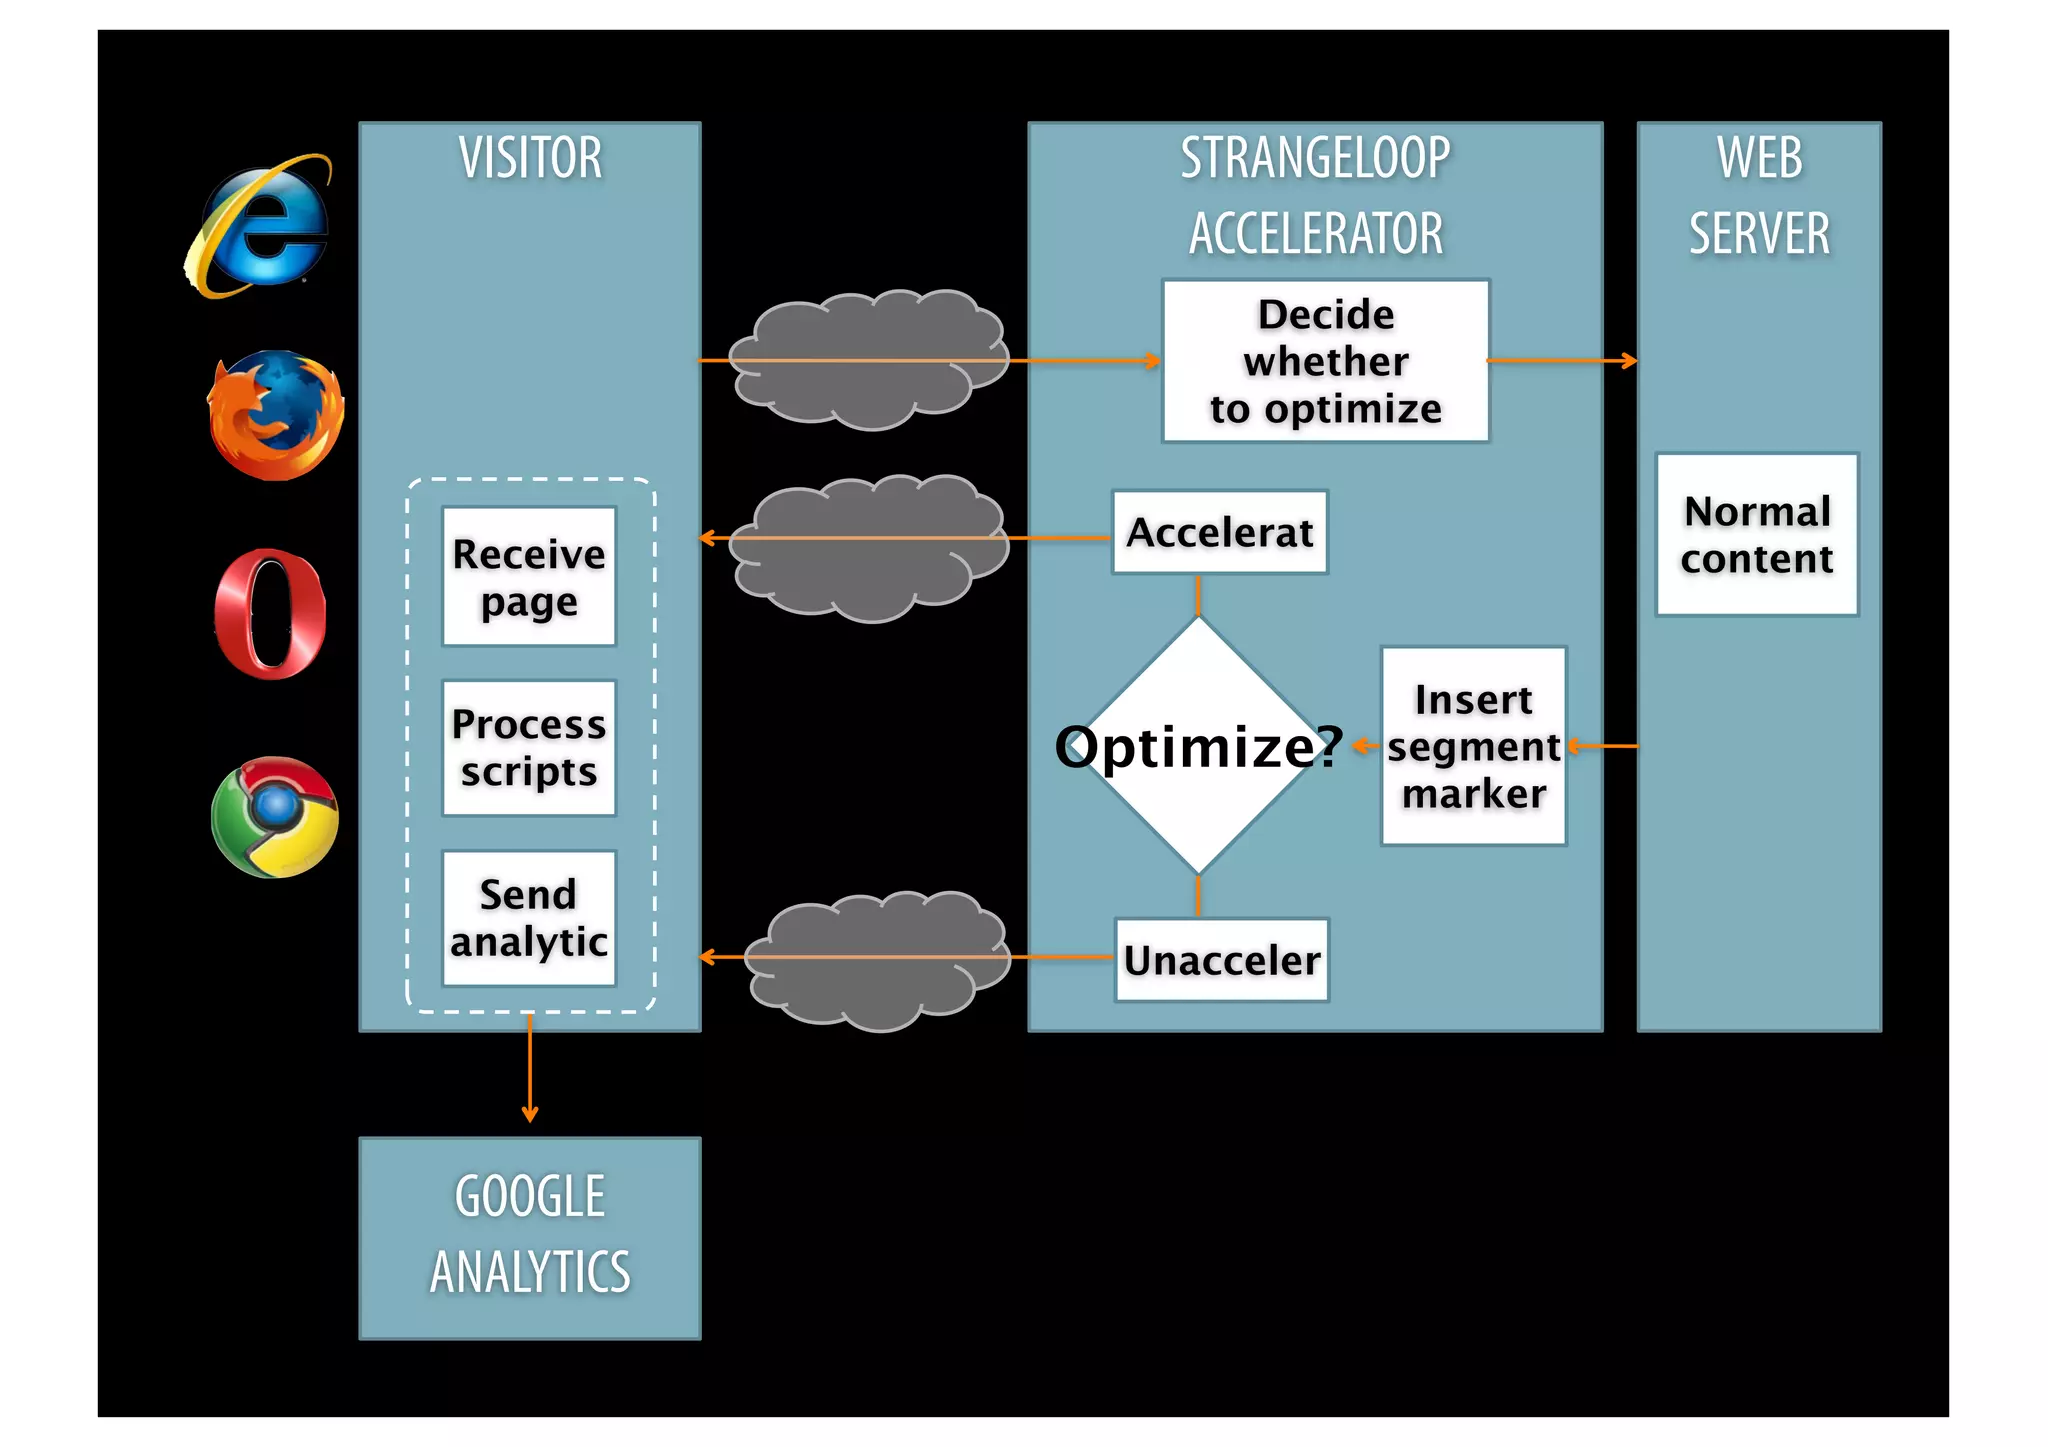
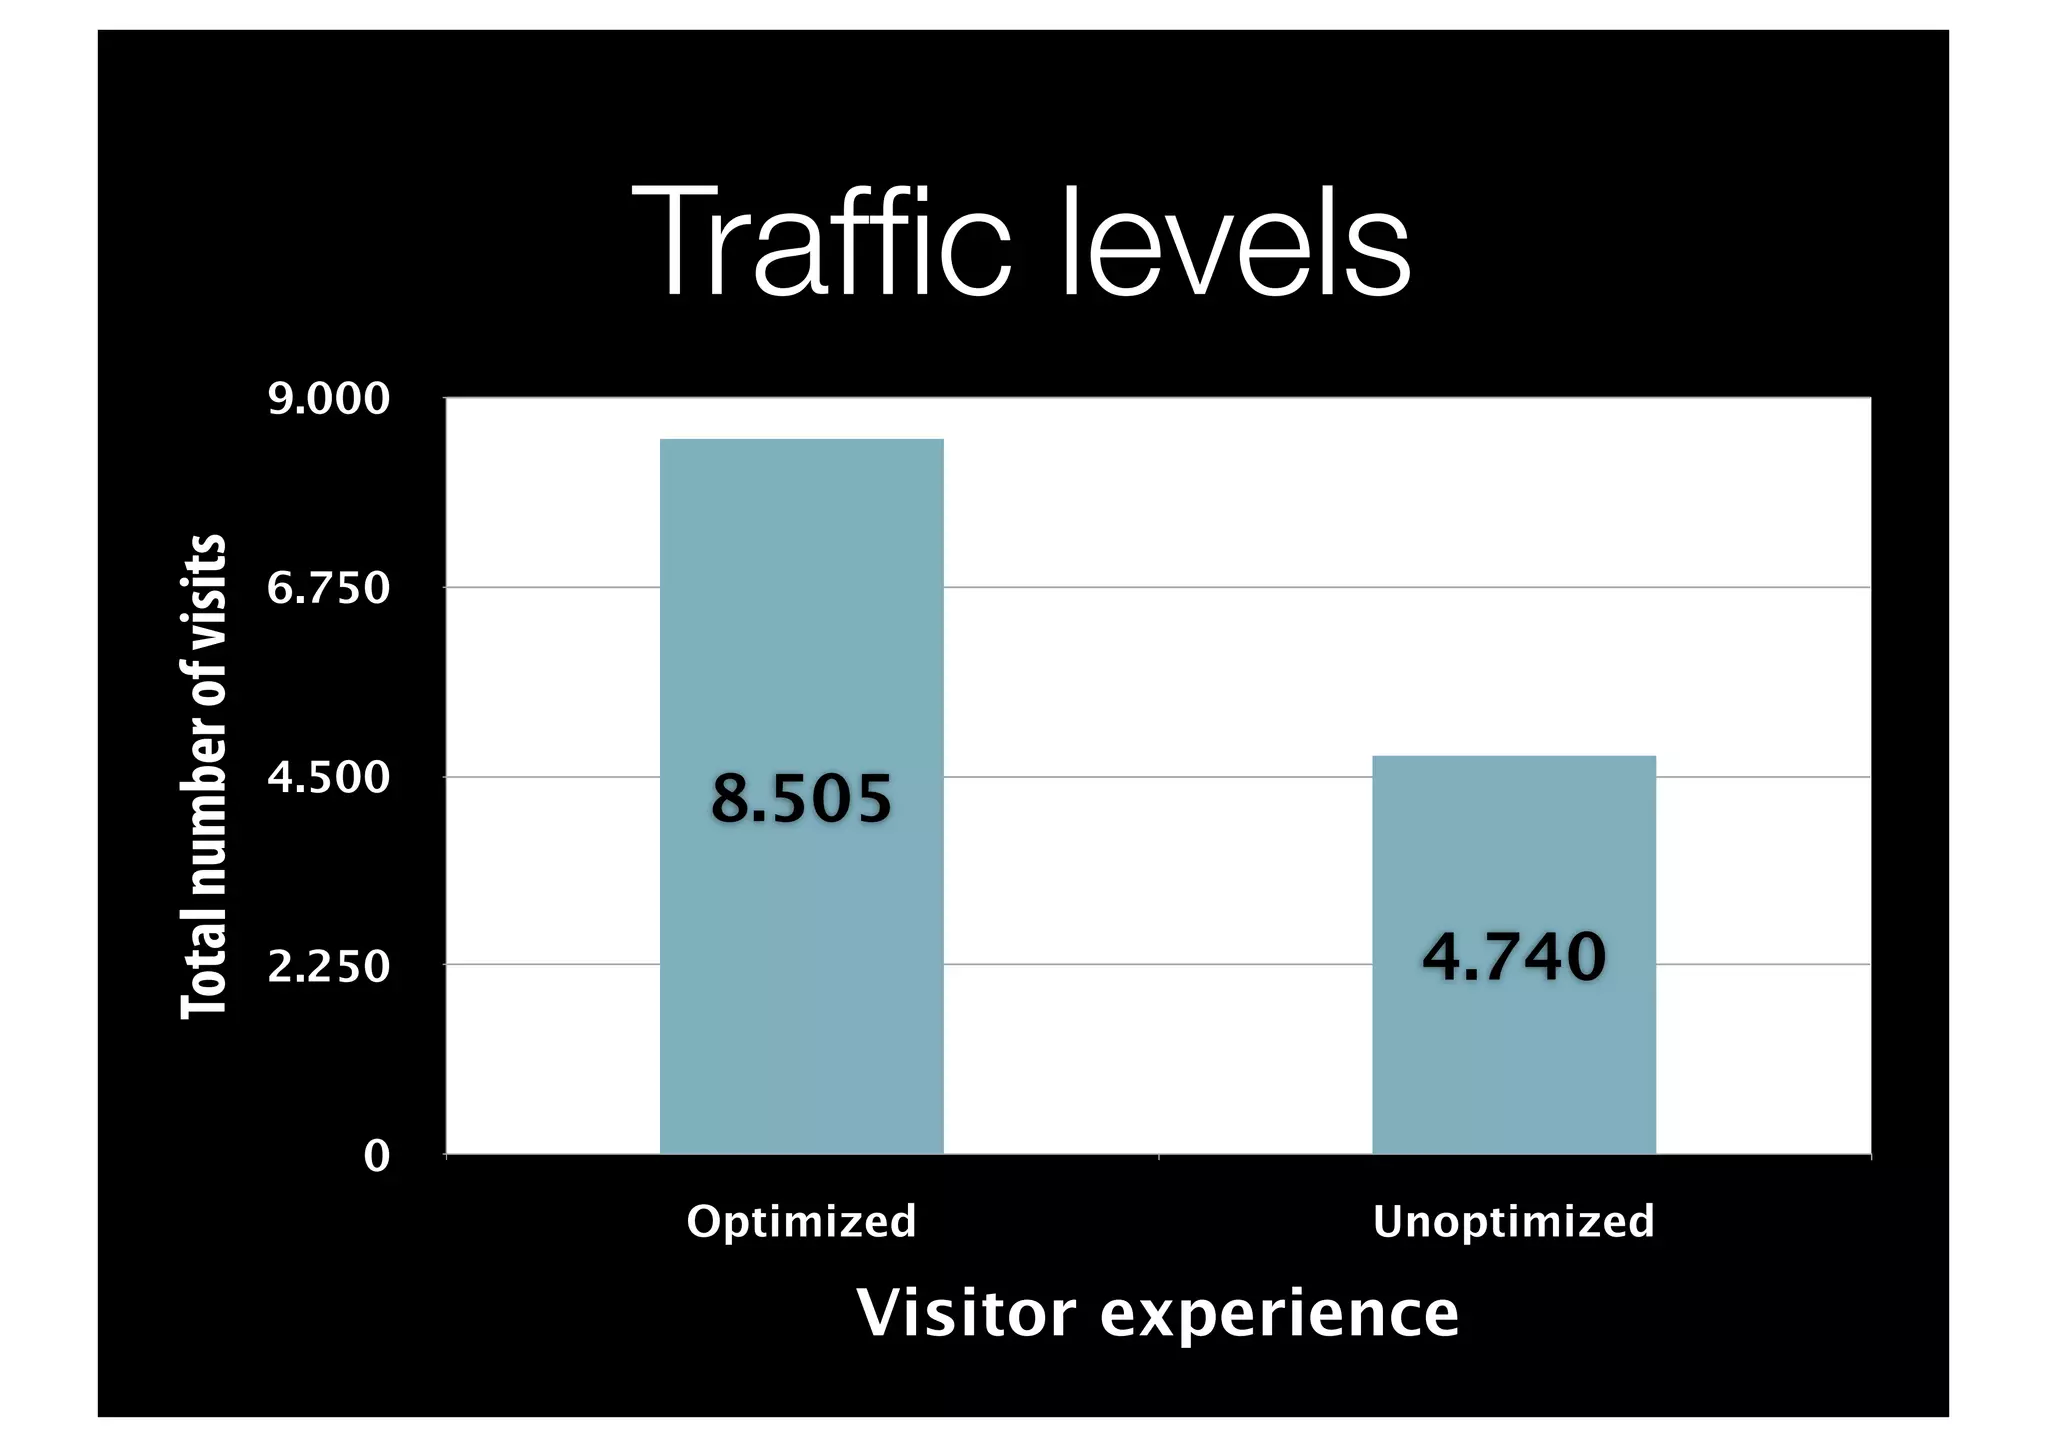
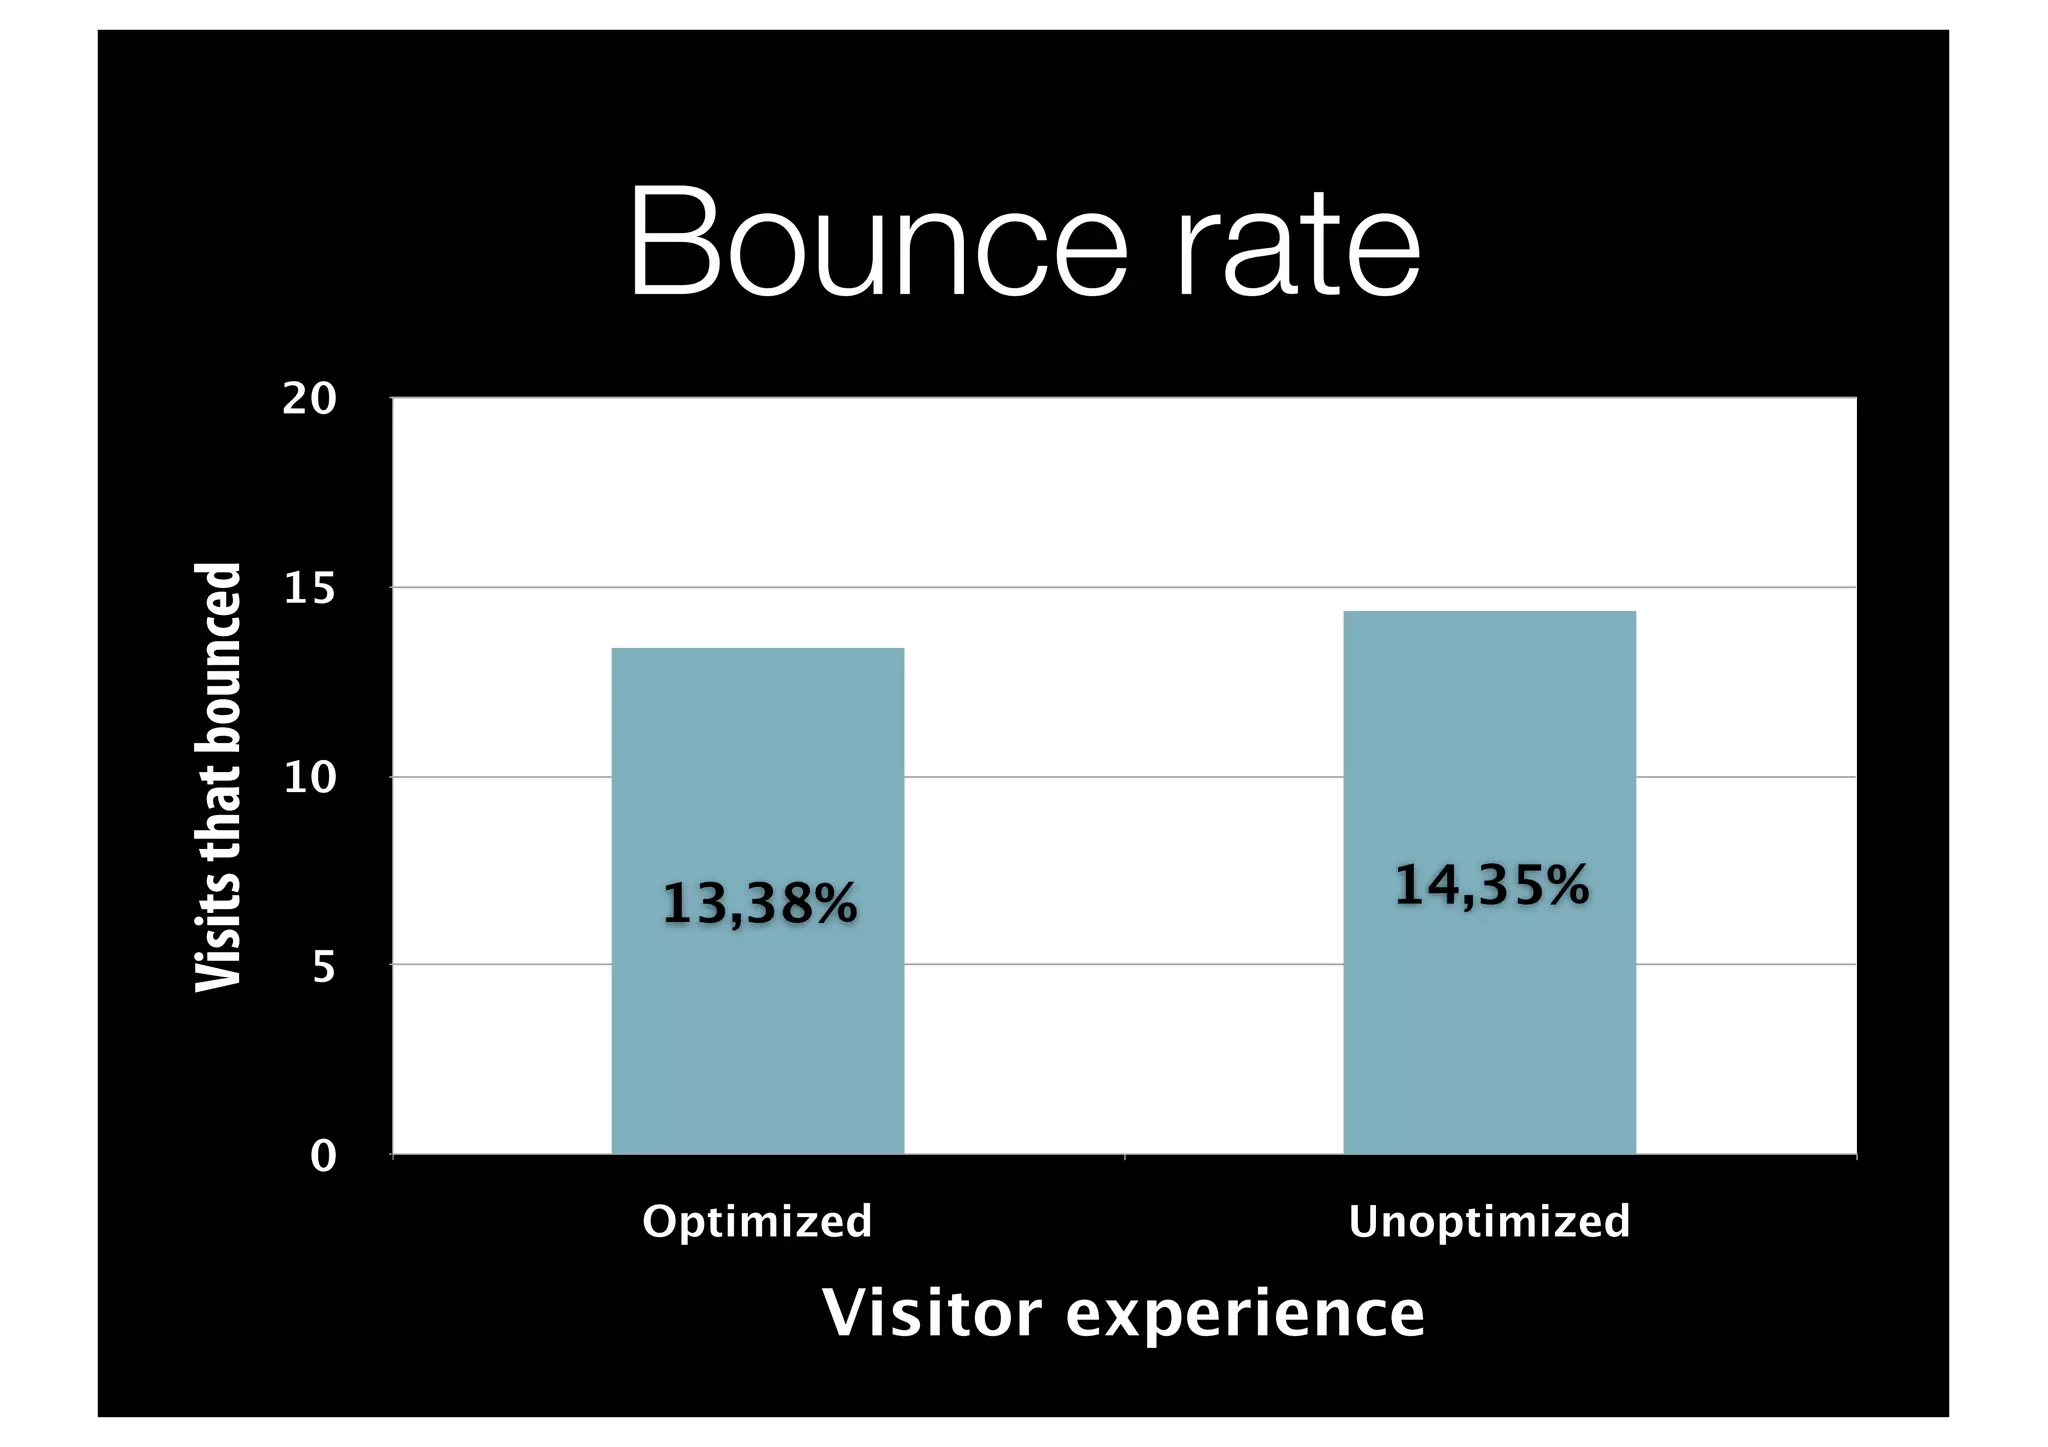
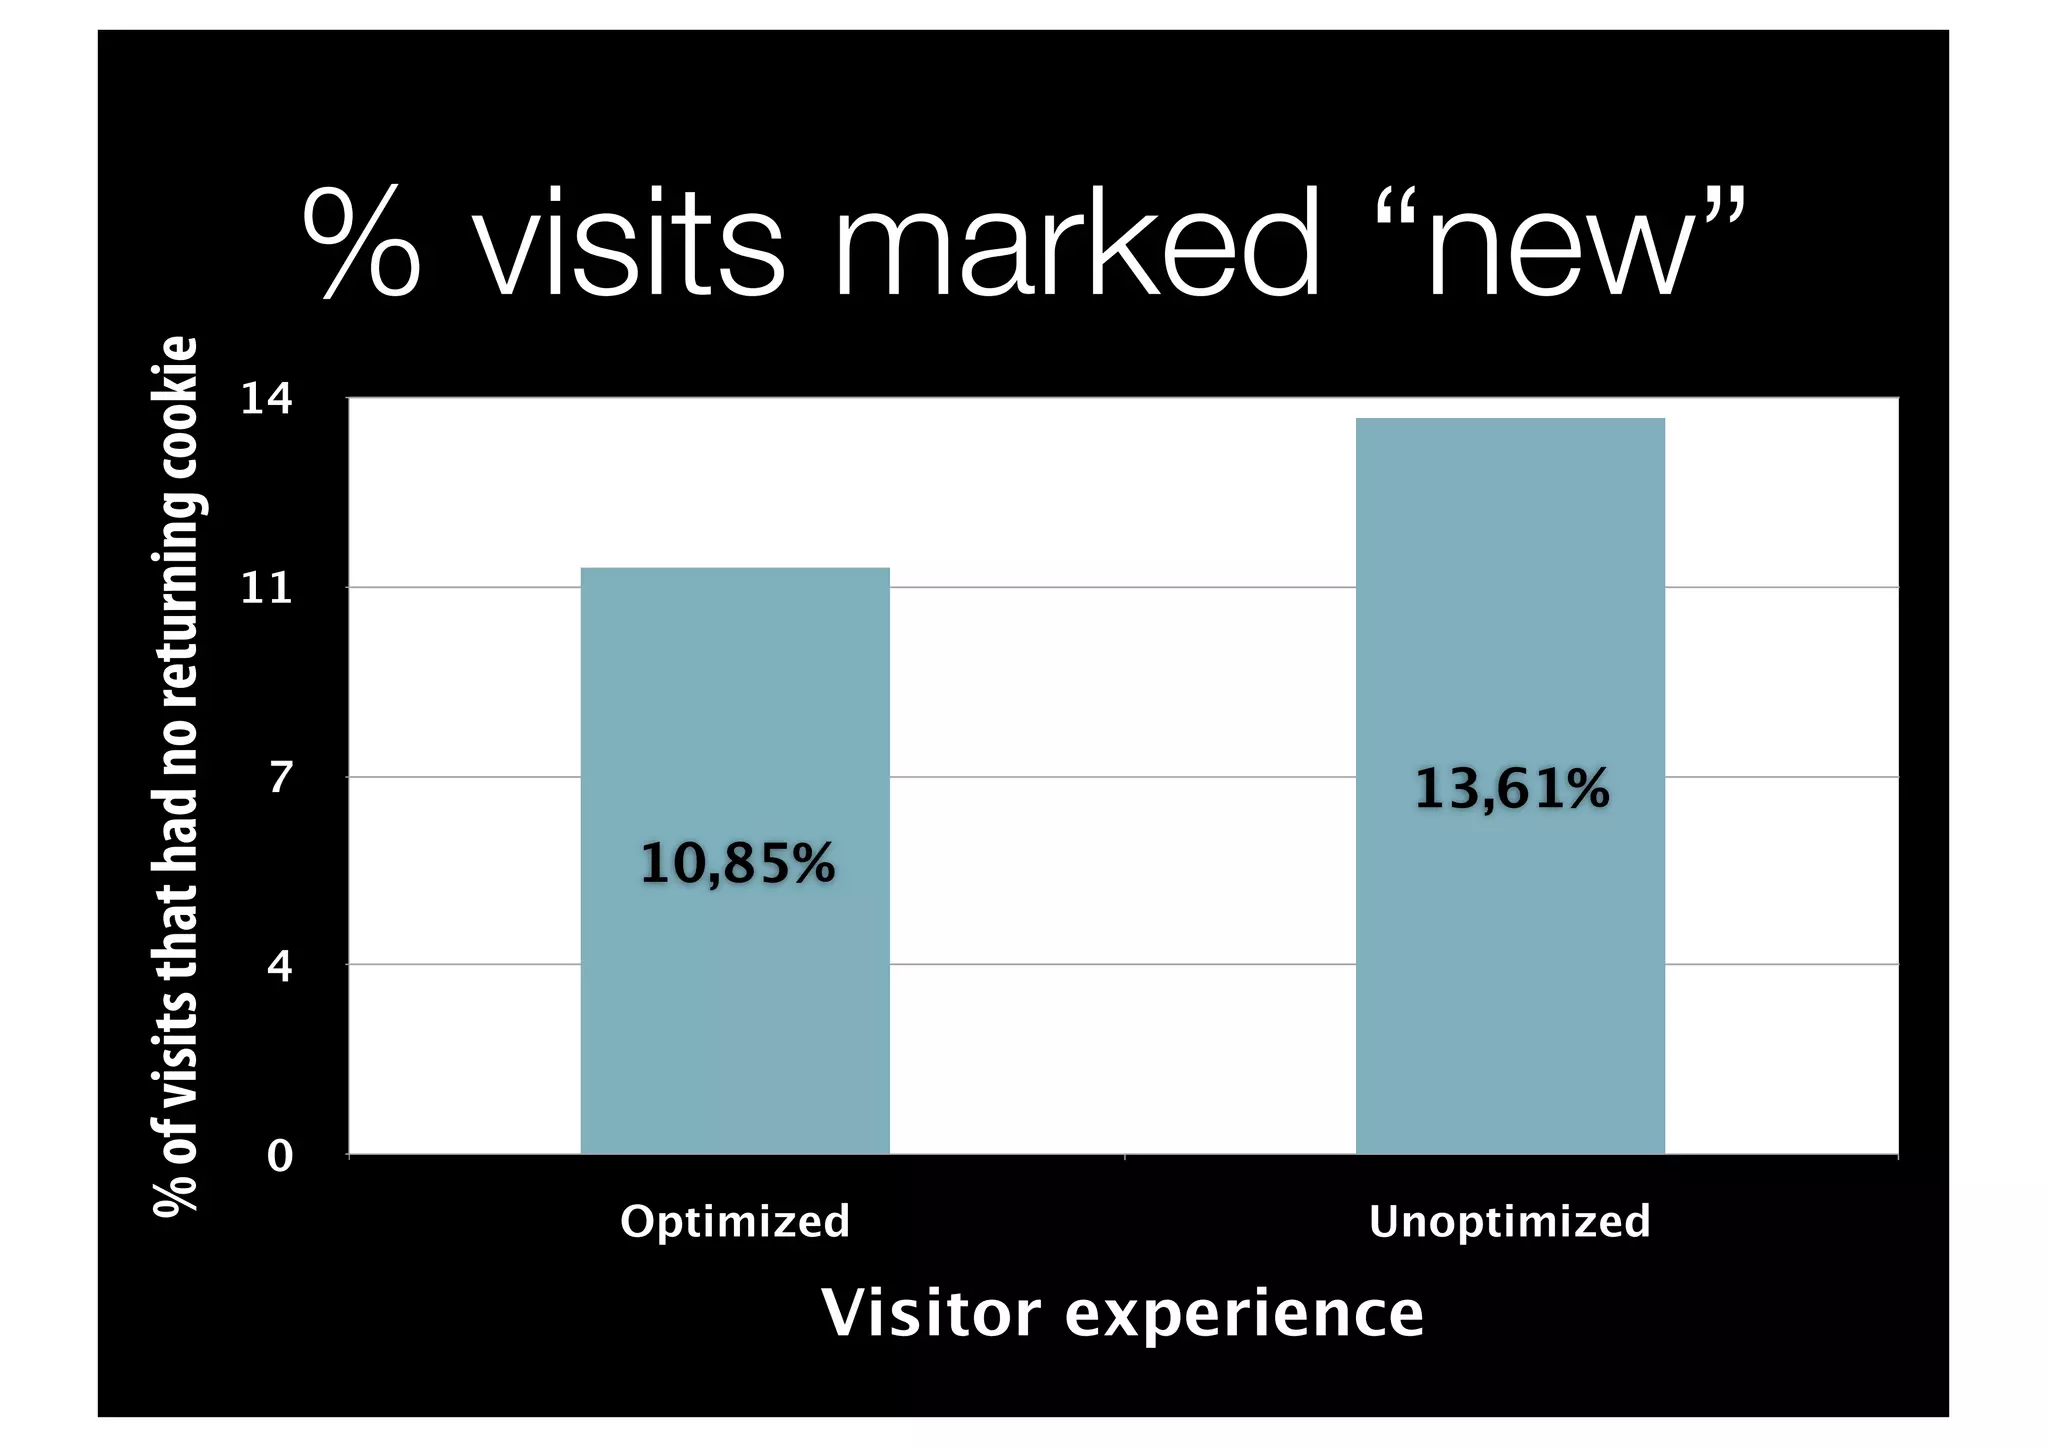
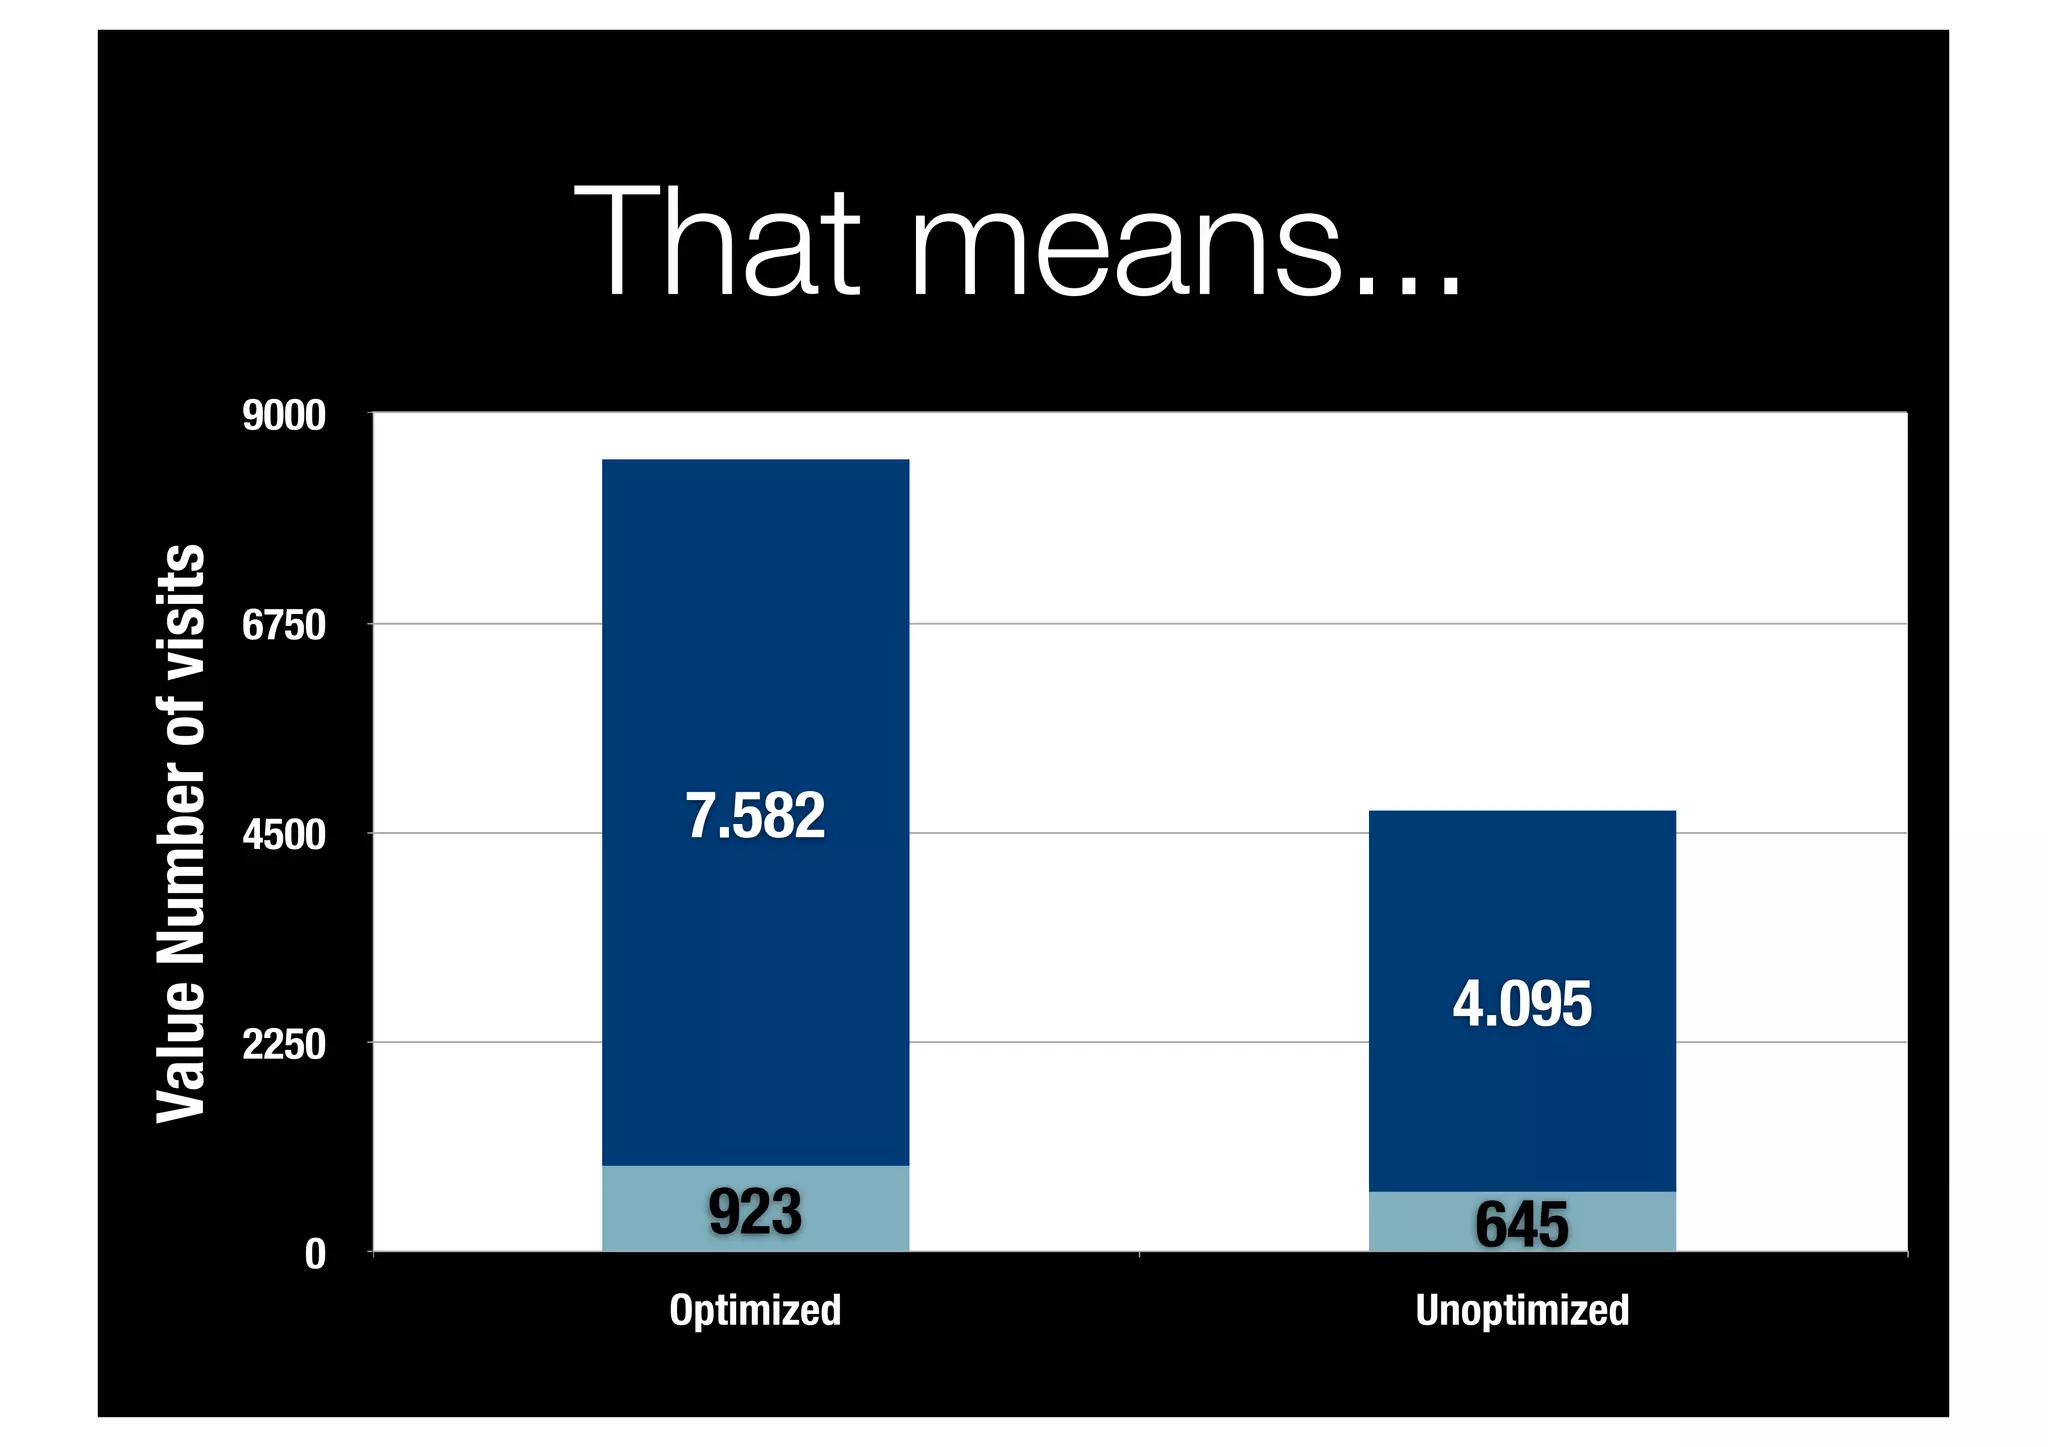
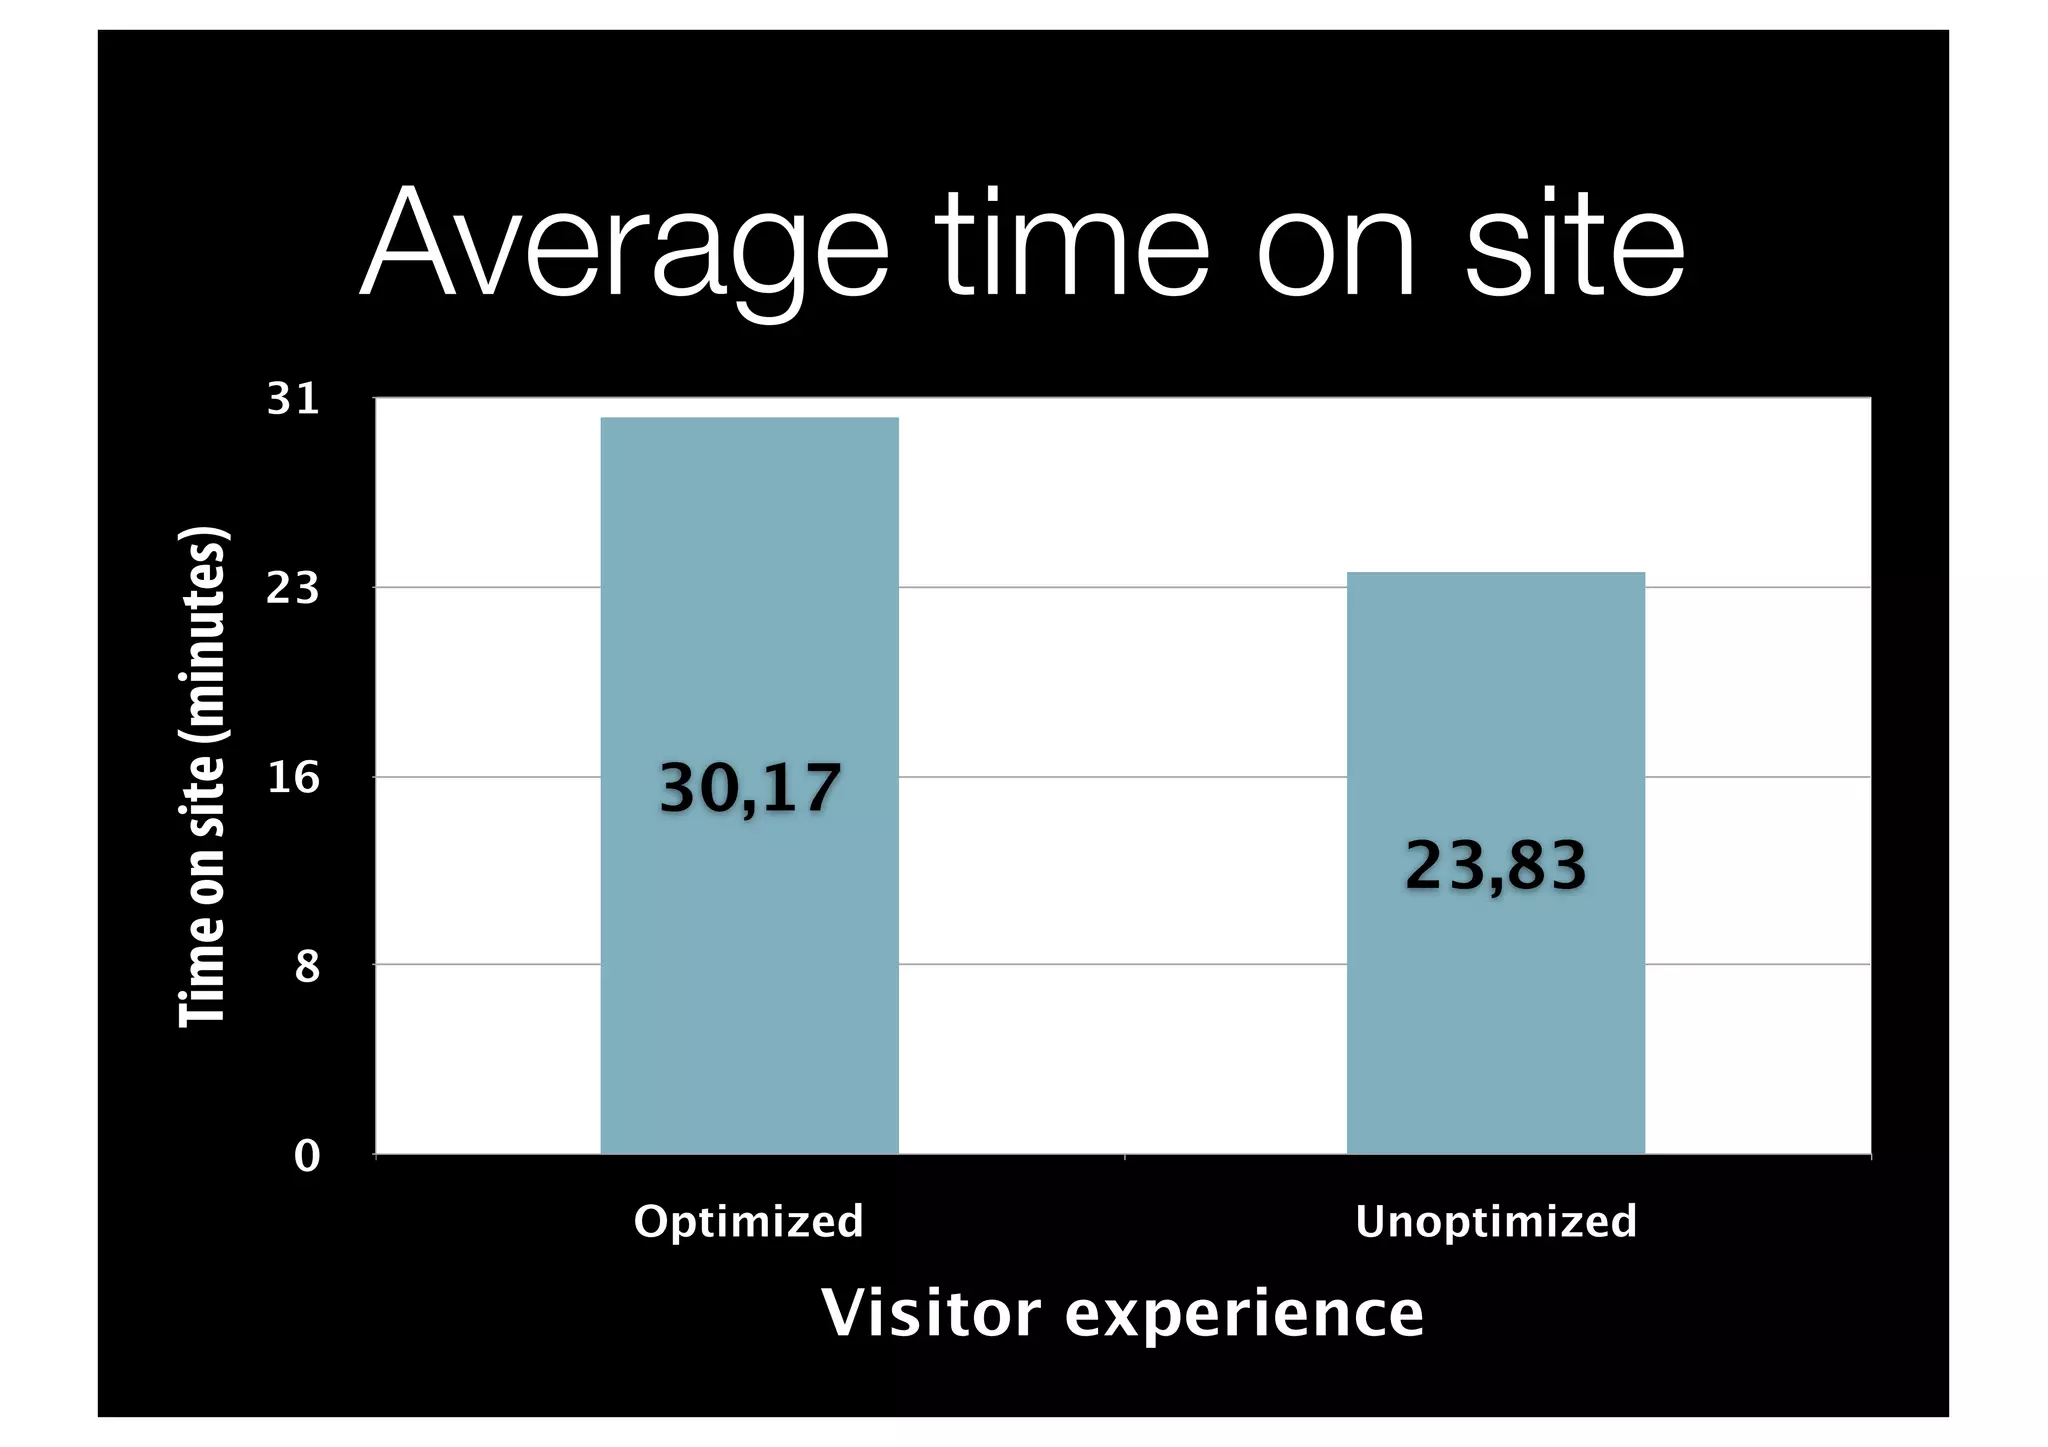
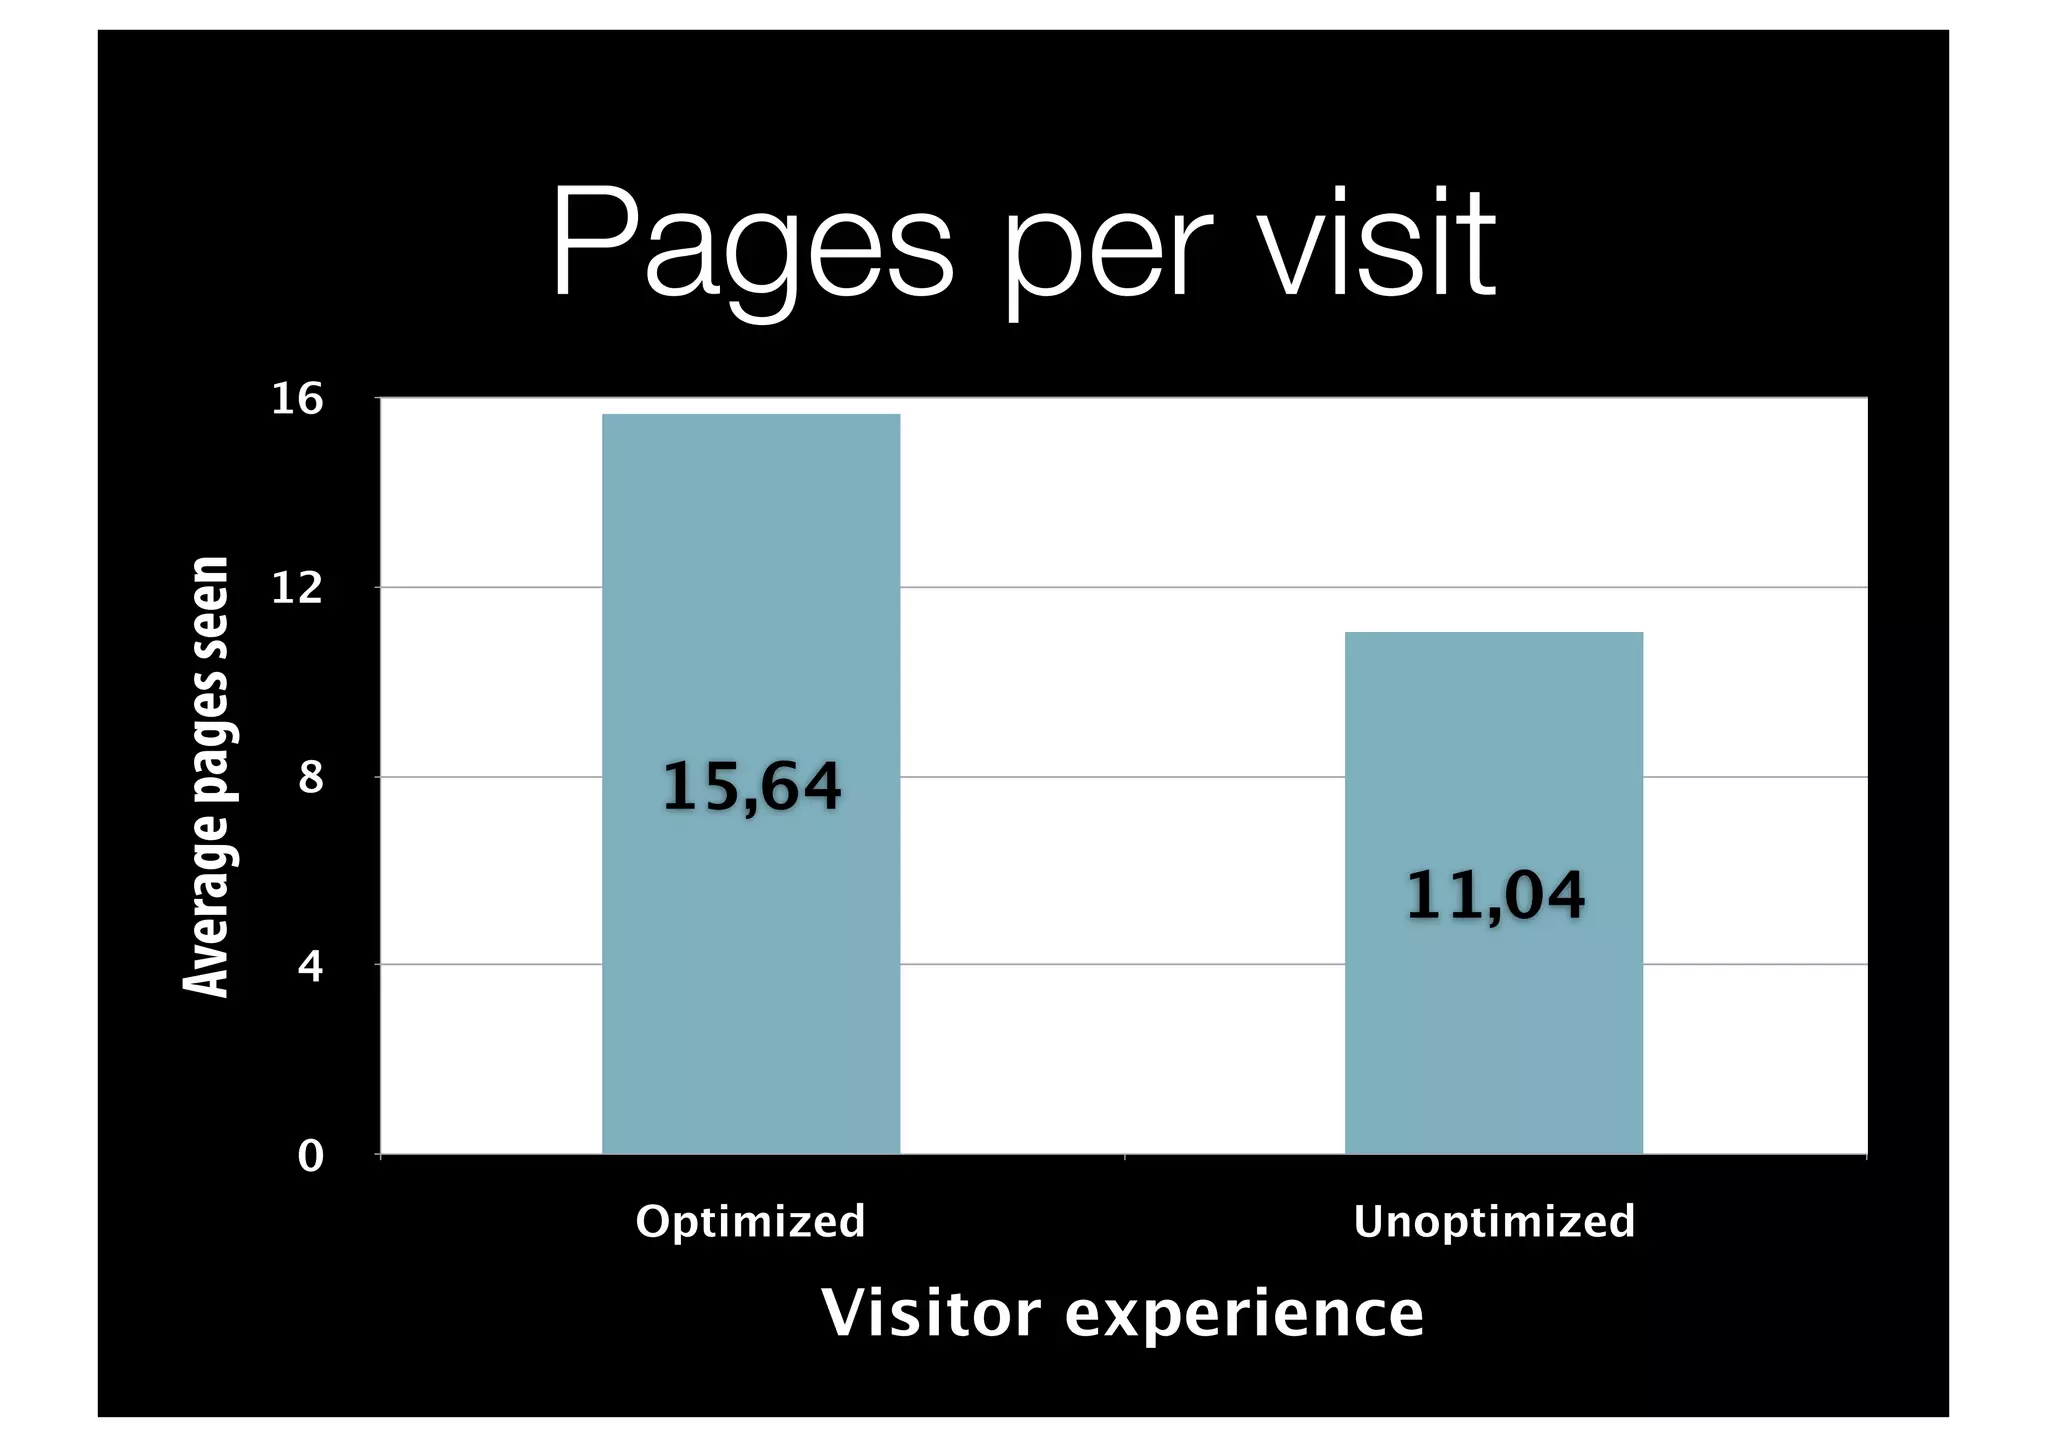
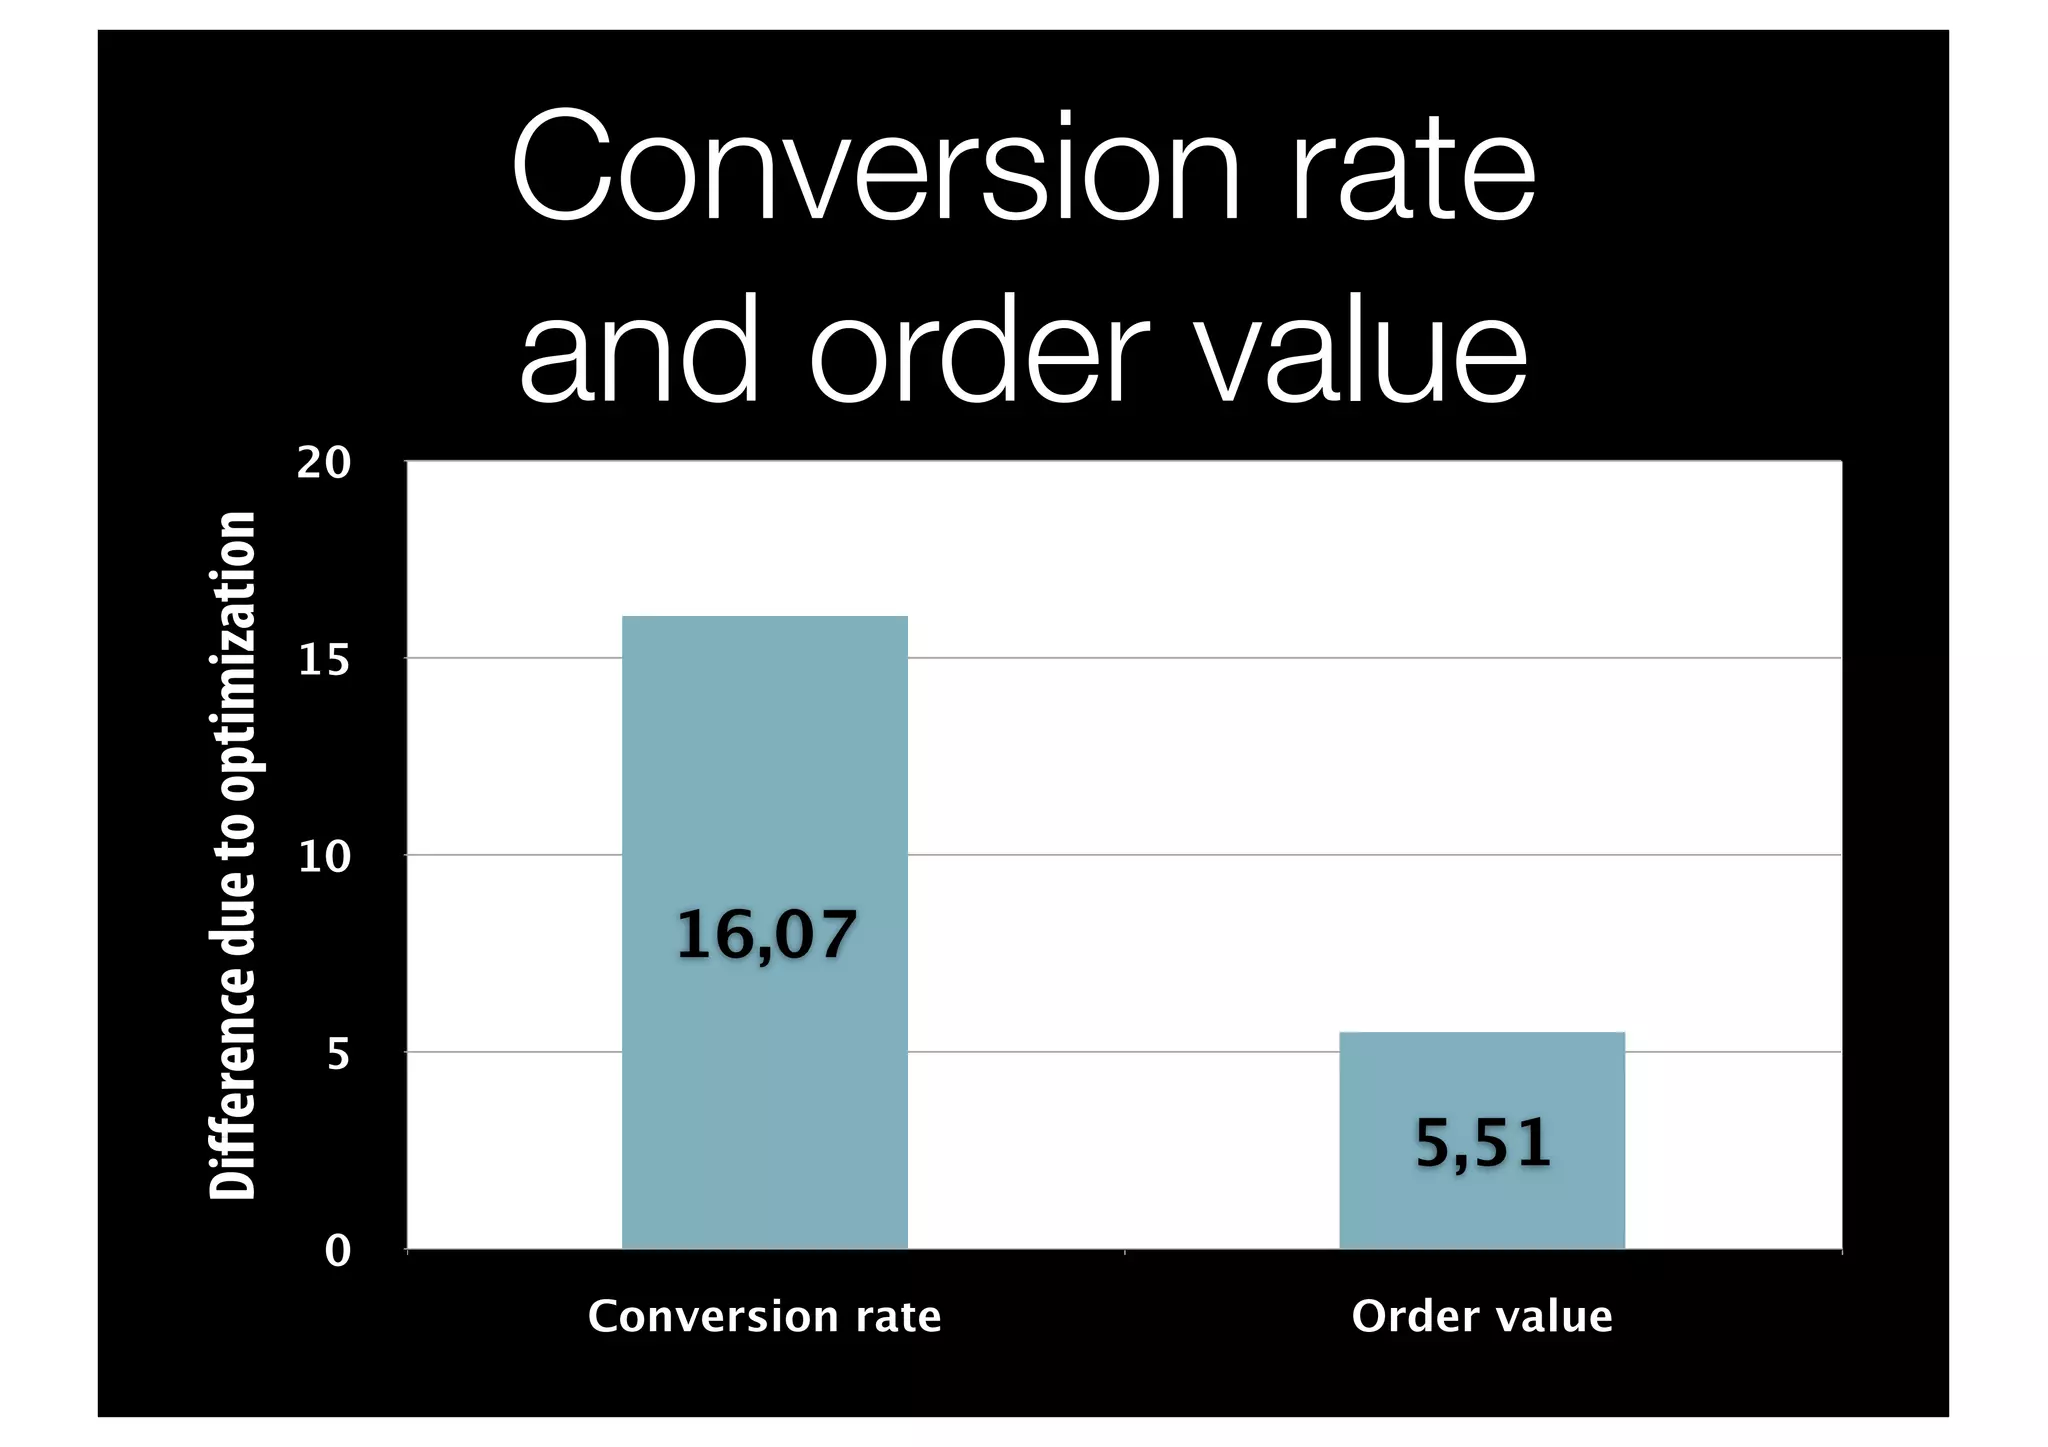
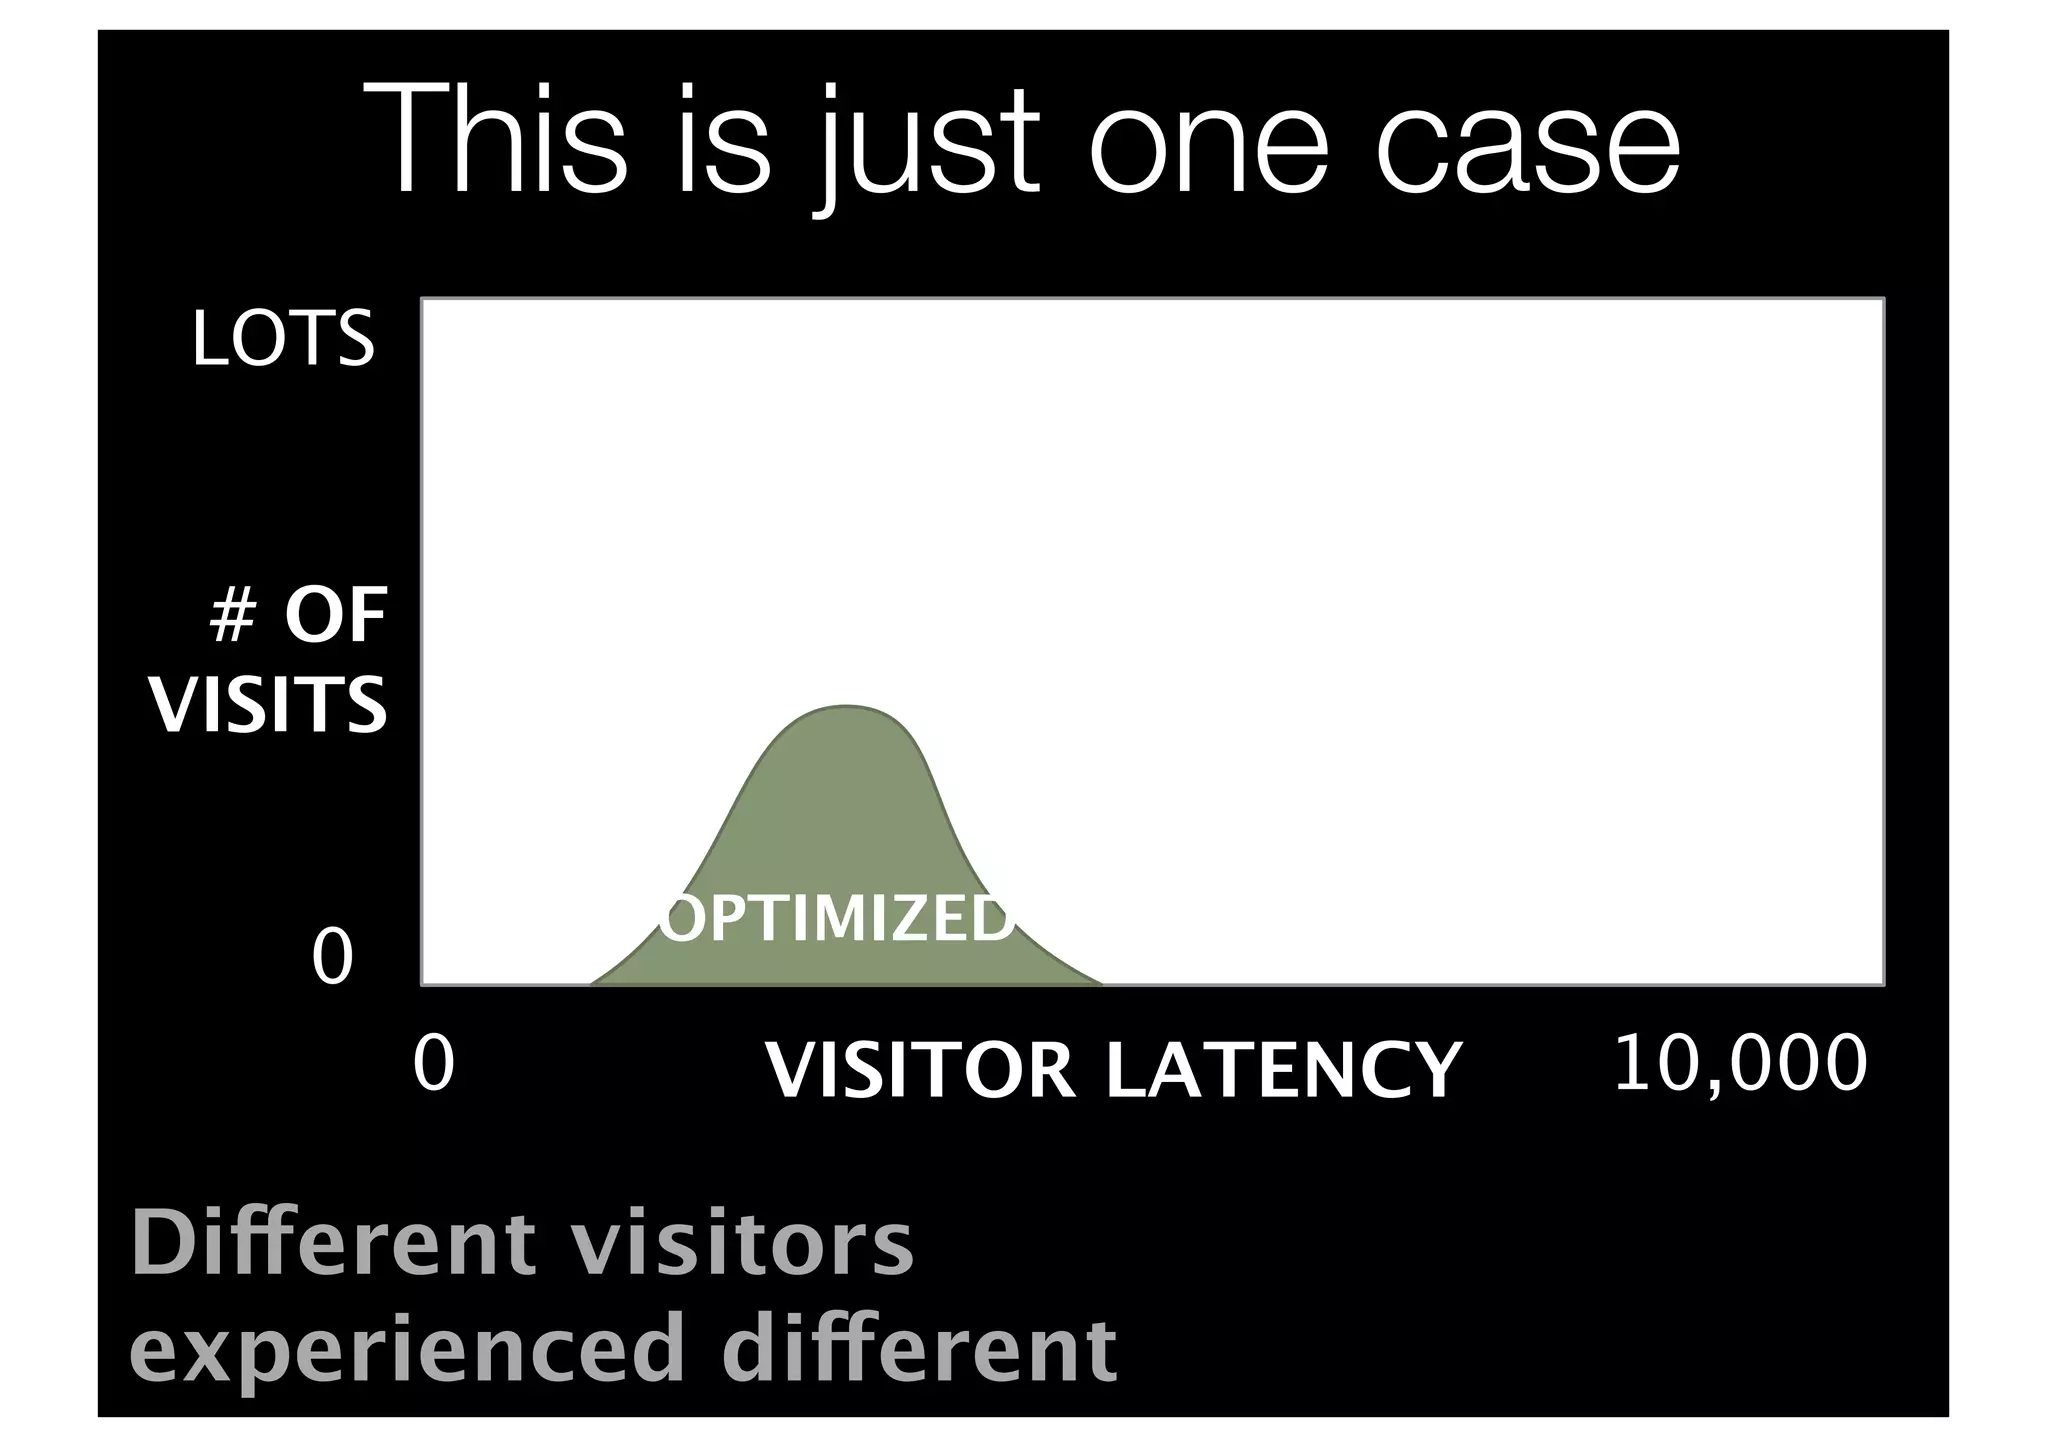
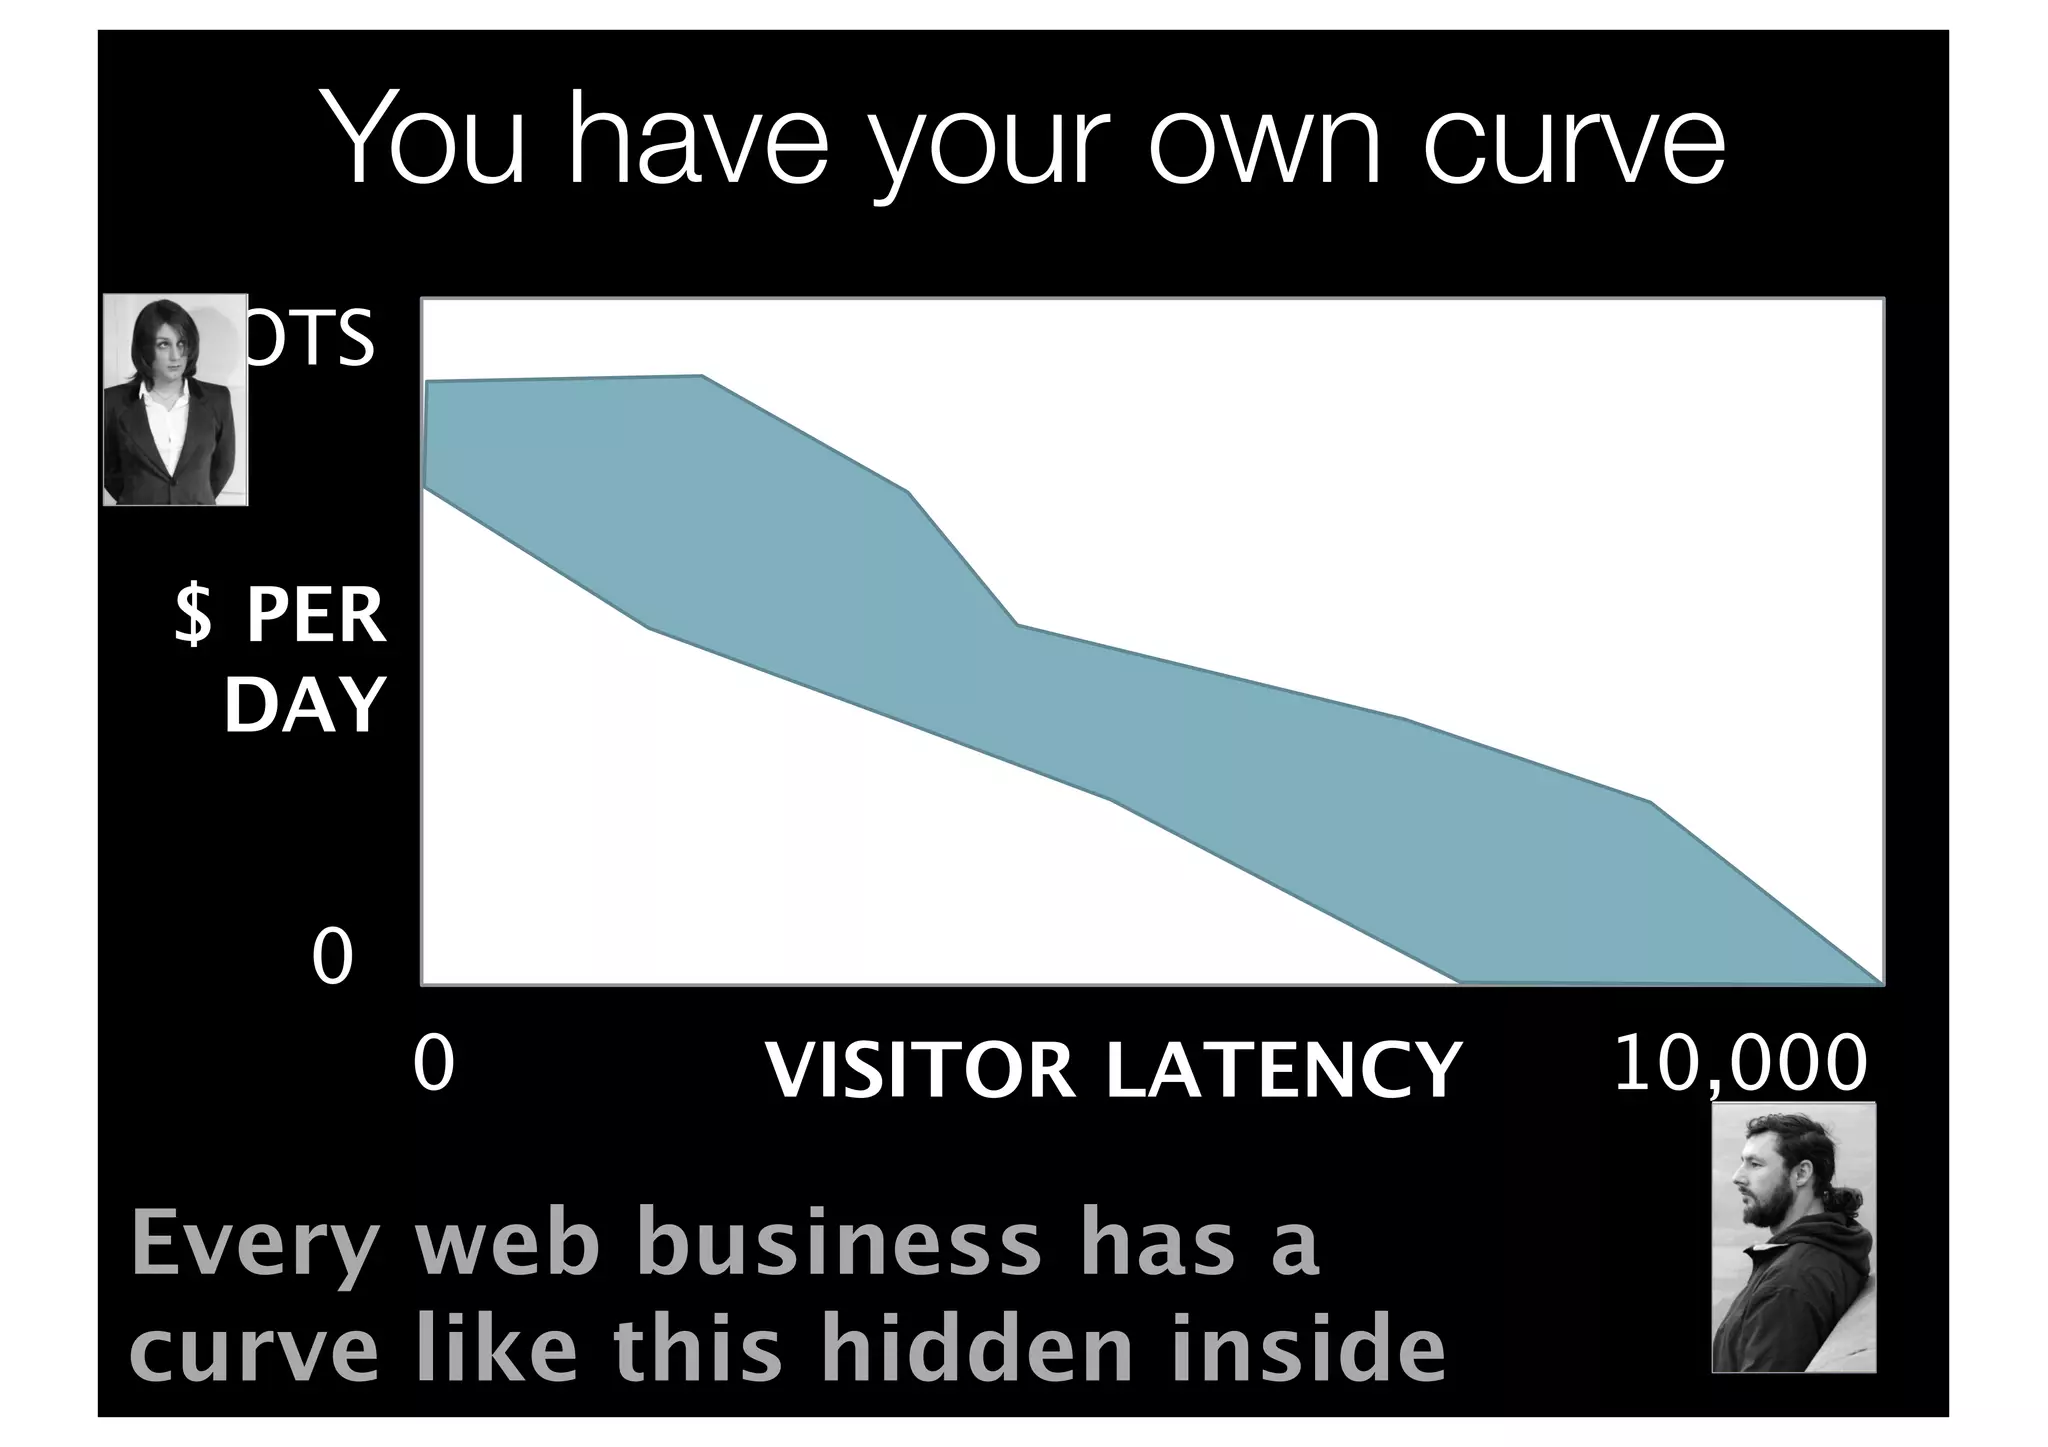
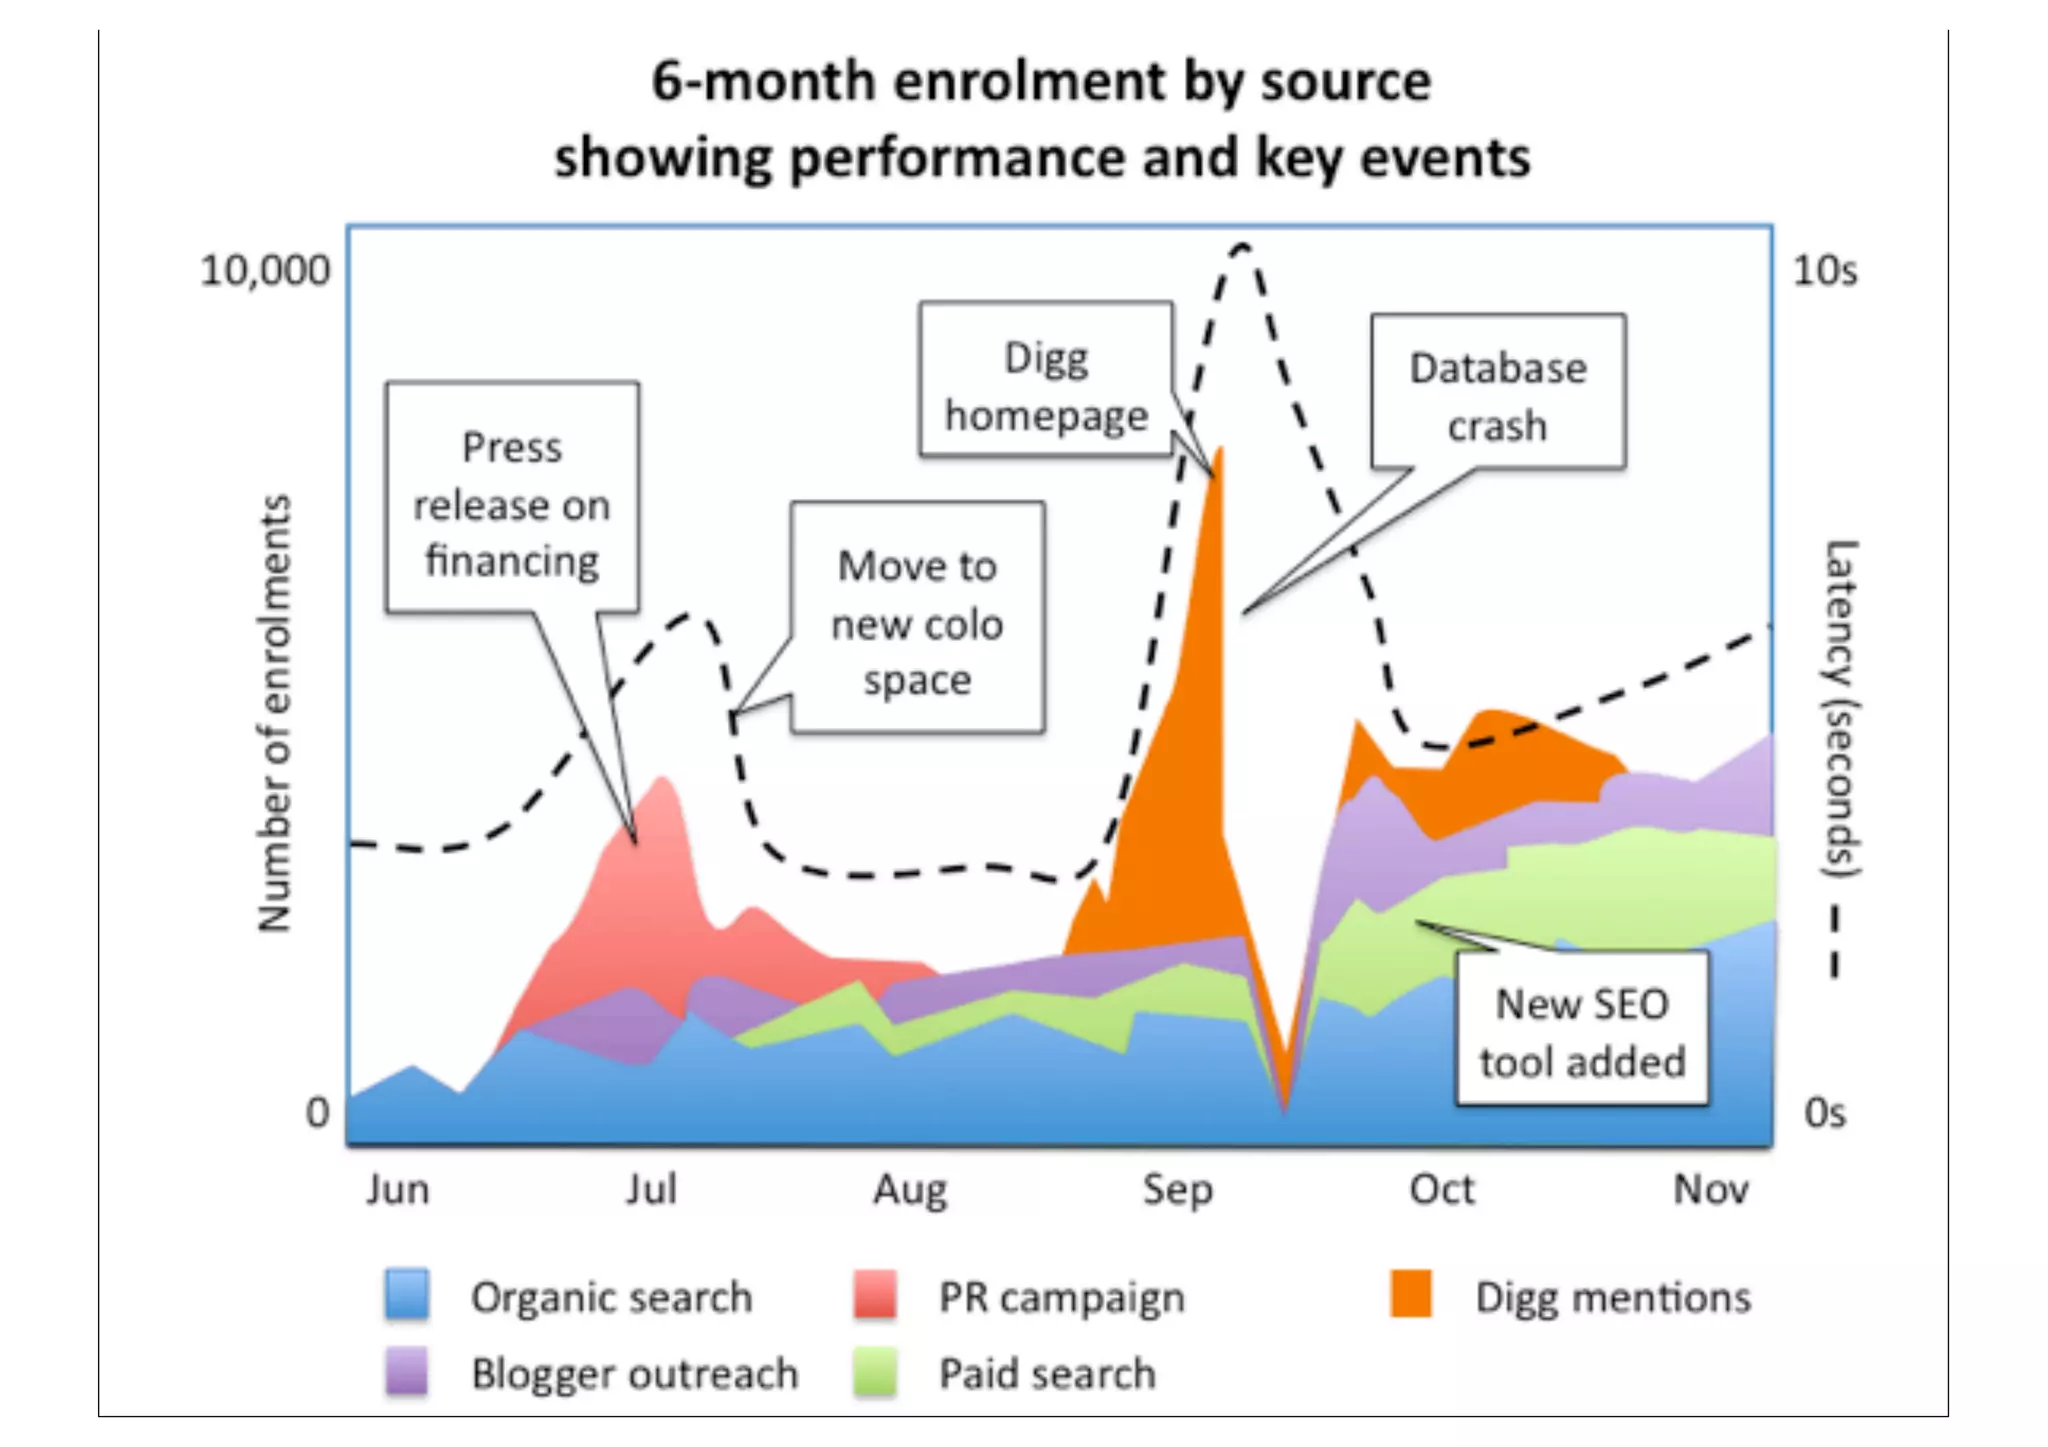
Who cares about customer
experience?
A Complete
Web Monitoring
perspective


    Web Analytics Conference 2010
  in collaboration with MeasureWorks
“Hard” data

  Analytics         Usability     Performability
(what did they   (how did they    (could they do
  do on the       interact with      what they
    site?)             it?)         wanted to?)

          Complete Web Monitoring
 Community            VoC          Competition
 (what were       (what were      (what are they
they saying?)        their           up to?)
                 motivations?)

                 “Soft” data
What did they do?
Web analytics
http://www.flickr.com/photos/diegocupolo/3511117614/
Accounting                                       Optimization


                                                          http://www.flickr.com/photos/sanchom/2963072255/
http://www.flickr.com/photos/thomasclaveirole/538819881/
How did they do it?
Web Interaction Analytics
http://www.flickr.com/photos/trekkyandy/189717616/
Why did they do it?
Voice of the Customer
http://www.flickr.com/photos/karola/3623768629/
Could they do it?
Performance & availability
What were they saying?
Community monitoring
!
What were they up to?
Competitive analysis
http://www.flickr.com/photos/31690139@N02/2965956581/
Online marketers want to
maximize their revenues.
http://www.davidross.com.mx/admin/wideimagerepository/sergioZymanAmp.jpg
http://www.goal-posts.net/media/fbl-181_cat_07_160_x_160.jpg
http://www.johnsoncontrols.com/publish/etc/medialib/jci/ps/Media_Kit.Par.25973.File.dat/complex_machinery_HIRES.JPG
http://www.infovisual.info/02/img_en/078%20Different%20land%20animals%201.jpg
http://upload.wikimedia.org/wikipedia/commons/0/0e/Soccer_Youth_Goal_Keeper.jpg
Websites
 have a dirty
 little secret


http://todaystatus.files.wordpress.com/2009/04/ww11-secret.jpg
http://www.inquisitr.com/2097/site-meter-causing-internet-explorer-failure/
http://www.flickr.com/photos/aleermakers/3455786409/
http://www.octulipfestival.com/images/Picture%20144.jpg
Figure 3          Interactive user productivity versus computer response time for human-intensive
                        interactions for system A

      E 600
                -
      3

      T                                                         -"   INTERACTIVE USER PRODUCTIVITY (IUP)
      w
                                                                -HUMAN-INTENSIVE COMPONENT OF IUP
      7                                                              MEASURED DATA (HUMAN-INTENSIVE

      E 500 -
                                                                 A
      z                                                          "   COMPONENT)
      U
      E


      -
      w
      E             0

      >
      -
      >
      -         -
          400
      3
      n
      F
      2
                        0
                            0


          300   -


          200   -


          100   -
                                                                                                 0


            0-                  I             1             I                I               I
                0               1             2             3               4               5
                                                                                  COMPUTER RESPONSE TIME (SI


(1981) A. J. Thadhani, IBM Systems Journal, Volume 20, number 4
10 s
 1s

100 ms
10 ms
        !   Zzz
http://www.flickr.com/photos/spunter/393793587   http://www.flickr.com/photos/laurenclose/2217307446
Everything	
  is	
  interwoven.
Shopzilla had another angle

•   Big, high-traffic site       •   16 month re-engineering
•   100M impressions a day      •   Page load from 6 seconds to
                                    1.2
•   8,000 searches a second
•   20-29M unique visitors a    •   Uptime from 99.65% to
    month                           99.97%

•   100M products               •   10% of previous hardware
                                    needs


                                           http://en.oreilly.com/velocity2009/public/schedule/detail/7709
5-12% increase in
    revenue.
Tying web latency to
business outcomes.
http://www.flickr.com/photos/spunter/393793587   http://www.flickr.com/photos/laurenclose/2217307446


     KPIs
http://www.flickr.com/photos/
    mrmoorey/160654236
ATTENTION            ENGAGEMENT CONVERSION
             NEW
 SEARCH     VISITO
   ES         RS
             GROWT                  CONVERSI
 TWEETS
            NUMB
               H
                     PAGE              ON
              ER             TIME     RATE
                       S
  MENTI               PER
                              ON       x
              OF             SITE
  ONS                VISIT           ORDER
            VISITS
              LOSS                   VALUE
  ADS       BOUN
              CE
  SEEN
             RATE
VISITOR        STRANGELOOP          WEB
                ACCELERATOR         SERVER
                   Decide
                   whether
                 to optimize

                                    Normal
              Accelerat
 Receive                            content
  page

                           Insert
Process
scripts     Optimize?     segment
                           marker

 Send
analytic      Unacceler


 GOOGLE
ANALYTICS
What we learned:
Traffic levels
                         9.000
Total number of visits


                         6.750


                         4.500
                                  8.505

                         2.250                         4.740

                            0
                                 Optimized            Unoptimized

                                       Visitor experience
Bounce rate
                      20
Visits that bounced


                      15


                      10

                           13,38%                14,35%
                      5


                      0
                           Optimized            Unoptimized

                                 Visitor experience
% visits marked “new”
% of visits that had no returning cookie


                                           14


                                           11


                                           7                            13,61%
                                                10,85%
                                           4


                                           0
                                                Optimized              Unoptimized

                                                       Visitor experience
That means...
                         9000
Value Number of visits


                         6750


                         4500    7.582

                                              4.095
                         2250


                                   923          645
                           0
                                 Optimized   Unoptimized
Average time on site
                         31
Time on site (minutes)


                         23


                         16       30,17
                                                          23,83
                         8


                         0
                                  Optimized             Unoptimized

                                         Visitor experience
Pages per visit
                     16
Average pages seen


                     12


                     8     15,64
                                                   11,04
                     4


                     0
                           Optimized             Unoptimized

                                  Visitor experience
Conversion rate
                                      and order value
                                 20
Difference due to optimization


                                 15


                                 10
                                          16,07
                                 5

                                                           5,51
                                 0
                                       Conversion rate   Order value
This is just one case
 LOTS


 # OF
VISITS

             OPTIMIZED
    0
         0     VISITOR LATENCY   10,000

Different visitors
experienced different
With one outcome
 LOTS


 # OF
VISITS
             21.58%
             BETTER
    0
         0    VISITOR LATENCY   10,000

Right now we have a single
experiment, and a single
With one outcome
 LOTS
         Best 5%            Worst 5%
 # OF
VISITS
                   21.58%
                   BETTER
    0
         0          VISITOR LATENCY    10,000

Visitors who were optimized
fall into a range – the 5th to
Lots of different results
 LOTS       24%

                  18%
$ PER                   14%
                              12%
 DAY
                                    9.5%
   0
        0         VISITOR LATENCY   10,000

If we have several
experiments, we can
You have your own curve
 LOTS


$ PER
 DAY


   0
        0    VISITOR LATENCY    10,000

Every web business has a
curve like this hidden inside
MeasureWorks - Tying web performance to analytics

MeasureWorks - Tying web performance to analytics