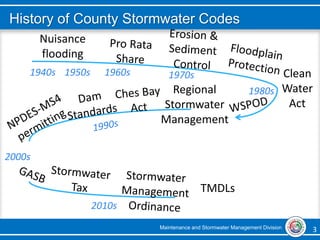
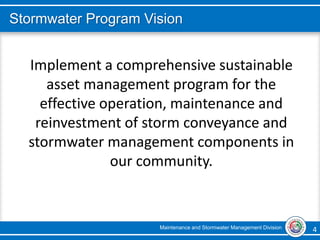
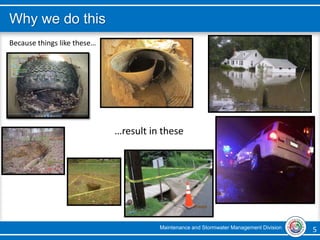
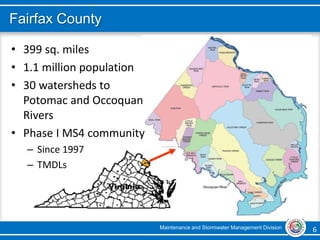
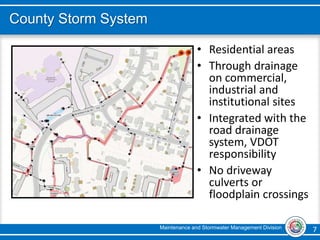
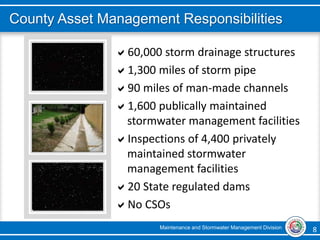
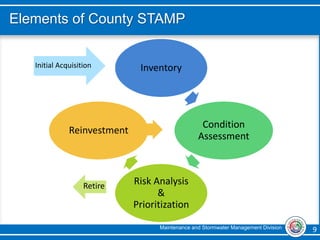
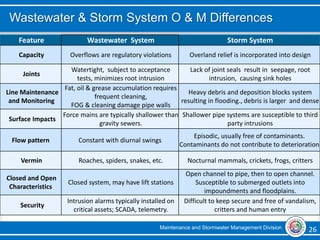
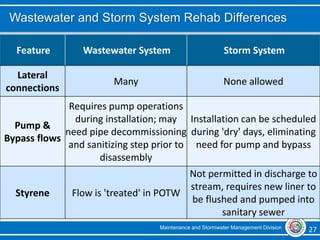
Stormwater Infrastructure Management
Storm Drainage Infrastructure Reinvestment Program
Water Asset Management Conference
December 3, 2015
Arlington, VA
Department of Public Works and Environmental Services
Working for You!
A Fairfax County, VA, publication
December 2015
Maintenance and Stormwater Management Division 2 2
Agenda
• History of County Stormwater Codes
• Stormwater Program Vision
• County Asset Management Responsibilities
• Elements of STAMP (Stormwater Asset Management Program)
• Growing Process
• Challenges
Maintenance and Stormwater Management Division 3 3
History of County Stormwater Codes
Nuisance
flooding
1940s Clean
Water
Act
1950s 1960s 1970s
1980s
2000s
2010s
Regional
Stormwater
Management
TMDLs
Maintenance and Stormwater Management Division 4 4
Stormwater Program Vision
Implement a comprehensive sustainable
asset management program for the
effective operation, maintenance and
reinvestment of storm conveyance and
stormwater management components in
our community.
Maintenance and Stormwater Management Division 5 5
Because things like these…
…result in these
Why we do this
Maintenance and Stormwater Management Division 6 6
Fairfax County
• 399 sq. miles
• 1.1 million population
• 30 watersheds to
Potomac and Occoquan
Rivers
• Phase I MS4 community
– Since 1997
– TMDLs
Maintenance and Stormwater Management Division 7 7
County Storm System
• Residential areas
• Through drainage
on commercial,
industrial and
institutional sites
• Integrated with the
road drainage
system, VDOT
responsibility
• No driveway
culverts or
floodplain crossings
Maintenance and Stormwater Management Division 8 8
County Asset Management Responsibilities
60,000 storm drainage structures
1,300 miles of storm pipe
90 miles of man-made channels
1,600 publically maintained
stormwater management facilities
Inspections of 4,400 privately
maintained stormwater
management facilities
20 State regulated dams
No CSOs
Maintenance and Stormwater Management Division 9 9
Elements of County STAMP
Inventory
Condition
Assessment
Risk Analysis
&
Prioritization
Reinvestment
Initial Acquisition
Retire
Maintenance and Stormwater Management Division 10 10
Inventory
• Easements
• As-built drawings
(length, size, slope, inverts,
material, location, etc.)
• Walking survey
• GPS
• CCTV
• Repair activity
• Reports
- GASB-34
- MS4
• Maps for condition
assessment
• Repair history
Maintenance and Stormwater Management Division 11 11
Inventory – Attributes
Size
Material & Shape
Location
Sample size: 605 miles
0
50
100
150
200
250
300
350
1920-95 1930-85 1940-75 1950-65 1960-55 1970-45 1980-35 1990-25 2000-15 2010-5
Miles of Storm System Constructed by Decade:
ApproximateAge of System
Decade Constructed - Approximate Age (years)
MilesofStormSystemConstructed
Age
Maintenance and Stormwater Management Division 12 12
Condition Assessment
• Complaint
investigation
• Walking survey
• Pole camera
• CCTV in-house
• CCTV contracted
• Repair activity
• Defect scoring
- Structural
- O & M
•Reports
- MS4 inspections
- Video inspections
• O&M work orders
• Renewal projects
Maintenance and Stormwater Management Division 13 13
Condition Assessment
Walking Survey Pole Camera CCTV Camera
Missing Pipe*
Maintenance and Stormwater Management Division 14 14
Risk Analysis & Prioritization
• Likelihood of Failure
- Condition assessment
- remaining life, material
• Consequence of Failure
- location - capacity/slope
- roads - utility conflicts
- original design/
construction flaws
• Prioritized assets
for reinvestment
Maintenance and Stormwater Management Division 15 15
Likelihood of Failure - Condition
Structural
Score
2% >5000
12% >4000
38% >3000
25% >2000
23% >1000
O & M
Score
12% >5000
15% >4000
17% >3000
49% >2000
7% >1000
Maintenance and Stormwater Management Division 16 16
Consequence of Failure - Risk
Who and What will be affected by failure and by how much
Example Factors
Distance to buildings
Distance to roads
Crossing utilities
Pipe capacity
Maintenance and Stormwater Management Division 17 17
Ranking/Prioritizing
Rank Quick Score Project Cost Year
1 5Z4Z Scott St 190,000 2016
2 5B42 Lake Dr 20,000 2016
3 5A3A Valley Ave 28,000 2016
4 5444 Meadow Ct 18,000 2016
5 533A King Rd 29,000 2016
6 5232 Farm Ln 22,000 2016
$250k budget
Rank Quick Score Project Cost Year
1 5Z4Z Scott St 190,000 2016
2 5B42 Lake Dr 20,000 2016
3 5A3A Valley Ave 28,000 2016
4 5444 Meadow Ct 18,000 2016
5 533A King Rd 29,000 2016
6 5232 Farm Ln 22,000 2016
Rank Quick Score Project Cost Year
1
2
3
4 5444 Meadow Ct 18,000 2016
5 533A King Rd 29,000 2016
6 5232 Farm Ln 22,000 2016
Rank Quick Score Project Cost Year
5A3F West Ct 130,000 2017
534D Duvawn St 89,000 2017
5324 Rose Ln 25,000 2017
5444 Meadow Ct 18,000 2016
533A King Rd 29,000 2016
5232 Farm Ln 22,000 2016
Rank Quick Score Project Cost Year
1 5A3F West Ct 130,000 2017
2 5444 Meadow Ct 18,000 2016
3 534D Duvawn St 89,000 2017
4 533A King Rd 29,000 2016
5 5324 Rose Ln 25,000 2017
6 5232 Farm Ln 22,000 2016
$275k budget
Likelihood of Failure × Consequence of Failure  Risk
Maintenance and Stormwater Management Division 18 18
Reinvestment
• Prioritization
• Historical costs
• O & M cost
• Economic cost
• Social cost
• Environmental cost
• Prioritized assets
for reinvestment
- repair
- renew
- replace
• Reinvestment cost
Maintenance and Stormwater Management Division 19 19
Project Initiation
Review Data Site Recon
Identify
Solutions
 Easement
verification
 As-built plans
 Video inspection
report
 Complaint
history
 Repair history
 Institutional
knowledge/
experience
 Utility conflicts
 Structure
proximity to asset
(construction
conflicts)
 Equipment
accessibility
 Revegetation
opportunities
 Disruption to
property owner &
businesses
 Reinvest
- Repair
. Point repair
. Eliminate
third party
intrusion
. Reset EW/ES
- Renew
. CIPPL
. Slip line
. Test & Seal
- Replace
 Evaluate costs
 Select
appropriate
alternative
 Secure funding
 Design
 Work order for
repair (in-house)
 Contract
- capital project
- cleaning/
flushing
Implement
Maintenance and Stormwater Management Division 20 20
Reinvestment Options
Slip Lining
Open Channels
Pipe Replacement Point RepairRepair Renew Replace
Maintenance and Stormwater Management Division 21 21
Growing Process
Inventory
Condition
Assessment
Risk Analysis &
Prioritization
Reinvestment
Inventory
Condition
Assessment
Remaining
Life / Predict
Failure
Life Cycle &
Replacement
Costs
Level of
Service
Risk
Optimize
O&M
Investment
Optimize
Capital
Investment
Funding
Strategy
Comprehensive
Program
Define
Failure
Weighting
Evaluation
Optimize
Investment
Maintenance and Stormwater Management Division 22 22
How do we know we succeeded?
• Estimate 3.5% of system is in some stage of failure
• Ratio of proactive vs reactive improvements
- Target as high a number as possible {(1% * 1300 mi)/(0.1 mi) = 130}
Fiscal Year
ProactivevsReactiveRatio
1.9 1.3 1.8 2.3 3 4 4.9 5.7 7.3 9
15.7
32.3
99
0.0
20.0
40.0
60.0
80.0
100.0
'13 '14 '15 '16 '17 '18 '19 '20 '21 '22 '23 '24 '25
Maintenance and Stormwater Management Division 23 23
Challenges
• Contract procurement – innovative solutions take time
• Staff training and technology – a good investment
• Emergency response – unpredictable, takes us off task, delays schedules
• Flexibility is an asset
– Be willing to change direction, accommodate citizen/political expectations
– Build a scalable program to accommodate fluctuating funding/budgets
• Realize the differences in rehabilitation methods
– Environmental impacts – styrene
– Contract line items – influenced by lateral connections and liner thickness
– Bypass/flow control – may or may not be necessary
– The shorter storm pipe segments impact mobilization and set-up costs as
compared to wastewater systems
Maintenance and Stormwater Management Division 24 24
Wastewater & Storm System Structural Differences
Feature Wastewater System Storm System
Construction
Quality
High
Rely on contractor &
third party. inspections
Pipe section
lengths
10', 12', 20’, fewer joints 4', 6' & 8’, many joints
Lateral
connections
Essential Not permitted, unauthorized
Lift holes None, slings or pipe hooks.
Requires seals: leaks cause sink holes,
root intrusion cause fractures
System depth Typically deeper, beneath storm Shallower, above sanitary
Acceptance
Tests
Mandatory, health and water quality,
leaks not tolerated
Not required, visual inspection
Chemical
breakdown
Constant flows, chemical and gaseous
exposure, corrosive attack on walls
Episodic flows with storm events,
usually free of contaminants
Maintenance and Stormwater Management Division 25 25
Wastewater & Storm System Structural Differences
Feature Wastewater System Storm System
Third party
intrusions
Susceptible, not included in
underground location programs for
digging
Higher susceptibility due to shallower
nature, not included in underground
location programs for digging
Infiltration
type
Groundwater more likely due to
deeper system; Stormwater from
defects or deterioration
Saturating water due to shallower system,
less soil overburden, sink holes develop
quicker
Infiltration
leaks
Reduces capacity,
increases treatment costs
Carries soil from pipe envelope,
causing voids/sink holes,
increased standards for joint seals
Abrasive flow
Turbulence associated with pumping
and elevation and directional changes
Debris may scour pipe walls;
debris particles are larger,
harder and more dense
Pressure flow Yes Not usually, more so in coastal areas.
Gravity flow Yes Yes
Destination Treatment plant Stream system (Waters of the U.S.)
Maintenance and Stormwater Management Division 26 26
Feature Wastewater System Storm System
Capacity Overflows are regulatory violations Overland relief is incorporated into design
Joints
Watertight, subject to acceptance
tests, minimizes root intrusion
Lack of joint seals result in seepage, root
intrusion, causing sink holes
Line Maintenance
and Monitoring
Fat, oil & grease accumulation requires
frequent cleaning,
FOG & cleaning damage pipe walls
Heavy debris and deposition blocks system
resulting in flooding., debris is larger and dense
Surface Impacts
Force mains are typically shallower than
gravity sewers.
Shallower pipe systems are susceptible to third
party intrusions
Flow pattern Constant with diurnal swings
Episodic, usually free of contaminants.
Contaminants do not contribute to deterioration
Vermin Roaches, spiders, snakes, etc. Nocturnal mammals, crickets, frogs, critters
Closed and Open
Characteristics
Closed system, may have lift stations
Open channel to pipe, then to open channel.
Susceptible to submerged outlets into
impoundments and floodplains.
Security
Intrusion alarms typically installed on
critical assets; SCADA, telemetry.
Difficult to keep secure and free of vandalism,
critters and human entry
Wastewater & Storm System O & M Differences
Maintenance and Stormwater Management Division 27 27
Wastewater and Storm System Rehab Differences
Feature Wastewater System Storm System
Lateral
connections
Many None allowed
Pump &
Bypass flows
Requires pump operations
during installation; may
need pipe decommissioning
and sanitizing step prior to
disassembly
Installation can be scheduled
during 'dry' days, eliminating
need for pump and bypass
Styrene Flow is 'treated' in POTW
Not permitted in discharge to
stream, requires new liner to
be flushed and pumped into
sanitary sewer
Maintenance and Stormwater Management Division
Contact:
Valerie Tucker, PE, Storm Drainage Section Chief
Amy Linderman, Storm Drainage Section Engineer
Maintenance and Stormwater Management Division
Department of Public Works and Environmental Services
County of Fairfax, Virginia
For more information or to request this document in an alternate format,
call 703-877-2800, TTY 711
Valerie.Tucker@fairfaxcounty.gov
Amy.Linderman@fairfaxcounty.gov
www.fairfaxcounty.gov/dpwes
28 28
For More Information

Stormwater Infrastructure Management-December 2015

  • 1.
    Stormwater Infrastructure Management StormDrainage Infrastructure Reinvestment Program Water Asset Management Conference December 3, 2015 Arlington, VA Department of Public Works and Environmental Services Working for You! A Fairfax County, VA, publication December 2015
  • 2.
    Maintenance and StormwaterManagement Division 2 2 Agenda • History of County Stormwater Codes • Stormwater Program Vision • County Asset Management Responsibilities • Elements of STAMP (Stormwater Asset Management Program) • Growing Process • Challenges
  • 3.
    Maintenance and StormwaterManagement Division 3 3 History of County Stormwater Codes Nuisance flooding 1940s Clean Water Act 1950s 1960s 1970s 1980s 2000s 2010s Regional Stormwater Management TMDLs
  • 4.
    Maintenance and StormwaterManagement Division 4 4 Stormwater Program Vision Implement a comprehensive sustainable asset management program for the effective operation, maintenance and reinvestment of storm conveyance and stormwater management components in our community.
  • 5.
    Maintenance and StormwaterManagement Division 5 5 Because things like these… …result in these Why we do this
  • 6.
    Maintenance and StormwaterManagement Division 6 6 Fairfax County • 399 sq. miles • 1.1 million population • 30 watersheds to Potomac and Occoquan Rivers • Phase I MS4 community – Since 1997 – TMDLs
  • 7.
    Maintenance and StormwaterManagement Division 7 7 County Storm System • Residential areas • Through drainage on commercial, industrial and institutional sites • Integrated with the road drainage system, VDOT responsibility • No driveway culverts or floodplain crossings
  • 8.
    Maintenance and StormwaterManagement Division 8 8 County Asset Management Responsibilities 60,000 storm drainage structures 1,300 miles of storm pipe 90 miles of man-made channels 1,600 publically maintained stormwater management facilities Inspections of 4,400 privately maintained stormwater management facilities 20 State regulated dams No CSOs
  • 9.
    Maintenance and StormwaterManagement Division 9 9 Elements of County STAMP Inventory Condition Assessment Risk Analysis & Prioritization Reinvestment Initial Acquisition Retire
  • 10.
    Maintenance and StormwaterManagement Division 10 10 Inventory • Easements • As-built drawings (length, size, slope, inverts, material, location, etc.) • Walking survey • GPS • CCTV • Repair activity • Reports - GASB-34 - MS4 • Maps for condition assessment • Repair history
  • 11.
    Maintenance and StormwaterManagement Division 11 11 Inventory – Attributes Size Material & Shape Location Sample size: 605 miles 0 50 100 150 200 250 300 350 1920-95 1930-85 1940-75 1950-65 1960-55 1970-45 1980-35 1990-25 2000-15 2010-5 Miles of Storm System Constructed by Decade: ApproximateAge of System Decade Constructed - Approximate Age (years) MilesofStormSystemConstructed Age
  • 12.
    Maintenance and StormwaterManagement Division 12 12 Condition Assessment • Complaint investigation • Walking survey • Pole camera • CCTV in-house • CCTV contracted • Repair activity • Defect scoring - Structural - O & M •Reports - MS4 inspections - Video inspections • O&M work orders • Renewal projects
  • 13.
    Maintenance and StormwaterManagement Division 13 13 Condition Assessment Walking Survey Pole Camera CCTV Camera Missing Pipe*
  • 14.
    Maintenance and StormwaterManagement Division 14 14 Risk Analysis & Prioritization • Likelihood of Failure - Condition assessment - remaining life, material • Consequence of Failure - location - capacity/slope - roads - utility conflicts - original design/ construction flaws • Prioritized assets for reinvestment
  • 15.
    Maintenance and StormwaterManagement Division 15 15 Likelihood of Failure - Condition Structural Score 2% >5000 12% >4000 38% >3000 25% >2000 23% >1000 O & M Score 12% >5000 15% >4000 17% >3000 49% >2000 7% >1000
  • 16.
    Maintenance and StormwaterManagement Division 16 16 Consequence of Failure - Risk Who and What will be affected by failure and by how much Example Factors Distance to buildings Distance to roads Crossing utilities Pipe capacity
  • 17.
    Maintenance and StormwaterManagement Division 17 17 Ranking/Prioritizing Rank Quick Score Project Cost Year 1 5Z4Z Scott St 190,000 2016 2 5B42 Lake Dr 20,000 2016 3 5A3A Valley Ave 28,000 2016 4 5444 Meadow Ct 18,000 2016 5 533A King Rd 29,000 2016 6 5232 Farm Ln 22,000 2016 $250k budget Rank Quick Score Project Cost Year 1 5Z4Z Scott St 190,000 2016 2 5B42 Lake Dr 20,000 2016 3 5A3A Valley Ave 28,000 2016 4 5444 Meadow Ct 18,000 2016 5 533A King Rd 29,000 2016 6 5232 Farm Ln 22,000 2016 Rank Quick Score Project Cost Year 1 2 3 4 5444 Meadow Ct 18,000 2016 5 533A King Rd 29,000 2016 6 5232 Farm Ln 22,000 2016 Rank Quick Score Project Cost Year 5A3F West Ct 130,000 2017 534D Duvawn St 89,000 2017 5324 Rose Ln 25,000 2017 5444 Meadow Ct 18,000 2016 533A King Rd 29,000 2016 5232 Farm Ln 22,000 2016 Rank Quick Score Project Cost Year 1 5A3F West Ct 130,000 2017 2 5444 Meadow Ct 18,000 2016 3 534D Duvawn St 89,000 2017 4 533A King Rd 29,000 2016 5 5324 Rose Ln 25,000 2017 6 5232 Farm Ln 22,000 2016 $275k budget Likelihood of Failure × Consequence of Failure  Risk
  • 18.
    Maintenance and StormwaterManagement Division 18 18 Reinvestment • Prioritization • Historical costs • O & M cost • Economic cost • Social cost • Environmental cost • Prioritized assets for reinvestment - repair - renew - replace • Reinvestment cost
  • 19.
    Maintenance and StormwaterManagement Division 19 19 Project Initiation Review Data Site Recon Identify Solutions  Easement verification  As-built plans  Video inspection report  Complaint history  Repair history  Institutional knowledge/ experience  Utility conflicts  Structure proximity to asset (construction conflicts)  Equipment accessibility  Revegetation opportunities  Disruption to property owner & businesses  Reinvest - Repair . Point repair . Eliminate third party intrusion . Reset EW/ES - Renew . CIPPL . Slip line . Test & Seal - Replace  Evaluate costs  Select appropriate alternative  Secure funding  Design  Work order for repair (in-house)  Contract - capital project - cleaning/ flushing Implement
  • 20.
    Maintenance and StormwaterManagement Division 20 20 Reinvestment Options Slip Lining Open Channels Pipe Replacement Point RepairRepair Renew Replace
  • 21.
    Maintenance and StormwaterManagement Division 21 21 Growing Process Inventory Condition Assessment Risk Analysis & Prioritization Reinvestment Inventory Condition Assessment Remaining Life / Predict Failure Life Cycle & Replacement Costs Level of Service Risk Optimize O&M Investment Optimize Capital Investment Funding Strategy Comprehensive Program Define Failure Weighting Evaluation Optimize Investment
  • 22.
    Maintenance and StormwaterManagement Division 22 22 How do we know we succeeded? • Estimate 3.5% of system is in some stage of failure • Ratio of proactive vs reactive improvements - Target as high a number as possible {(1% * 1300 mi)/(0.1 mi) = 130} Fiscal Year ProactivevsReactiveRatio 1.9 1.3 1.8 2.3 3 4 4.9 5.7 7.3 9 15.7 32.3 99 0.0 20.0 40.0 60.0 80.0 100.0 '13 '14 '15 '16 '17 '18 '19 '20 '21 '22 '23 '24 '25
  • 23.
    Maintenance and StormwaterManagement Division 23 23 Challenges • Contract procurement – innovative solutions take time • Staff training and technology – a good investment • Emergency response – unpredictable, takes us off task, delays schedules • Flexibility is an asset – Be willing to change direction, accommodate citizen/political expectations – Build a scalable program to accommodate fluctuating funding/budgets • Realize the differences in rehabilitation methods – Environmental impacts – styrene – Contract line items – influenced by lateral connections and liner thickness – Bypass/flow control – may or may not be necessary – The shorter storm pipe segments impact mobilization and set-up costs as compared to wastewater systems
  • 24.
    Maintenance and StormwaterManagement Division 24 24 Wastewater & Storm System Structural Differences Feature Wastewater System Storm System Construction Quality High Rely on contractor & third party. inspections Pipe section lengths 10', 12', 20’, fewer joints 4', 6' & 8’, many joints Lateral connections Essential Not permitted, unauthorized Lift holes None, slings or pipe hooks. Requires seals: leaks cause sink holes, root intrusion cause fractures System depth Typically deeper, beneath storm Shallower, above sanitary Acceptance Tests Mandatory, health and water quality, leaks not tolerated Not required, visual inspection Chemical breakdown Constant flows, chemical and gaseous exposure, corrosive attack on walls Episodic flows with storm events, usually free of contaminants
  • 25.
    Maintenance and StormwaterManagement Division 25 25 Wastewater & Storm System Structural Differences Feature Wastewater System Storm System Third party intrusions Susceptible, not included in underground location programs for digging Higher susceptibility due to shallower nature, not included in underground location programs for digging Infiltration type Groundwater more likely due to deeper system; Stormwater from defects or deterioration Saturating water due to shallower system, less soil overburden, sink holes develop quicker Infiltration leaks Reduces capacity, increases treatment costs Carries soil from pipe envelope, causing voids/sink holes, increased standards for joint seals Abrasive flow Turbulence associated with pumping and elevation and directional changes Debris may scour pipe walls; debris particles are larger, harder and more dense Pressure flow Yes Not usually, more so in coastal areas. Gravity flow Yes Yes Destination Treatment plant Stream system (Waters of the U.S.)
  • 26.
    Maintenance and StormwaterManagement Division 26 26 Feature Wastewater System Storm System Capacity Overflows are regulatory violations Overland relief is incorporated into design Joints Watertight, subject to acceptance tests, minimizes root intrusion Lack of joint seals result in seepage, root intrusion, causing sink holes Line Maintenance and Monitoring Fat, oil & grease accumulation requires frequent cleaning, FOG & cleaning damage pipe walls Heavy debris and deposition blocks system resulting in flooding., debris is larger and dense Surface Impacts Force mains are typically shallower than gravity sewers. Shallower pipe systems are susceptible to third party intrusions Flow pattern Constant with diurnal swings Episodic, usually free of contaminants. Contaminants do not contribute to deterioration Vermin Roaches, spiders, snakes, etc. Nocturnal mammals, crickets, frogs, critters Closed and Open Characteristics Closed system, may have lift stations Open channel to pipe, then to open channel. Susceptible to submerged outlets into impoundments and floodplains. Security Intrusion alarms typically installed on critical assets; SCADA, telemetry. Difficult to keep secure and free of vandalism, critters and human entry Wastewater & Storm System O & M Differences
  • 27.
    Maintenance and StormwaterManagement Division 27 27 Wastewater and Storm System Rehab Differences Feature Wastewater System Storm System Lateral connections Many None allowed Pump & Bypass flows Requires pump operations during installation; may need pipe decommissioning and sanitizing step prior to disassembly Installation can be scheduled during 'dry' days, eliminating need for pump and bypass Styrene Flow is 'treated' in POTW Not permitted in discharge to stream, requires new liner to be flushed and pumped into sanitary sewer
  • 28.
    Maintenance and StormwaterManagement Division Contact: Valerie Tucker, PE, Storm Drainage Section Chief Amy Linderman, Storm Drainage Section Engineer Maintenance and Stormwater Management Division Department of Public Works and Environmental Services County of Fairfax, Virginia For more information or to request this document in an alternate format, call 703-877-2800, TTY 711 Valerie.Tucker@fairfaxcounty.gov Amy.Linderman@fairfaxcounty.gov www.fairfaxcounty.gov/dpwes 28 28 For More Information