An Efficient Elliptic Curve Cryptography Arithmetic Using Nikhilam Multiplica...theijes
The International Journal of Engineering & Science is aimed at providing a platform for researchers, engineers, scientists, or educators to publish their original research results, to exchange new ideas, to disseminate information in innovative designs, engineering experiences and technological skills. It is also the Journal's objective to promote engineering and technology education. All papers submitted to the Journal will be blind peer-reviewed. Only original articles will be published.
The papers for publication in The International Journal of Engineering& Science are selected through rigorous peer reviews to ensure originality, timeliness, relevance, and readability.
Ijcatr03051008Implementation of Matrix based Mapping Method Using Elliptic Cu...Editor IJCATR
Elliptic Curve Cryptography (ECC) gained a lot of attention in industry. The key attraction of ECC over RSA is that it
offers equal security even for smaller bit size, thus reducing the processing complexity. ECC Encryption and Decryption methods can
only perform encrypt and decrypt operations on the curve but not on the message. This paper presents a fast mapping method based on
matrix approach for ECC, which offers high security for the encrypted message. First, the alphabetic message is mapped on to the
points on an elliptic curve. Later encode those points using Elgamal encryption method with the use of a non-singular matrix. And the
encoded message can be decrypted by Elgamal decryption technique and to get back the original message, the matrix obtained from
decoding is multiplied with the inverse of non-singular matrix. The coding is done using Verilog. The design is simulated and
synthesized using FPGA.
I am Watson A. I am a Statistics Assignment Expert at statisticsassignmenthelp.com. I hold a Masters in Statistics from, Liberty University, USA
I have been helping students with their homework for the past 6 years. I solve assignments related to Statistics.
Visit statisticsassignmenthelp.com or email info@statisticsassignmenthelp.com.
You can also call on +1 678 648 4277 for any assistance with Statistics Assignments.
Cryptography is the combination of Mathematics and Computer science. Cryptography is used for encryption and decryption of data using mathematics. Cryptography transit the information in an illegible manner such that only intended recipient will be able to decrypt the information
This is the second lecture in the CS 6212 class. Covers asymptotic notation and data structures. Also outlines the coming lectures wherein we will study the various algorithm design techniques.
The following slides explains about elliptic curves, their interpretation over Gallois finite fields, algorithms that reduces arithmetic computational requirements and primarly applications of the ECC.
International Journal of Engineering Research and Development (IJERD)IJERD Editor
journal publishing, how to publish research paper, Call For research paper, international journal, publishing a paper, IJERD, journal of science and technology, how to get a research paper published, publishing a paper, publishing of journal, publishing of research paper, reserach and review articles, IJERD Journal, How to publish your research paper, publish research paper, open access engineering journal, Engineering journal, Mathemetics journal, Physics journal, Chemistry journal, Computer Engineering, Computer Science journal, how to submit your paper, peer reviw journal, indexed journal, reserach and review articles, engineering journal, www.ijerd.com, research journals,
yahoo journals, bing journals, International Journal of Engineering Research and Development, google journals, hard copy of journal
This Presentation Elliptical Curve Cryptography give a brief explain about this topic, it will use to enrich your knowledge on this topic. Use this ppt for your reference purpose and if you have any queries you'll ask questions.
JNU MA Economics Entrance Test Paper (2013)CrackDSE
This is the entrance exam paper for JNU MA Economics Entrance Exam for the year 2013. Much more information on the JNU MA Economics Entrance Exam and JNU MA Economics Entrance preparation help available on http://crackdse.com
Enhancing Partition Crossover with Articulation Points Analysisjfrchicanog
This is the presentation of the paper entitled "Enhancing Partition Crossover with Articulation Points Analysis" at the ECOM track in gECCO 2018 (Kyoto). This paper was awarded with a "Best Paper Award"
Encryption Quality Analysis and Security Evaluation of CAST-128 Algorithm and...IJNSA Journal
This paper demonstrates analysis of well known block cipher CAST-128 and its modified version using avalanche criterion and other tests namely encryption quality, correlation coefficient, histogram analysis and key sensitivity
tests.
Enumeration methods are very important in a variety of settings, both mathematical and applications. For many problems there is actually no real hope to do the enumeration in reasonable time since the number of solutions is so big. This talk is about how to compute at the limit.
The talk is decomposed into:
(a) Regular enumeration procedure where one uses computerized case distinction.
(b) Use of symmetry groups for isomorphism checks.
(c) The augmentation scheme that allows to enumerate object up to isomorphism without keeping the full list in memory.
(d) The homomorphism principle that allows to map a complex problem to a simpler one.
I am Simon M. I am an Environmental Engineering Assignment Expert at matlabassignmentexperts.com. I hold a Ph.D. in Environmental Engineering, Glasgow University, UK. I have been helping students with their assignments for the past 8 years. I solve assignments related to Environmental Engineering.
Visit matlabassignmentexperts.com or email info@matlabassignmentexperts.com. You can also call on +1 678 648 4277 for any assistance with Environmental Engineering Assignments.
Finding and sustaining Alpha is the wet dream of some mutual fund managers. If their investment approach would result in a sustainable alpha then it would mean that they generate money for their clients despite the fact that the stock market goes up and down.
Exploring Support Vector Regression - Signals and Systems ProjectSurya Chandra
Our team competed in a Kaggle competition to predict the bike share use as a part of their capital bike share program in Washington DC using a powerful function approximation technique called support vector regression.
Financial Time Series Analysis Based On Normalized Mutual Information FunctionsIJCI JOURNAL
A method of predictability analysis of future values of financial time series is described. The method is based on normalized mutual information functions. In the analysis, the use of these functions allowed to refuse any restrictions on the distributions of the parameters and on the correlations between parameters. A comparative analysis of the predictability of financial time series of Tel Aviv 25 stock exchange has been carried out.
COVARIANCE ESTIMATION AND RELATED PROBLEMS IN PORTFOLIO OPTIMICruzIbarra161
COVARIANCE ESTIMATION AND RELATED PROBLEMS IN PORTFOLIO OPTIMIZATION
Ilya Pollak
Purdue University
School of Electrical and Computer Engineering
West Lafayette, IN 47907
USA
ABSTRACT
This overview paper reviews covariance estimation problems and re-
lated issues arising in the context of portfolio optimization. Given
several assets, a portfolio optimizer seeks to allocate a fixed amount
of capital among these assets so as to optimize some cost function.
For example, the classical Markowitz portfolio optimization frame-
work defines portfolio risk as the variance of the portfolio return,
and seeks an allocation which minimizes the risk subject to a target
expected return. If the mean return vector and the return covariance
matrix for the underlying assets are known, the Markowitz problem
has a closed-form solution.
In practice, however, the expected returns and the covariance
matrix of the returns are unknown and are therefore estimated from
historical data. This introduces several problems which render the
Markowitz theory impracticable in real portfolio management appli-
cations. This paper discusses these problems and reviews some of
the existing literature on methods for addressing them.
Index Terms— Covariance, estimation, portfolio, market, fi-
nance, Markowitz
1. INTRODUCTION
The return of a security between trading day t1 and trading day t2
is defined as the change in the closing price over this time period,
divided by the closing price on day t1. For example, the daily (i.e.,
one-day) return on trading day t is defined as (p(t)−p(t−1))/p(t−
1) where p(t) is the closing price on day t and p(t−1) is the closing
price on the previous trading day. Note that if t is a Monday or the
day after a holiday, the previous trading day will not be the same as
the previous calendar day.
Suppose an investment is made into N assets whose return vec-
tor is R, modeled as a random vector with expected return µ =
E[R] and covariance matrix Λ = E[(R − µ)(R − µ)T ]. In other
words, R = (R(1), . . . , R(N))T where R(n) is the return of the n-th
asset. It is assumed throughout the paper that the covariance matrix
Λ is invertible. This assumption is realistic, since it is quite unusual
in practice to have a set of assets whose linear combination has re-
turns exactly equal to zero. Even if an investment universe contained
such a set, the number of assets in the universe could be reduced to
eliminate the linear dependence and make the covariance matrix in-
vertible.
Out of these N assets, a portfolio is formed with allocation
weights w = (w(1), . . . , w(N))T . The n-th weight is defined as the
amount invested into the n-th asset, as a fraction of the overall invest-
ment into the portfolio: if the overall investment into the portfolio is
$D, and $D(n) is invested into the n-th asset, then w(n) = D(n)/D.
Therefore, by definition, the weights sum to one:
w
T
1 = 1, (1)
where 1 is an N -vector of ones. Note that some of the weights may
be negative, ...
Similar to Stock price prediction regression nn (20)
Opendatabay - Open Data Marketplace.pptxOpendatabay
Opendatabay.com unlocks the power of data for everyone. Open Data Marketplace fosters a collaborative hub for data enthusiasts to explore, share, and contribute to a vast collection of datasets.
First ever open hub for data enthusiasts to collaborate and innovate. A platform to explore, share, and contribute to a vast collection of datasets. Through robust quality control and innovative technologies like blockchain verification, opendatabay ensures the authenticity and reliability of datasets, empowering users to make data-driven decisions with confidence. Leverage cutting-edge AI technologies to enhance the data exploration, analysis, and discovery experience.
From intelligent search and recommendations to automated data productisation and quotation, Opendatabay AI-driven features streamline the data workflow. Finding the data you need shouldn't be a complex. Opendatabay simplifies the data acquisition process with an intuitive interface and robust search tools. Effortlessly explore, discover, and access the data you need, allowing you to focus on extracting valuable insights. Opendatabay breaks new ground with a dedicated, AI-generated, synthetic datasets.
Leverage these privacy-preserving datasets for training and testing AI models without compromising sensitive information. Opendatabay prioritizes transparency by providing detailed metadata, provenance information, and usage guidelines for each dataset, ensuring users have a comprehensive understanding of the data they're working with. By leveraging a powerful combination of distributed ledger technology and rigorous third-party audits Opendatabay ensures the authenticity and reliability of every dataset. Security is at the core of Opendatabay. Marketplace implements stringent security measures, including encryption, access controls, and regular vulnerability assessments, to safeguard your data and protect your privacy.
Explore our comprehensive data analysis project presentation on predicting product ad campaign performance. Learn how data-driven insights can optimize your marketing strategies and enhance campaign effectiveness. Perfect for professionals and students looking to understand the power of data analysis in advertising. for more details visit: https://bostoninstituteofanalytics.org/data-science-and-artificial-intelligence/
As Europe's leading economic powerhouse and the fourth-largest hashtag#economy globally, Germany stands at the forefront of innovation and industrial might. Renowned for its precision engineering and high-tech sectors, Germany's economic structure is heavily supported by a robust service industry, accounting for approximately 68% of its GDP. This economic clout and strategic geopolitical stance position Germany as a focal point in the global cyber threat landscape.
In the face of escalating global tensions, particularly those emanating from geopolitical disputes with nations like hashtag#Russia and hashtag#China, hashtag#Germany has witnessed a significant uptick in targeted cyber operations. Our analysis indicates a marked increase in hashtag#cyberattack sophistication aimed at critical infrastructure and key industrial sectors. These attacks range from ransomware campaigns to hashtag#AdvancedPersistentThreats (hashtag#APTs), threatening national security and business integrity.
🔑 Key findings include:
🔍 Increased frequency and complexity of cyber threats.
🔍 Escalation of state-sponsored and criminally motivated cyber operations.
🔍 Active dark web exchanges of malicious tools and tactics.
Our comprehensive report delves into these challenges, using a blend of open-source and proprietary data collection techniques. By monitoring activity on critical networks and analyzing attack patterns, our team provides a detailed overview of the threats facing German entities.
This report aims to equip stakeholders across public and private sectors with the knowledge to enhance their defensive strategies, reduce exposure to cyber risks, and reinforce Germany's resilience against cyber threats.
Levelwise PageRank with Loop-Based Dead End Handling Strategy : SHORT REPORT ...Subhajit Sahu
Abstract — Levelwise PageRank is an alternative method of PageRank computation which decomposes the input graph into a directed acyclic block-graph of strongly connected components, and processes them in topological order, one level at a time. This enables calculation for ranks in a distributed fashion without per-iteration communication, unlike the standard method where all vertices are processed in each iteration. It however comes with a precondition of the absence of dead ends in the input graph. Here, the native non-distributed performance of Levelwise PageRank was compared against Monolithic PageRank on a CPU as well as a GPU. To ensure a fair comparison, Monolithic PageRank was also performed on a graph where vertices were split by components. Results indicate that Levelwise PageRank is about as fast as Monolithic PageRank on the CPU, but quite a bit slower on the GPU. Slowdown on the GPU is likely caused by a large submission of small workloads, and expected to be non-issue when the computation is performed on massive graphs.
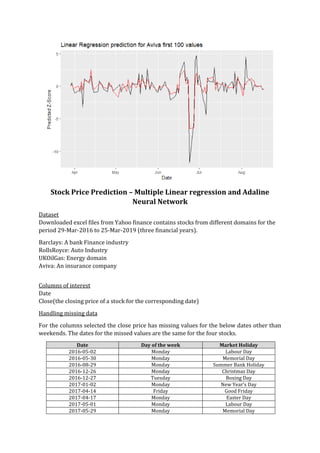
1. Stock Price Prediction – Multiple Linear regression and Adaline
Neural Network
Dataset
Downloaded excel files from Yahoo finance contains stocks from different domains for the
period 29-Mar-2016 to 25-Mar-2019 (three financial years).
Barclays: A bank Finance industry
RollsRoyce: Auto Industry
UKOilGas: Energy domain
Aviva: An insurance company
Columns of interest
Date
Close(the closing price of a stock for the corresponding date)
Handling missing data
For the columns selected the close price has missing values for the below dates other than
weekends. The dates for the missed values are the same for the four stocks.
Date Day of the week Market Holiday
2016-05-02 Monday Labour Day
2016-05-30 Monday Memorial Day
2016-08-29 Monday Summer Bank Holiday
2016-12-26 Monday Christmas Day
2016-12-27 Tuesday Boxing Day
2017-01-02 Monday New Year’s Day
2017-04-14 Friday Good Friday
2017-04-17 Monday Easter Day
2017-05-01 Monday Labour Day
2017-05-29 Monday Memorial Day
2. 2017-08-28 Monday Summer Bank Holiday
2017-12-25 Monday Christmas Day
2017-12-26 Tuesday Boxing Day
2018-01-01 Monday New Year’s Day
2018-03-30 Friday Good Friday
2018-04-02 Monday Labour Day
2018-05-07 Monday Early May Bank Holiday
2018-05-28 Monday Memorial Day
2018-08-27 Monday Summer Bank Holiday
2018-12-25 Tuesday Christmas Day
2018-12-26 Wednesday Boxing Day
2019-01-01 Tuesday New Year’s Day
Table 1
From the table above Table 1, we observe 22 missing days for the period 29-Mar-2016 to 25-
Mar-2019 (three financial years).
These missing dates correspond to the market holidays. When a holiday falls on a weekend,
market closures are decided by two rules:
• If the holiday falls on a Saturday, the market will close on the preceding Friday.
• If the holiday falls on a Sunday, the market will close on the subsequent Monday[1].
For the period I have downloaded the data the missing data corresponds with the bank
holidays. However, there could be other missing days when Yahoo Finance or Google finance
does not hold data on a particular day due to technical reasons (which is very rare).
Fig 1
From Fig 1 above we observe that the four stocks have missing closed price value on the
same date.
Approaches for handling missing data
Aviva
RollsRoyce
Barclays
UKOilGas
3. If one value is missing at the time ‘t’ and no values are missing at ‘t-1’ and ‘t+1’
one can calculate the geometric mean of the prices at ‘t-1’ and ‘t+1’ as
Pt = sqrt(Pt-1 * Pt+1)
where Pt-1 is the close price on the previous day of the missing value day
Pt+1 is the close price on the next day of the missing value day
If two values are missing at the time ‘t’ and ‘t+1’ and no values are missing at ‘t-1’ and ‘t+2’
then
Pt = cube root ((Pt-1)2 * Pt+1)
Pt+1 = cube root (Pt-1 * (Pt+2)2)
The third approach would be to fill the missing value with the previous day's closed value or
the next day's closed value.
Filling missing data with closest existing past value
I used the last observed carry forward function locf() in R to insert the last observed value
into the missing field. Below are the four plots with the missing values inserted. The dots in
the line graph resemble the locf values inserted.
Log returns of a time series
The log-returns of a time series is given as:
yi = ln(xi/xi-1)
where yi is the log returned signal
ln is the natural logarithm
xi is the current close price at time t
xi-1 is the close price at time t-1
Computing log-returns of a time series gives us the relative change in the current closed price
value of a stock compared to its value the previous day. Stock prices are based on returns and
returns are based on percentages therefore we use log returns for the computation.
Below are the log-return plots for the four stocks. From these plots, we observe that the log-return
value fluctuates between positive and negative values indicating a relatively positive change and
negative change of the close price at time t as compared to time t-1.
Normalization to z-score
To obtain the z-score of the log-returned signal we transform the data to have a mean of zero and
standard deviation 1. The data points can be standardized to find the z-score with the below
formula
[2]
4. where, xi is a data point (x1, x2…xn)
x̄ is the sample mean.
S is the sample standard deviation.
Fig 10
Fig 11
6. Mean and Variance
Stock Name Mean of actual time
series
Mean of the log
returned signal
Mean of the z-score
signal
Aviva 475.1562 0.00014 1.484896e-18
RollsRoyce 829.7833 0.00037 1.552783e-18
Barclays 189.3234 3.908054e-05 -7.134141e-18
UKOilGas 2.3209 0.00052 1.293812e-17
Table 2
Stock Name Variance of actual
time series
Variance of the log
returned signal
Variance of the z-
score signal
Aviva 47.55886 0.01451 1
RollsRoyce 105.8442 0.01793 1
Barclays 24.11111 0.01878 1
UKOilGas 1.697596 0.06038 1
Table 3
Table 2 above, contains the mean of the actual time series, log-returned series and the z-score
series. We observe that the mean is almost/close to zero for the z-score signal.
Table 3 above, contains the variance of the actual time series, log-returned series and the z-
score series. We observe that the variance is one for the z-score signal.
Linear Regression Prediction
I have used Multiple linear regression to create the predictor module for the four stocks. The stock
to be predicted at time ‘t+1’ forms the dependent variable. The stock to be predicted at time t and
the other 3 stocks at time t are the independent variables which the dependent variable (The stock
to be predicted at time ‘t+1’) depends on.
The basic multiple linear regression model is as follows:
^Y = bo + b1x1 + b2x2 + b3x3 + b4x4
where, yn is the value to be predicted – in our case it is g(t+1)
bo is the intercept
b1, b2, b3, b4 are the coefficients of the slopes of the three independent variables – in
our case it is the predicted signal itself at time ‘t’ and the other 3 stocks at
time t.
Below are the plots for the 4 different stocks predicted using the linear model lm() function in R.
A closer look into the first 100 points of the plot is provided.
8. Table 4
From table 4 we observe that the independent variables Barclays and RollsRoyce are most
significant for the prediction of Aviva stocks. This means that Barclays and RollsRoyce share a
significant linear relationship with Aviva. This is mainly due to the domain that they belong as
Aviva and Barclays belong to the financial domain and will suffer the same impacts due to market
dynamics. The UKOilGas is very less significant. The Residual standard error is the quality of the
fit. The Residual standard error for this model is 0.7472.
Fig 16
9. Fig 17
Coefficients Estimate Std. Error t value Pr(>|t|)
Intercept -5.017e-17 2.748e-02 0.000 1.000
UKOilGas 4.384e-02 2.758e-02 1.590 0.112
Aviva 6.509e-01 2.824e-02 23.045 <2e-16 ***
RollsRoyce 1.194e-04 2.817e-02 0.004 0.997
Table 5
From table 5 we observe that the independent variables Aviva is the most significant for the
prediction of Barclays stocks. This means that Aviva shares a significant linear relationship with
Barclays. The Residual standard error is the quality of the fit. The Residual standard error for this
model is 0.7565.
Fig 18
10. Fig 19
Coefficients Estimate Std. Error t value Pr(>|t|)
Intercept -1.602e-17 3.552e-02 0.000 1.000
UKOilGas 8.339e-03 3.571e-02 0.234 0.815
Aviva 2.166e-01 4.701e-02 4.609 4.76e-06 ***
Barclays 1.996e-04 4.708e-02 0.004 0.997
Table 6
From table 6 we observe that the independent variables Aviva is the most significant for the
prediction of RollsRoyce stocks. This means that Aviva shares a significant linear relationship
with Rolls-Royce. The Residual standard error is the quality of the fit. The Residual standard error
for this model is 0.978.
12. From table 7 we observe that none of the independent variables share a significant linear
relationship with UKOilGas stocks and therefore from fig 21 we observe that the prediction is
very bad. This is mainly due to the domain that the stocks belong to. The Residual standard error
is the quality of the fit. The Residual standard error for this model is 0.9974.
From the data above we observe that the error in prediction is higher for UKOilGas as there is no
linear relationship with any of the other stocks. This error is the least for prediction of Aviva
stocks as it shares significant linear relationships with 2 other stocks.
If we use independent variables from the same domain for prediction of stocks it will result in
higher accuracy and reduced residual standard error.
Plots for g(t), g(t+1) and residuals
Fig 22
Fig 23
16. Adaline Neural Network Prediction
A neural network consists of input layer, hidden layer and the output layer. In the fig 22 we
observe a neural network.
In this neural network we are feeding the signals
g(t) in our case it is the signal to be predicted at time t
𝑑1(𝑡),𝑑2(𝑡),𝑑3(𝑡) in our case are the 3 other stocks at time t
and the output signal after the error has been calculated.
The Adaline neural network has nodes that accept the input vector ‘x’ and the weight vector ‘w’
and computes the output as follows:
Where, y is the output of the model. This output is compared with the g(t+1) the actual
predicted value. The subtraction gives us the error ‘e’. This error is then
feedback to the input by readjusting the weight as
w(new) = w + learning_rate* (e)*x ------ (1)
teta is the bias of the network (which behaves as a threshold).
n is the total number of inputs.
The neural network first has to be trained. During the training at the end of every iteration the
error is computed and feedback to the input. The network converges or stops training when the
error reduces to zero.
I have divided the data into training and testing. For training I have used 70% of the data(542
samples). For testing I have used 30% of the remaining data (216 samples).
23. Stock Name Root Mean Square Error (RMSE)
Aviva 0.3214
Barclays 0.4559
RollsRoyce 0.5580
UKOilGas 0.5998
Table 8
From Table 8 above we observe that the root mean square errors for the neural network
prediction is the highest for UKOilGas and the least for Aviva. In the previous solution we have
seen that there is no clear relationship observed between the other stocks and UKOilGas which is
the reason for bad predictions in this stock.
Learning rate
Learning rate in a neural network controls how fast or slowly a neural network learns or trains
itself[3]. In an Adaline neural network, if the error (difference between the target output and the
predicted output) is not zero, the weights are updated with the formula:
w(next iteration) = w(current iteration) + learning_rate* (e)*x(current iteration) ------ (1)
The range of this learning_rate parameter ranges between 0.0 and 1.0. Instead of updating the
weight with the full amount, it is scaled by this learning rate as can be seen from the equation
above. For e.g. if the learning_rate = 0.1 it means that in the next iteration the weight is updated
by 10% of the estimated weight error[3].
A larger learning rate of approximately 0.9 will train the model faster with sub-optimal
performance. A smaller learning rate <0.5 will train the model slowly. It can give an optimal
solution however, the training may never converge and can get stuck on a sub-optimal solution.
Stock Names Number of Steps for
Learning Rate = 0.2
Number of Steps for
Learning Rate = 0.5
Number of Steps for
Learning Rate = 0.8
Aviva 4.9532 x 10^08 5.3916 x 10^06 6.391600e+04
Barclays 4.3728 x 10^07 6.8560 x 10^05 6.468000e+03
RollsRoyce 2.5134 x 10^08 2.4545 x 10^06 3.613600e+04
UKOilGas 1.0185 x 10^07 1.7596 x 10^05 2.023000e+03
Table 9
From table 9 we observe that as the learning rate increases the number of steps taken for the
network to get trained reduces.
Below are the plots for the Square Errors as a function of Time for the 4 time series.
![2017-08-28 Monday Summer Bank Holiday
2017-12-25 Monday Christmas Day
2017-12-26 Tuesday Boxing Day
2018-01-01 Monday New Year’s Day
2018-03-30 Friday Good Friday
2018-04-02 Monday Labour Day
2018-05-07 Monday Early May Bank Holiday
2018-05-28 Monday Memorial Day
2018-08-27 Monday Summer Bank Holiday
2018-12-25 Tuesday Christmas Day
2018-12-26 Wednesday Boxing Day
2019-01-01 Tuesday New Year’s Day
Table 1
From the table above Table 1, we observe 22 missing days for the period 29-Mar-2016 to 25-
Mar-2019 (three financial years).
These missing dates correspond to the market holidays. When a holiday falls on a weekend,
market closures are decided by two rules:
• If the holiday falls on a Saturday, the market will close on the preceding Friday.
• If the holiday falls on a Sunday, the market will close on the subsequent Monday[1].
For the period I have downloaded the data the missing data corresponds with the bank
holidays. However, there could be other missing days when Yahoo Finance or Google finance
does not hold data on a particular day due to technical reasons (which is very rare).
Fig 1
From Fig 1 above we observe that the four stocks have missing closed price value on the
same date.
Approaches for handling missing data
Aviva
RollsRoyce
Barclays
UKOilGas](data:image/gif;base64,R0lGODlhAQABAIAAAAAAAP///yH5BAEAAAAALAAAAAABAAEAAAIBRAA7)