Download to read offline


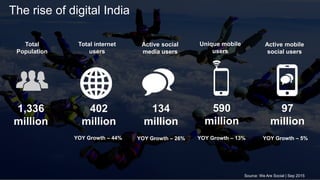
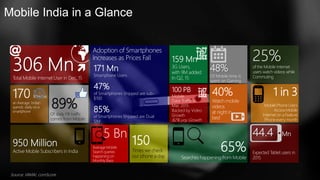
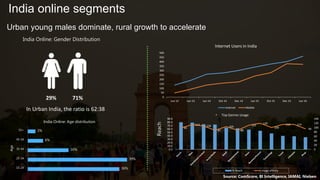
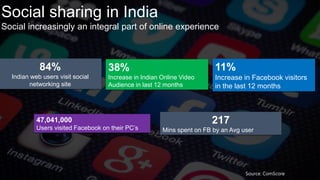
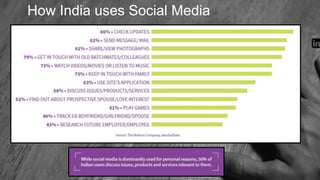


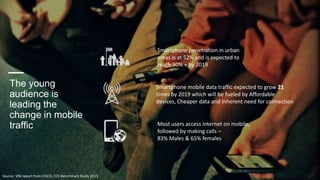
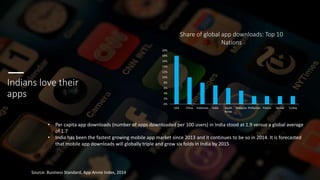
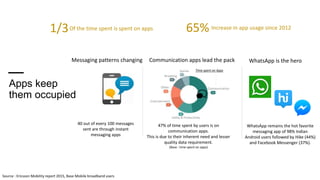
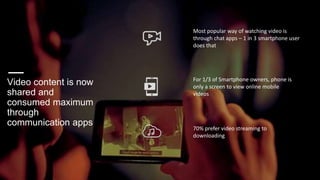
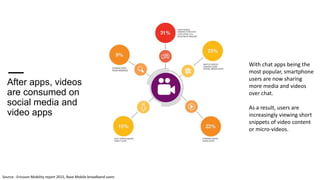
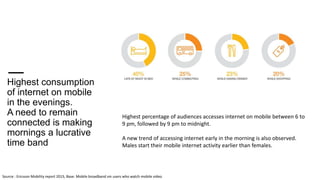


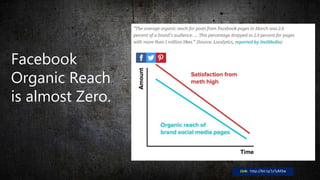
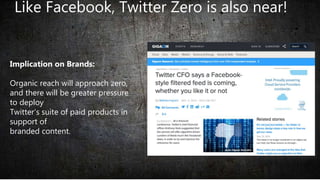

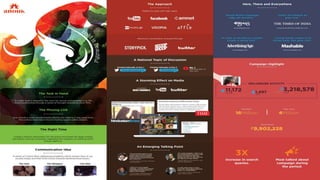
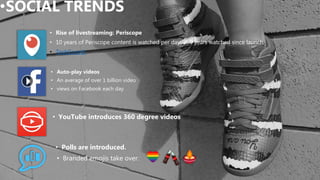

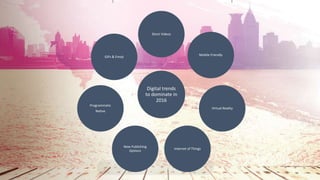
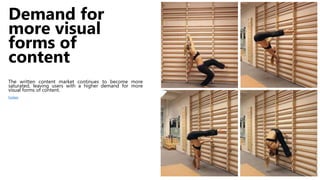


The document summarizes key trends in digital India and social media usage. It notes that India now has over 400 million internet users and over 130 million active social media users. Mobile internet usage is growing rapidly, with over 80% of Facebook traffic coming from mobile. WhatsApp is the dominant messaging platform. Video consumption is increasing significantly, especially through social media apps like WhatsApp. The highest mobile internet usage is in the evenings. It provides case studies and highlights that organic social media reach for brands is now almost zero, so paid promotion is important. Emerging trends include live streaming, auto-play videos, virtual reality and the growth of native advertising.


