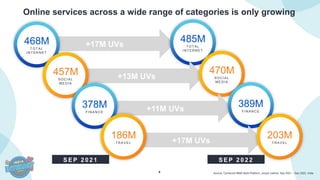
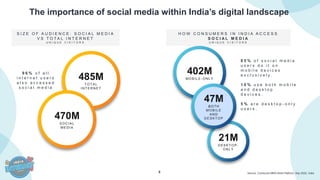
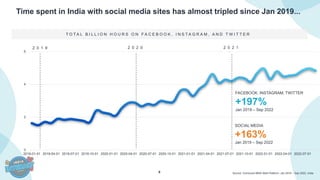
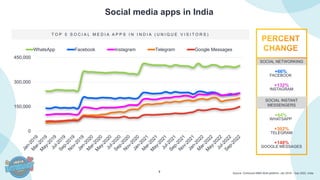
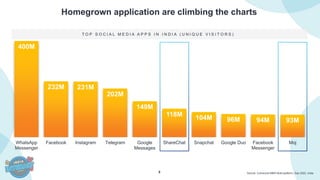
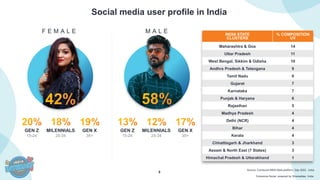
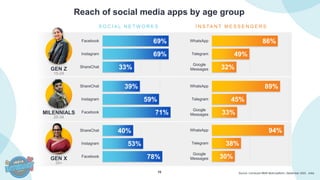
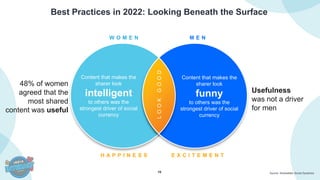
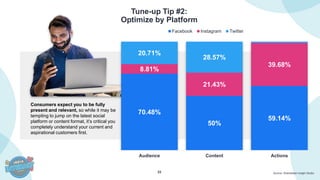
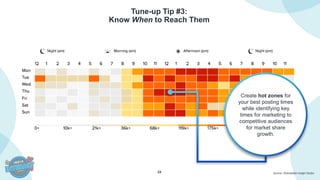
1
2
Agenda
An Overview
A Social
Purpose
Best
Practices for
Winning
Social 2022
3
Source: Comscore MMX and VMX Multi-Platform, Jan – Sep 2022, India.
* Total online video hours are measured for the period Jan to Aug 2022 and then multiplied by 9/8.
R E TAI L
E N T E R -
TAI N M E N T
S O C I AL
N E W S
67B
Hours Year-
to-Date
10B
Hours Year-to-Date
11B
Hours Year-to-Date
91B
Hours
Year-to-Date
O T H E R
Finance: 8B
Travel: 1B
Hours Year-
to-Date
TOTAL INTERNET
303B
Hours Year-to-Date
ONLINE VIDEO
127B
Hours Year-to-Date
4 Source: Comscore MMX Multi-Platform, unique visitors, Sep 2021 – Sep 2022, India.
468M
T OT AL
INT ERNET
S E P 2 0 2 1
+17M UVs
485M
T OT AL
INT ERNET
457M
SOCIAL
MEDIA
+13M UVs
470M
SO CIAL
MEDIA
378M
FINANCE
+11M UVs
389M
FINANCE
186M
T RAVEL +17M UVs
203M
T RAVEL
Online services across a wide range of categories is only growing
S E P 2 0 2 2
5
The importance of social media within India’s digital landscape
Source: Comscore MMX Multi-Platform, Sep 2022, India
S I Z E O F A U D I E N C E : S O C I A L M E D I A
V S T O T A L I N T E R N E T
U N I Q U E V I S I T O R S
H O W C O N S U M E R S I N I N D I A A C C E S S
S O C I A L M E D I A
U N I Q U E V I S I T O R S
485M
T OT AL
INT ERNET
470M
SOCIAL
MEDIA
21M
DESKT OP -
ONLY
402M
MO BILE-ONL Y
9 6 % o f a l l
i n t e r n e t u s e r s
a l s o a c c e s s e d
s o c i a l m e d i a
47M
BOTH
MOBILE
AND
DESKT OP
8 5 % o f s o c i a l m e d i a
u s e r s d o i t o n
m o b i l e d e v i c e s
e x c l u s i v e l y .
1 0 % u s e b o t h m o b i l e
a n d d e s k t o p
d e v i c e s .
5 % a r e d e s k t o p - o n l y
u s e r s .
6
Time spent in India with social media sites has almost tripled since Jan 2019...
Source: Comscore MMX Multi-Platform, Jan 2019 – Sep 2022, India.
T O T A L B I L L I O N H O U R S O N F A C E B O O K , I N S T A G R A M , A N D T W I T T E R
0
2
4
6
2019-01-01 2019-04-01 2019-07-01 2019-10-01 2020-01-01 2020-04-01 2020-07-01 2020-10-01 2021-01-01 2021-04-01 2021-07-01 2021-10-01 2022-01-01 2022-04-01 2022-07-01
2 0 1 9 2 0 2 0 2 0 2 1
FACEBOOK, INSTAGRAM, TWITTER
+197%
Jan 2019 – Sep 2022
SOCIAL MEDIA
+163%
Jan 2019 – Sep 2022
7
SOCIAL NETWORKING
T O P 5 S O C I A L M E D I A A P P S I N I N D I A ( U N I Q U E V I S I T O R S )
Social media apps in India
Source: Comscore MMX Multi-platform, Jan 2019 – Sep 2022, India.
SOCIAL INSTANT
MESSENGERS
+66%
FACEBOOK
+132%
INSTAGRAM
+64%
WHATSAPP
+302%
TELEGRAM
+148%
GOOGLE MESSAGES
0
150,000
300,000
450,000
WhatsApp Facebook Instagram Telegram Google Messages
8
400M
232M 231M
202M
149M
118M
104M 96M 94M 93M
WhatsApp
Messenger
Facebook Instagram Telegram Google
Messages
ShareChat Snapchat Google Duo Facebook
Messenger
Moj
Homegrown application are climbing the charts
Source: Comscore MMX Multi-platform, Sep 2022, India.
T O P S O C I A L M E D I A A P P S I N I N D I A ( U N I Q U E V I S I T O R S )
9
Source: Comscore MMX Multi-platform, Sep 2022 , India
Comscore Social powered by Shareablee, India.
Social media user profile in India
MILENNIALS
25-34
GEN Z
15-24
GEN X
35+
MILENNIALS
25-34
GEN Z
15-24
GEN X
35+
INDIA STATE
CLUSTERS
% COMPOSITION
UV
Maharashtra & Goa 14
Uttar Pradesh 11
West Bengal, Sikkim & Odisha 10
Andhra Pradesh & Telangana 9
Tamil Nadu 8
Gujarat 7
Karnataka 7
Punjab & Haryana 6
Rajasthan 5
Madhya Pradesh 4
Delhi (NCR) 4
Bihar 4
Kerala 4
Chhattisgarh & Jharkhand 3
Assam & North East (7 States) 3
Himachal Pradesh & Uttarakhand 1
F E M A L E M A L E
10 Source: Comscore MMX Multi-platform, September 2022 , India
Reach of social media apps by age group
MILENNIALS
25-34
GEN Z
15-24
GEN X
35+
S O C I A L N E T W O R K S I N S TA N T M E S S E N G E R S
69%
69%
33%
Facebook
Instagram
ShareChat
71%
59%
39%
Facebook
Instagram
ShareChat
78%
53%
40%
Facebook
Instagram
ShareChat
86%
49%
32%
WhatsApp
Telegram
Google
Messages
89%
45%
33%
WhatsApp
Telegram
Google
Messages
94%
38%
30%
WhatsApp
Telegram
Google
Messages
11 Shareablee Syndicated Platform | January 1, 2022 – November 18, 2022
The Big Picture: Cross-platform Actions
MEDIA &
ENTERTAINMENT
PUBLISHING
SPORTS &
RECREATION
GOVERNMENT
CONSUMER
GOODS
AUTOMOTIVE
RETAIL TRAVEL
12 Source: Comscore Shareablee, YTD 2022, Partnership Explorer, IN Sponsors
Brands & Influencers are linked!
Influencers and Sports Teams are critical to driving engagement in sponsored content for brands in India.
T O P B R A N D E D C O N T E N T
S P O N S O R E D C A T E G O R I E S
468,783
489,091
779,784
783,633
895,257
1,045,522
1,698,741
2,025,795
3,289,142
25,620,470
Influencers - Artists
Influencers - Entertainers
Influencers - Actors and Directors
IN - Sports
Influencers - Music
Influencers - Video Creators
UAE Sports
IN - Professional Sports - IPLT20
Influencers - TV and Film
Influencers - Athletes
T O P B R A N D E D C O N T E N T S P O N S O R S
536,511
613,664
704,395
791,683
1,009,786
1,020,761
1,354,579
2,047,652
5,972,939
13,565,628
Wrogn
ragecoffee_
samsungindia
jeetwinofficial
amtouristerin
one8select
themancompany
herbalifeindiaofficial
pumaindia
staywrogn
Influencers and
Sports teams are
critical in driving
brand awareness &
equity for brand
sponsors, with
Athletes & teams
driving a vast majority
of the engagement in
sponsored content.
Key household
brands are
prominent sponsors
of branded content.
Wrogn’s sponsored
posts alone drove
almost 1/3 of the total
engagements.
13
So why are people
on social and how
can we reach them?
14
R E A C H
Among all formats, video continues to grow in adoption
Source: Shareablee Social Dynamics 2022
90% 74% 54%
Of people on social consume
content at least 1x/week
Are Very / Somewhat Likely to check
out a brand’s social media page
when looking for a new product​
Are more likely to try out
products recommended by an
influencer on social media​
A C T I O N S C O N V E R S I O N
15
And we’re finding ways to connect even more fully
with our friends, family, our passions
Source: Shareablee Social Dynamics
W H A T I S D R I V I N G Y O U R T I M E S P E N T O N S O C I A L M E D I A ?
2%
23%
44%
45%
48%
50%
54%
Other
How I express what is important to me
Helps me Pass the time
Entertainment therapy
My primary way of staying up to date
Helps me feel connected to friends and family
Helps me feel connected to the outside world/what's happening
16
Best Practices in 2022: Looking Beneath the Surface
Source: Shareablee Social Dynamics
H A P P I N E S S E X C I T E M E N T
W O M E N M E N
Content that makes the
sharer look
funny
to others was the
strongest driver of social
currency
Content that makes the
sharer look
intelligent
to others was the
strongest driver of social
currency
48% of women
agreed that the
most shared
content was useful
Usefulness
was not a driver
for men
L
O
O
K
G
O
O
D
17
50.4
42.0
20.1
15.8
12.0 11.6
Neeraj
Chopra
Ammy Virk P. V.
Sindhu
Palak
Muchhal
Emiway
Bantai
Saikhom
Mirabai
Chanu
Top Influencers in India
Source: Shareablee Power Rankings
A C T I O N S ( M I L L I O N )
YTD, the top mega influencers drive over 10M engagements each,
showcasing their power to drive share of voice and resonance with the
audience on social.
18
Now what?
19
Know your Audience
~67,000 organic mentions
A C T I O N S ( M I L L I O N )
The Indian Cricket Team social audience is over 22% more likely to engage with brands in the Science
Snobs group than the average social engager based on their social engagement behavior with other
pages and categories
S C I E N C E
S N O B S
C I V I C A L LY -
M I N D E D
J O B
S E E K E R S
20
The Great Consumer Shift:
Discover Trending Topics
Source: Shareablee, Trend Topics, 10.11-11.8.2022, FB, IG, TW engagement-based
IG Reels dominates in driving engagement for FIFA,
with a surge at the end of October.
21
Best Practices in 2022: Stop the Social Scroll
Shareablee Social Dynamics
What are the elements of a social post that tend to make you stop and want to learn more?
47% 28% 32%
49%
C A T C H Y O R A T T E N T I O N -
G R A B B I N G H E A D L I N E
S O M E T H I N G I N T E R E S T I N G
I N T H E F I R S T F E W
S E C O N D S O F A V I D E O
S E E I N G O T H E R P E O P L E
H A V E W A T C H E D /
E N G A G E D W I T H I T
T H E C O N T E N T C O M E S
F R O M A S O U R C E T H A T
I T R U S T / C A R E A B O U T
A “fast start” to the video is more likely to make a Millennial stop
and want to learn more compared to any other age group. Overall, all
age groups will stop and engage with content that catches their eye –
whether it is through a headline or an impactful first frame
22
Short form video is
preferred over long
form (~2X), with the
youngest age groups
18-34 showing the
highest affinity (54%).
Tune-up Tip #1:
The Favored Format
Source: Shareablee Social Dynamics
What kinds of social content do you enjoy consuming the most? (select all that apply) n=2789
8%
11%
27%
36%
41%
50% 51% 51%
Text Only Carousel
Images
Long-Form
Video (>60sec)
Articles Live Video Stories Short-Form
Video (<60sec)
Images
23
Tune-up Tip #2:
Optimize by Platform
Source: Shareablee Insight Studio
Consumers expect you to be fully
present and relevant, so while it may be
tempting to jump on the latest social
platform or content format, it’s critical you
completely understand your current and
aspirational customers first.
70.48%
50%
59.14%
8.81%
21.43%
39.68%
20.71%
28.57%
Audience Content Actions
Facebook Instagram Twitter
24
Tune-up Tip #3:
Know When to Reach Them
Source: Shareablee Insight Studio
Create hot zones for
your best posting times
while identifying key
times for marketing to
competitive audiences
for market share
growth.
25

State-of-Social-Media-in-INDIA .pdf

  • 1.
  • 2.
  • 3.
    3 Source: Comscore MMXand VMX Multi-Platform, Jan – Sep 2022, India. * Total online video hours are measured for the period Jan to Aug 2022 and then multiplied by 9/8. R E TAI L E N T E R - TAI N M E N T S O C I AL N E W S 67B Hours Year- to-Date 10B Hours Year-to-Date 11B Hours Year-to-Date 91B Hours Year-to-Date O T H E R Finance: 8B Travel: 1B Hours Year- to-Date TOTAL INTERNET 303B Hours Year-to-Date ONLINE VIDEO 127B Hours Year-to-Date
  • 4.
    4 Source: ComscoreMMX Multi-Platform, unique visitors, Sep 2021 – Sep 2022, India. 468M T OT AL INT ERNET S E P 2 0 2 1 +17M UVs 485M T OT AL INT ERNET 457M SOCIAL MEDIA +13M UVs 470M SO CIAL MEDIA 378M FINANCE +11M UVs 389M FINANCE 186M T RAVEL +17M UVs 203M T RAVEL Online services across a wide range of categories is only growing S E P 2 0 2 2
  • 5.
    5 The importance ofsocial media within India’s digital landscape Source: Comscore MMX Multi-Platform, Sep 2022, India S I Z E O F A U D I E N C E : S O C I A L M E D I A V S T O T A L I N T E R N E T U N I Q U E V I S I T O R S H O W C O N S U M E R S I N I N D I A A C C E S S S O C I A L M E D I A U N I Q U E V I S I T O R S 485M T OT AL INT ERNET 470M SOCIAL MEDIA 21M DESKT OP - ONLY 402M MO BILE-ONL Y 9 6 % o f a l l i n t e r n e t u s e r s a l s o a c c e s s e d s o c i a l m e d i a 47M BOTH MOBILE AND DESKT OP 8 5 % o f s o c i a l m e d i a u s e r s d o i t o n m o b i l e d e v i c e s e x c l u s i v e l y . 1 0 % u s e b o t h m o b i l e a n d d e s k t o p d e v i c e s . 5 % a r e d e s k t o p - o n l y u s e r s .
  • 6.
    6 Time spent inIndia with social media sites has almost tripled since Jan 2019... Source: Comscore MMX Multi-Platform, Jan 2019 – Sep 2022, India. T O T A L B I L L I O N H O U R S O N F A C E B O O K , I N S T A G R A M , A N D T W I T T E R 0 2 4 6 2019-01-01 2019-04-01 2019-07-01 2019-10-01 2020-01-01 2020-04-01 2020-07-01 2020-10-01 2021-01-01 2021-04-01 2021-07-01 2021-10-01 2022-01-01 2022-04-01 2022-07-01 2 0 1 9 2 0 2 0 2 0 2 1 FACEBOOK, INSTAGRAM, TWITTER +197% Jan 2019 – Sep 2022 SOCIAL MEDIA +163% Jan 2019 – Sep 2022
  • 7.
    7 SOCIAL NETWORKING T OP 5 S O C I A L M E D I A A P P S I N I N D I A ( U N I Q U E V I S I T O R S ) Social media apps in India Source: Comscore MMX Multi-platform, Jan 2019 – Sep 2022, India. SOCIAL INSTANT MESSENGERS +66% FACEBOOK +132% INSTAGRAM +64% WHATSAPP +302% TELEGRAM +148% GOOGLE MESSAGES 0 150,000 300,000 450,000 WhatsApp Facebook Instagram Telegram Google Messages
  • 8.
    8 400M 232M 231M 202M 149M 118M 104M 96M94M 93M WhatsApp Messenger Facebook Instagram Telegram Google Messages ShareChat Snapchat Google Duo Facebook Messenger Moj Homegrown application are climbing the charts Source: Comscore MMX Multi-platform, Sep 2022, India. T O P S O C I A L M E D I A A P P S I N I N D I A ( U N I Q U E V I S I T O R S )
  • 9.
    9 Source: Comscore MMXMulti-platform, Sep 2022 , India Comscore Social powered by Shareablee, India. Social media user profile in India MILENNIALS 25-34 GEN Z 15-24 GEN X 35+ MILENNIALS 25-34 GEN Z 15-24 GEN X 35+ INDIA STATE CLUSTERS % COMPOSITION UV Maharashtra & Goa 14 Uttar Pradesh 11 West Bengal, Sikkim & Odisha 10 Andhra Pradesh & Telangana 9 Tamil Nadu 8 Gujarat 7 Karnataka 7 Punjab & Haryana 6 Rajasthan 5 Madhya Pradesh 4 Delhi (NCR) 4 Bihar 4 Kerala 4 Chhattisgarh & Jharkhand 3 Assam & North East (7 States) 3 Himachal Pradesh & Uttarakhand 1 F E M A L E M A L E
  • 10.
    10 Source: ComscoreMMX Multi-platform, September 2022 , India Reach of social media apps by age group MILENNIALS 25-34 GEN Z 15-24 GEN X 35+ S O C I A L N E T W O R K S I N S TA N T M E S S E N G E R S 69% 69% 33% Facebook Instagram ShareChat 71% 59% 39% Facebook Instagram ShareChat 78% 53% 40% Facebook Instagram ShareChat 86% 49% 32% WhatsApp Telegram Google Messages 89% 45% 33% WhatsApp Telegram Google Messages 94% 38% 30% WhatsApp Telegram Google Messages
  • 11.
    11 Shareablee SyndicatedPlatform | January 1, 2022 – November 18, 2022 The Big Picture: Cross-platform Actions MEDIA & ENTERTAINMENT PUBLISHING SPORTS & RECREATION GOVERNMENT CONSUMER GOODS AUTOMOTIVE RETAIL TRAVEL
  • 12.
    12 Source: ComscoreShareablee, YTD 2022, Partnership Explorer, IN Sponsors Brands & Influencers are linked! Influencers and Sports Teams are critical to driving engagement in sponsored content for brands in India. T O P B R A N D E D C O N T E N T S P O N S O R E D C A T E G O R I E S 468,783 489,091 779,784 783,633 895,257 1,045,522 1,698,741 2,025,795 3,289,142 25,620,470 Influencers - Artists Influencers - Entertainers Influencers - Actors and Directors IN - Sports Influencers - Music Influencers - Video Creators UAE Sports IN - Professional Sports - IPLT20 Influencers - TV and Film Influencers - Athletes T O P B R A N D E D C O N T E N T S P O N S O R S 536,511 613,664 704,395 791,683 1,009,786 1,020,761 1,354,579 2,047,652 5,972,939 13,565,628 Wrogn ragecoffee_ samsungindia jeetwinofficial amtouristerin one8select themancompany herbalifeindiaofficial pumaindia staywrogn Influencers and Sports teams are critical in driving brand awareness & equity for brand sponsors, with Athletes & teams driving a vast majority of the engagement in sponsored content. Key household brands are prominent sponsors of branded content. Wrogn’s sponsored posts alone drove almost 1/3 of the total engagements.
  • 13.
    13 So why arepeople on social and how can we reach them?
  • 14.
    14 R E AC H Among all formats, video continues to grow in adoption Source: Shareablee Social Dynamics 2022 90% 74% 54% Of people on social consume content at least 1x/week Are Very / Somewhat Likely to check out a brand’s social media page when looking for a new product​ Are more likely to try out products recommended by an influencer on social media​ A C T I O N S C O N V E R S I O N
  • 15.
    15 And we’re findingways to connect even more fully with our friends, family, our passions Source: Shareablee Social Dynamics W H A T I S D R I V I N G Y O U R T I M E S P E N T O N S O C I A L M E D I A ? 2% 23% 44% 45% 48% 50% 54% Other How I express what is important to me Helps me Pass the time Entertainment therapy My primary way of staying up to date Helps me feel connected to friends and family Helps me feel connected to the outside world/what's happening
  • 16.
    16 Best Practices in2022: Looking Beneath the Surface Source: Shareablee Social Dynamics H A P P I N E S S E X C I T E M E N T W O M E N M E N Content that makes the sharer look funny to others was the strongest driver of social currency Content that makes the sharer look intelligent to others was the strongest driver of social currency 48% of women agreed that the most shared content was useful Usefulness was not a driver for men L O O K G O O D
  • 17.
    17 50.4 42.0 20.1 15.8 12.0 11.6 Neeraj Chopra Ammy VirkP. V. Sindhu Palak Muchhal Emiway Bantai Saikhom Mirabai Chanu Top Influencers in India Source: Shareablee Power Rankings A C T I O N S ( M I L L I O N ) YTD, the top mega influencers drive over 10M engagements each, showcasing their power to drive share of voice and resonance with the audience on social.
  • 18.
  • 19.
    19 Know your Audience ~67,000organic mentions A C T I O N S ( M I L L I O N ) The Indian Cricket Team social audience is over 22% more likely to engage with brands in the Science Snobs group than the average social engager based on their social engagement behavior with other pages and categories S C I E N C E S N O B S C I V I C A L LY - M I N D E D J O B S E E K E R S
  • 20.
    20 The Great ConsumerShift: Discover Trending Topics Source: Shareablee, Trend Topics, 10.11-11.8.2022, FB, IG, TW engagement-based IG Reels dominates in driving engagement for FIFA, with a surge at the end of October.
  • 21.
    21 Best Practices in2022: Stop the Social Scroll Shareablee Social Dynamics What are the elements of a social post that tend to make you stop and want to learn more? 47% 28% 32% 49% C A T C H Y O R A T T E N T I O N - G R A B B I N G H E A D L I N E S O M E T H I N G I N T E R E S T I N G I N T H E F I R S T F E W S E C O N D S O F A V I D E O S E E I N G O T H E R P E O P L E H A V E W A T C H E D / E N G A G E D W I T H I T T H E C O N T E N T C O M E S F R O M A S O U R C E T H A T I T R U S T / C A R E A B O U T A “fast start” to the video is more likely to make a Millennial stop and want to learn more compared to any other age group. Overall, all age groups will stop and engage with content that catches their eye – whether it is through a headline or an impactful first frame
  • 22.
    22 Short form videois preferred over long form (~2X), with the youngest age groups 18-34 showing the highest affinity (54%). Tune-up Tip #1: The Favored Format Source: Shareablee Social Dynamics What kinds of social content do you enjoy consuming the most? (select all that apply) n=2789 8% 11% 27% 36% 41% 50% 51% 51% Text Only Carousel Images Long-Form Video (>60sec) Articles Live Video Stories Short-Form Video (<60sec) Images
  • 23.
    23 Tune-up Tip #2: Optimizeby Platform Source: Shareablee Insight Studio Consumers expect you to be fully present and relevant, so while it may be tempting to jump on the latest social platform or content format, it’s critical you completely understand your current and aspirational customers first. 70.48% 50% 59.14% 8.81% 21.43% 39.68% 20.71% 28.57% Audience Content Actions Facebook Instagram Twitter
  • 24.
    24 Tune-up Tip #3: KnowWhen to Reach Them Source: Shareablee Insight Studio Create hot zones for your best posting times while identifying key times for marketing to competitive audiences for market share growth.
  • 25.