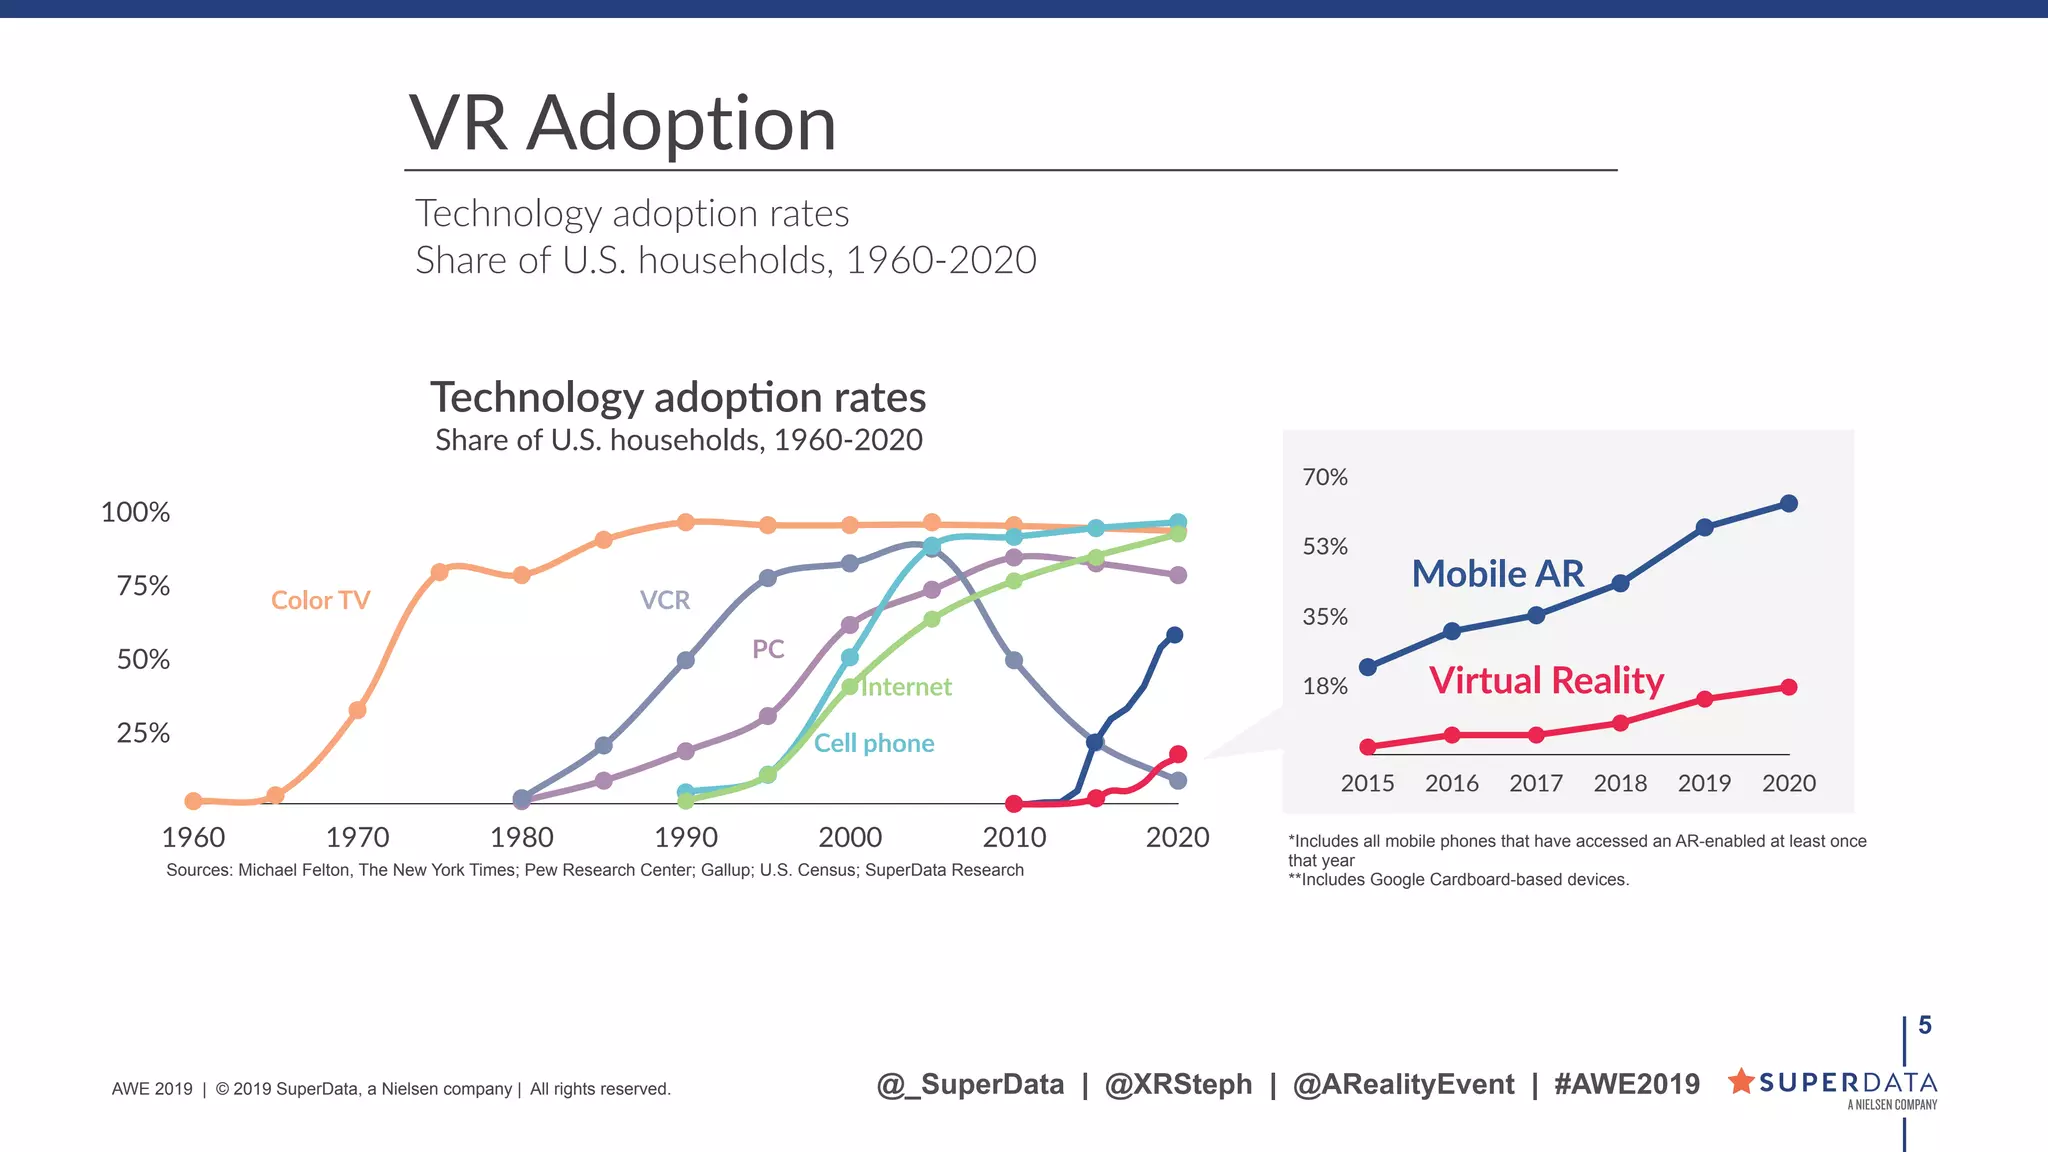
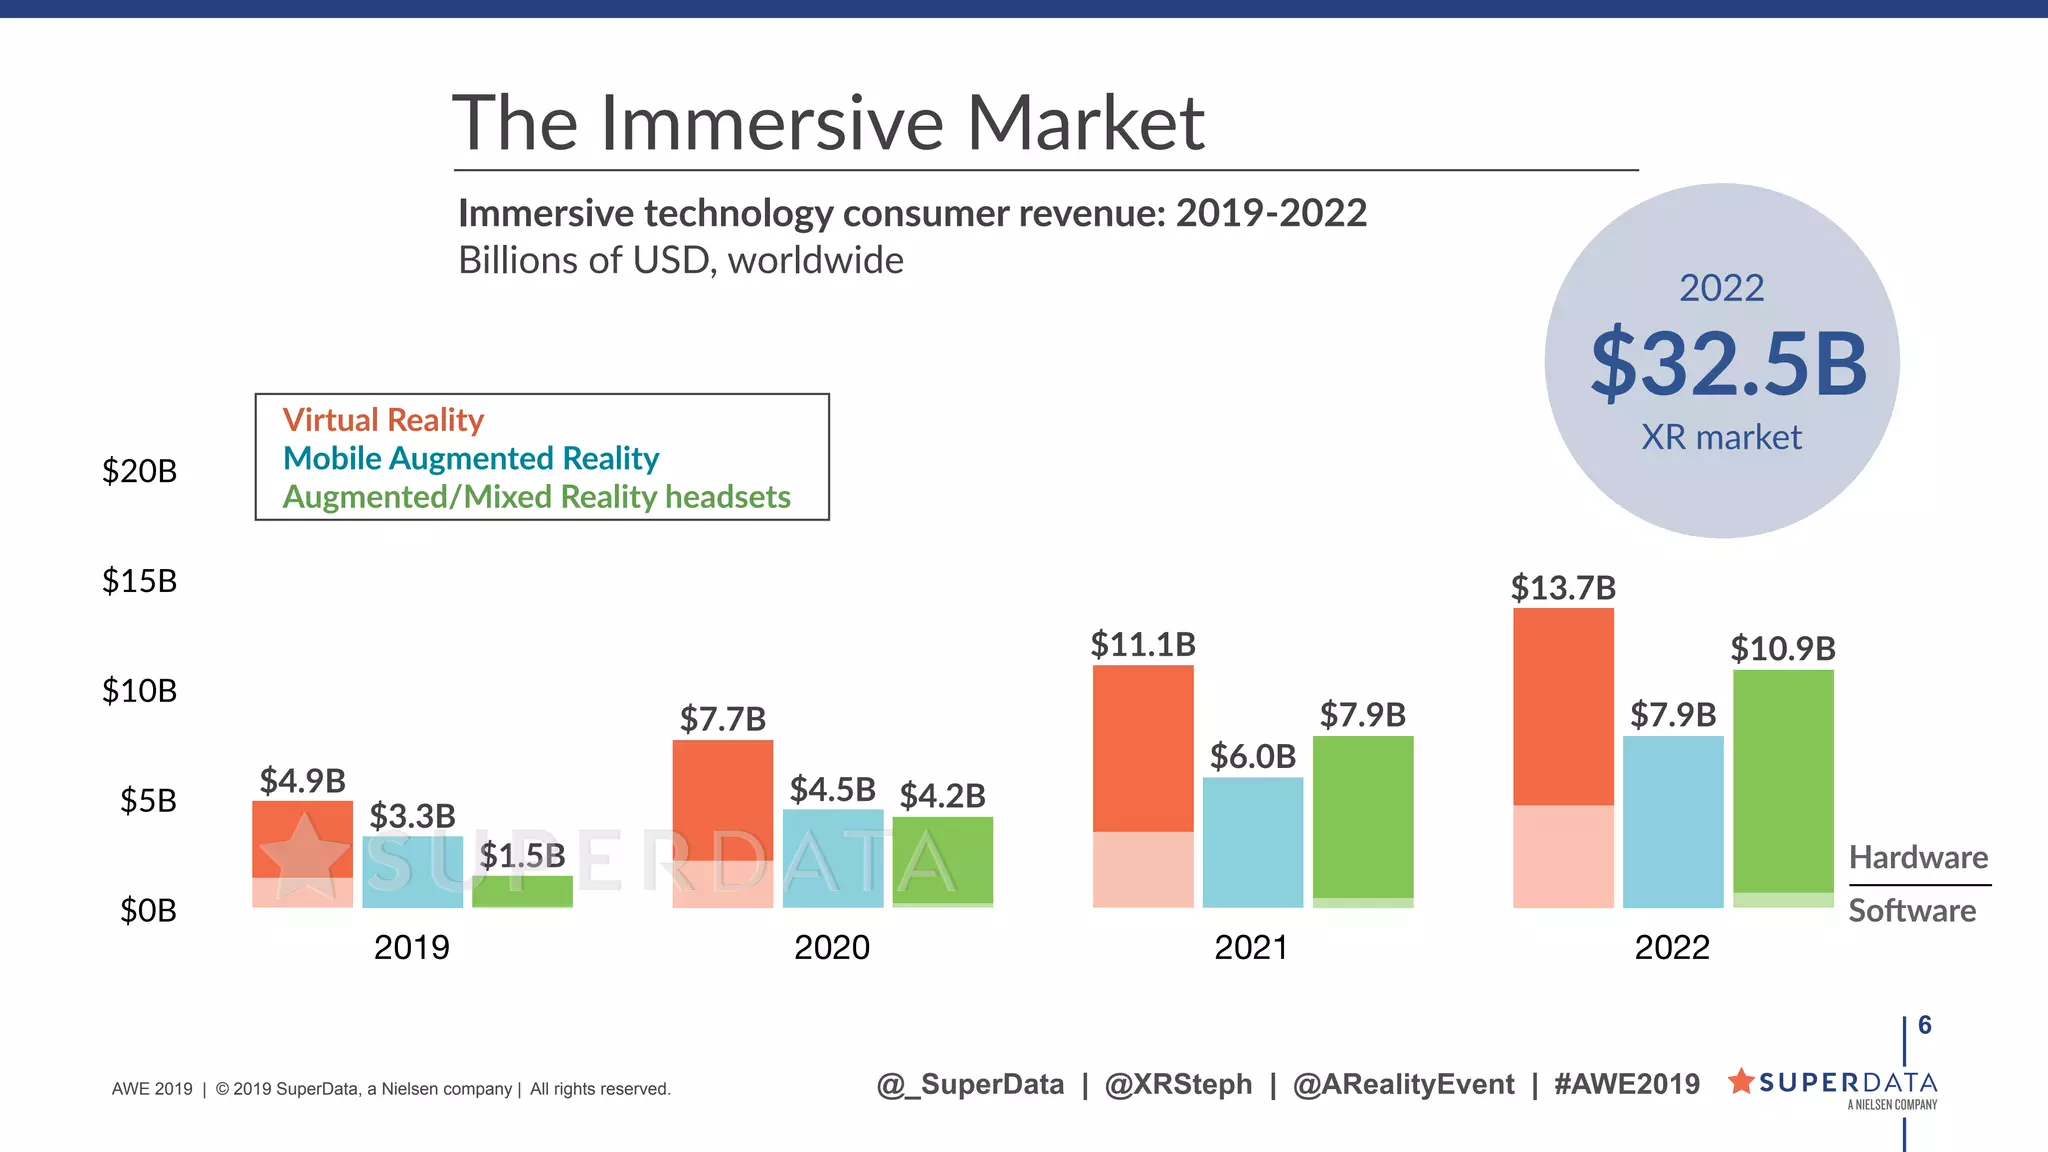
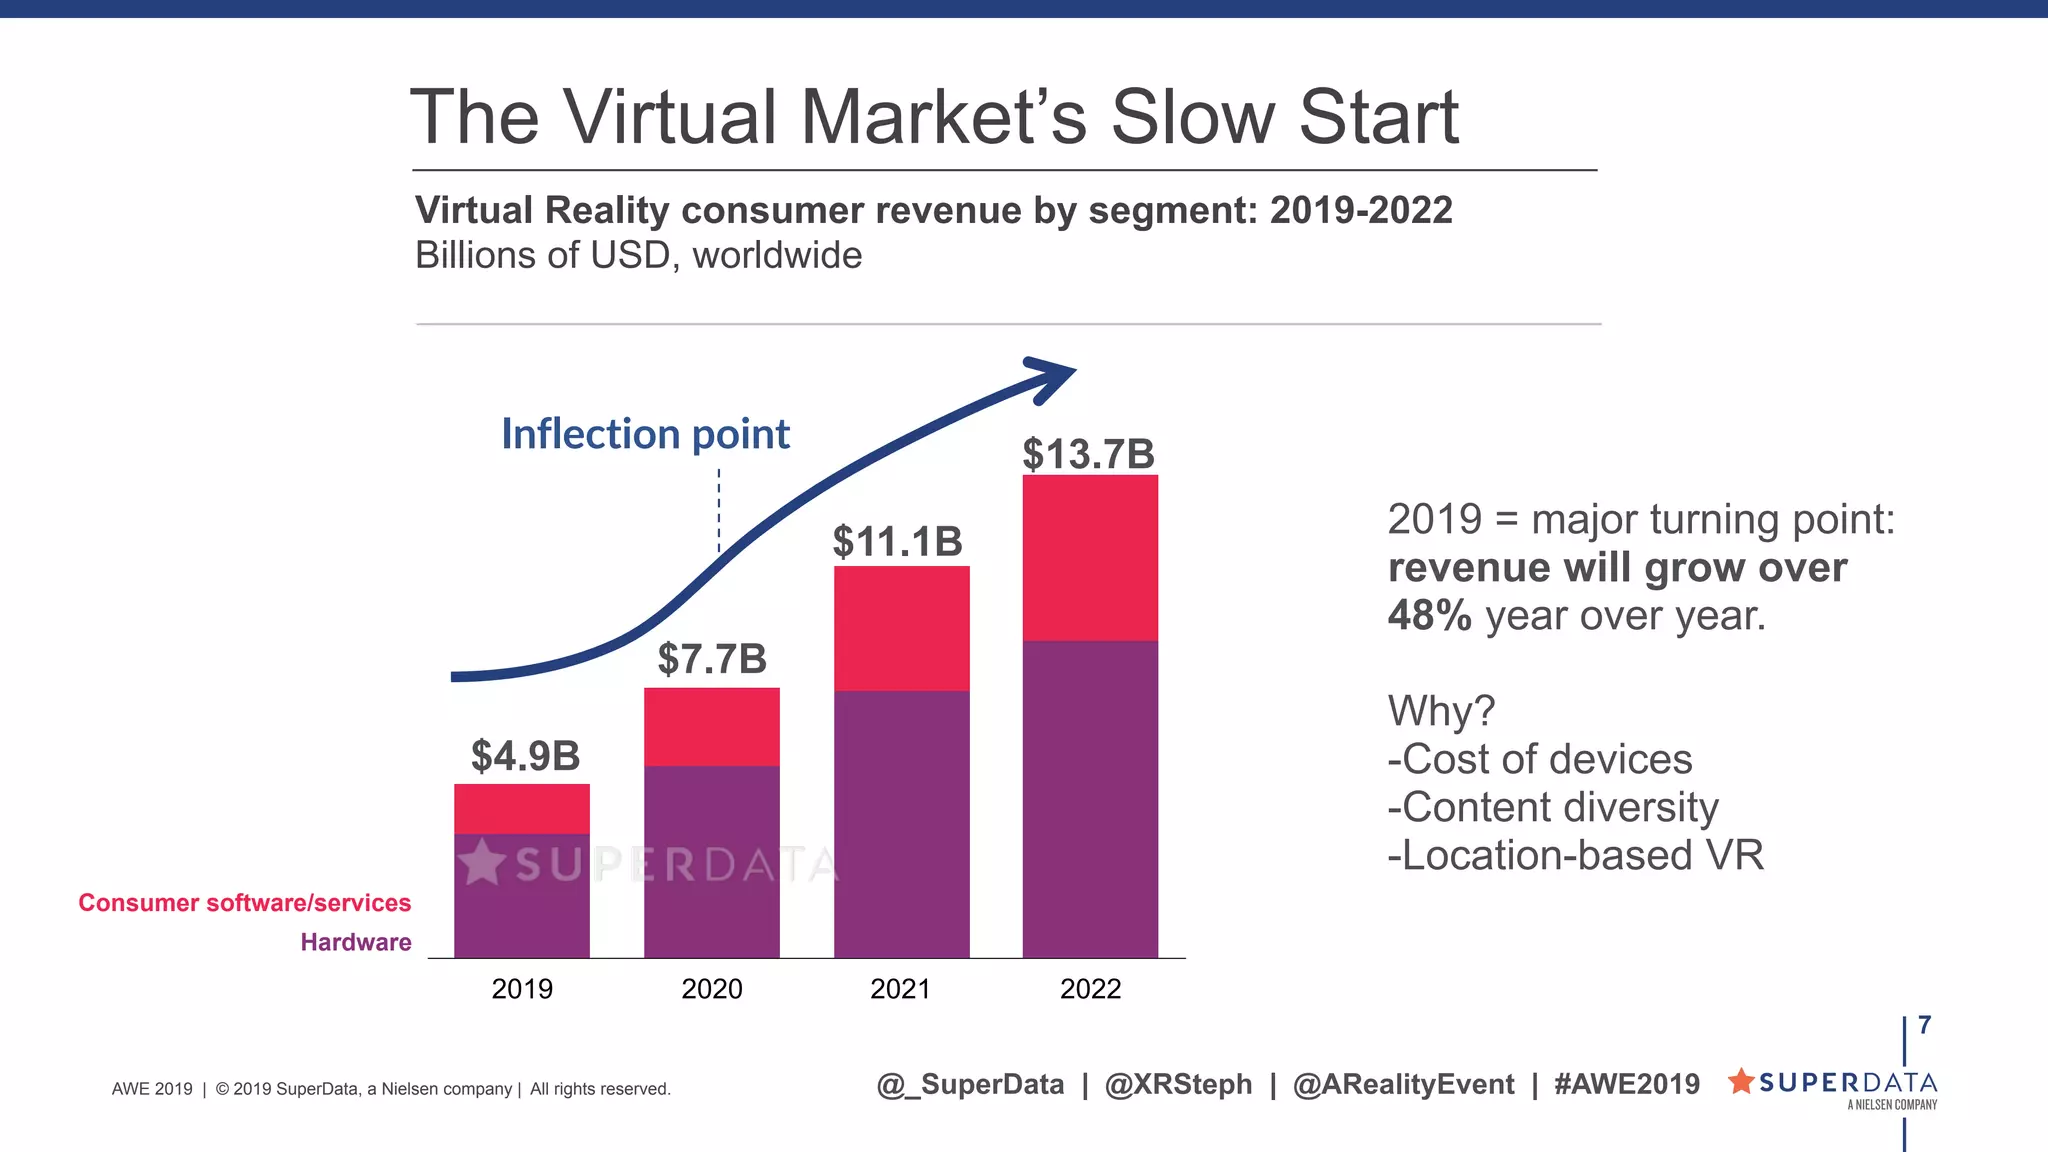
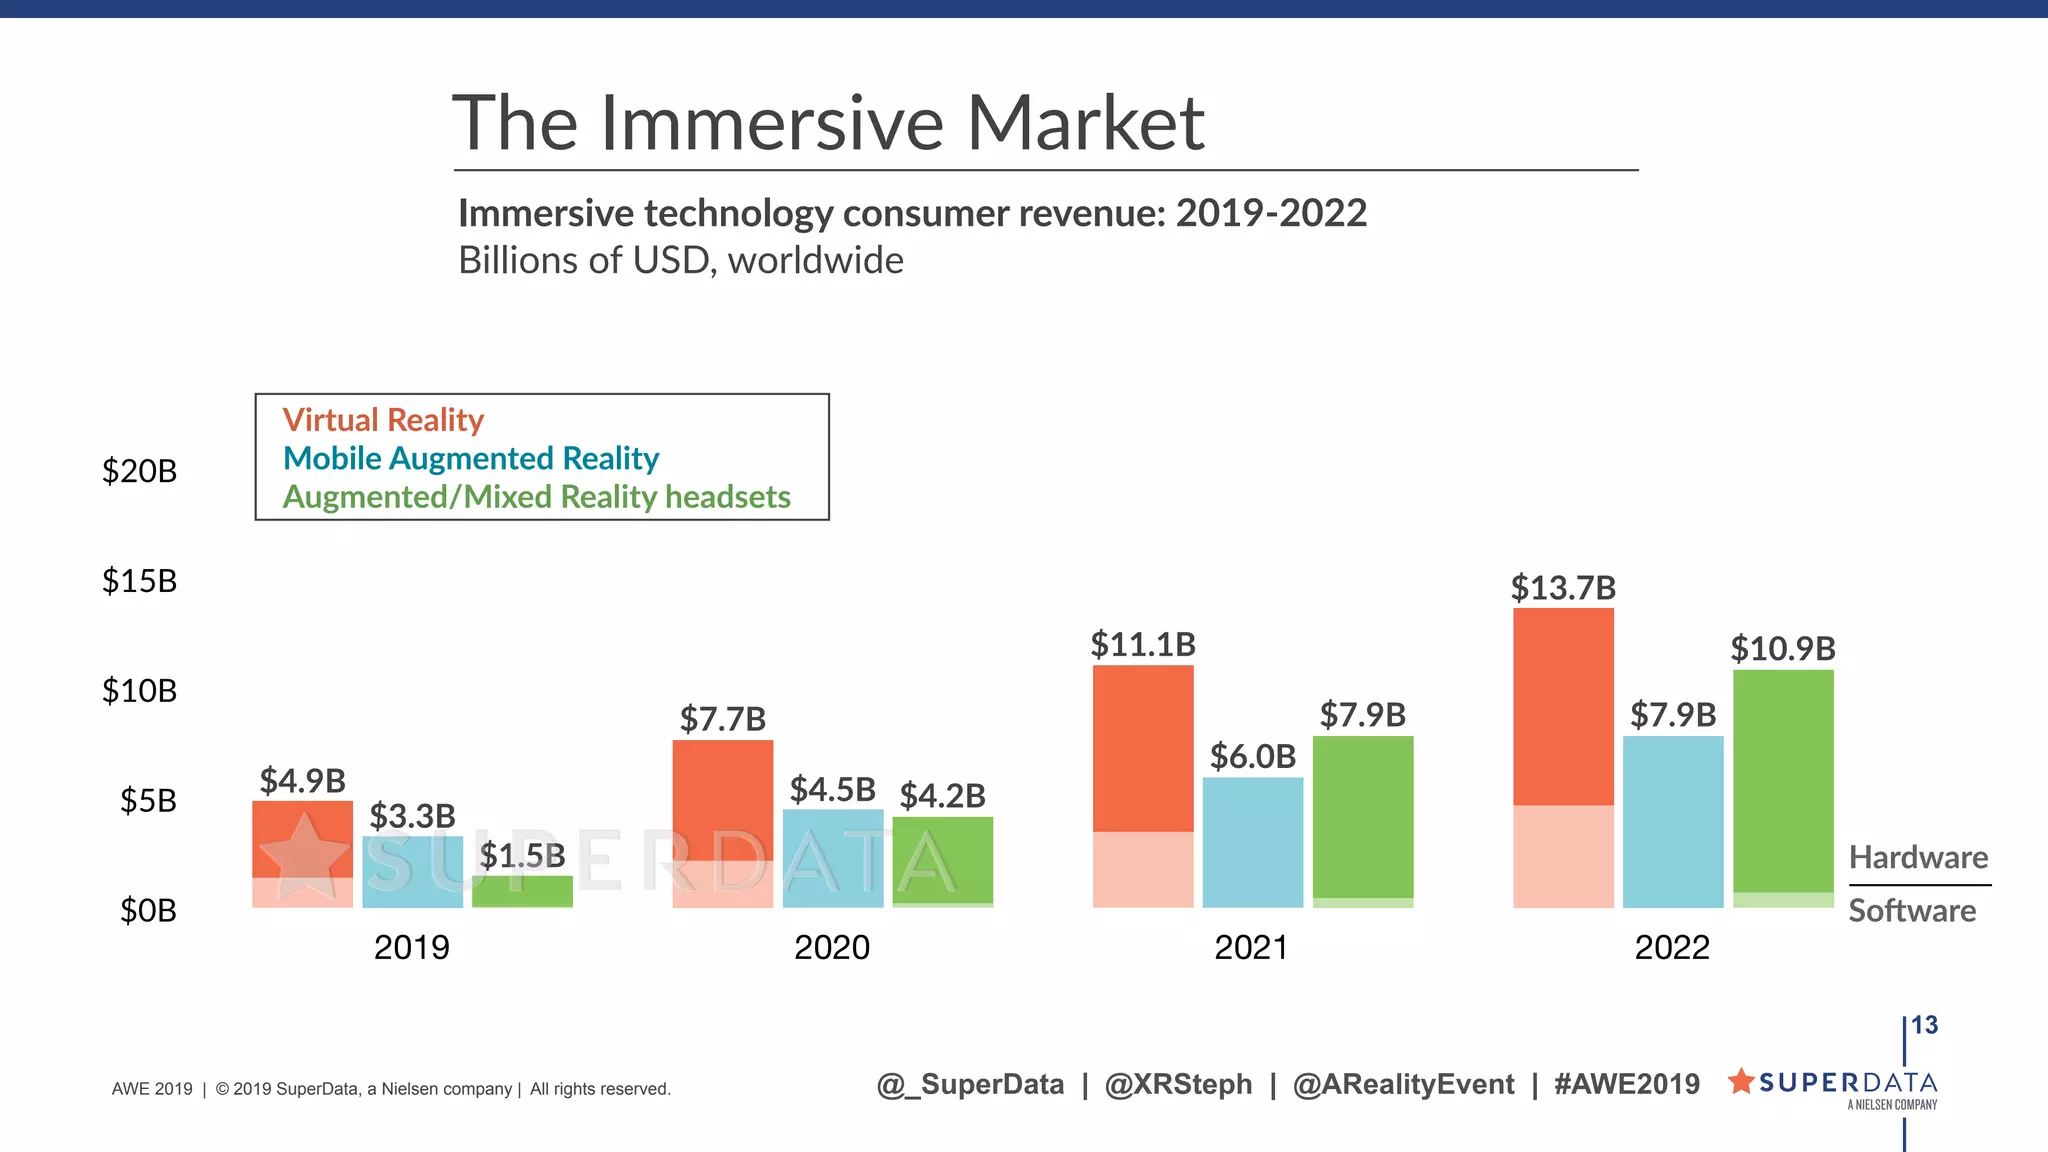
AWE 2019 | © 2019 SuperData, a Nielsen company | All rights reserved.
XR BY THE NUMBERS: WHAT THE
DATA TELLS US
May 2019
@_SuperData | @XRSteph | @ARealityEvent | #AWE2019
!2
AWE 2019 | © 2019 SuperData, a Nielsen company | All rights reserved.
Who I am
@_SuperData | @XRSteph | @ARealityEvent | #AWE2019
STEPHANIE LLAMAS
VP, Research & Strategy
Head of XR
@XRSteph
www.superdataresearch.com
!3
Our products include quarterly data
subscriptions, custom reports,
syndicated one-off reports
• Dynamic Markets, Explained
• Thinking, Doing, Buying
• Key Benefits
• Industry-Standard Methodology
• Your Questions, Answered
What we do
For more information, visit
superdataresearch.com
or email
stephanie.llamas@nielsen.com
@_SuperData | @XRSteph | @ARealityEvent | #AWE2019AWE 2019 | © 2019 SuperData, a Nielsen company | All rights reserved.
!4
The XR Data Network is the first
industry collaboration to quantify and
validate the global XR market.
• Partners include headset makers,
developers and ad networks
• Partners get ongoing insights and data to
improve strategy
How we do what we do
For more information, visit
superdataresearch.com
or email
stephanie.llamas@nielsen.com
@_SuperData | @XRSteph | @ARealityEvent | #AWE2019AWE 2019 | © 2019 SuperData, a Nielsen company | All rights reserved.
*Includes all mobile phones that have accessed an AR-enabled at least once
that year
**Includes Google Cardboard-based devices.
Technology adoption rates
Share of U.S. households, 1960-2020
VR Adoption
!5
25%
50%
75%
100%
1960 1970 1980 1990 2000 2010 2020
Color TV VCR
PC
Cell phone
Internet
Technology adop.on rates
Share of U.S. households, 1960-2020
18%
35%
53%
70%
2015 2016 2017 2018 2019 2020
Virtual Reality
Mobile AR
Sources: Michael Felton, The New York Times; Pew Research Center; Gallup; U.S. Census; SuperData Research
@_SuperData | @XRSteph | @ARealityEvent | #AWE2019AWE 2019 | © 2019 SuperData, a Nielsen company | All rights reserved.
$0B
$5B
$10B
$15B
$20B
2019 2020 2021 2022
$10.9B
$7.9B
$4.2B
$1.5B
$7.9B
$6.0B
$4.5B
$3.3B
$13.7B
$11.1B
$7.7B
$4.9B
!6
Immersive technology consumer revenue: 2019-2022
Billions of USD, worldwide
The Immersive Market
Virtual Reality
Mobile Augmented Reality
Augmented/Mixed Reality headsets
Hardware
SoHware
2022
$32.5B
XR market
@_SuperData | @XRSteph | @ARealityEvent | #AWE2019AWE 2019 | © 2019 SuperData, a Nielsen company | All rights reserved.
2019 2020 2021 2022
$4.9B
!7
Virtual Reality consumer revenue by segment: 2019-2022
Billions of USD, worldwide
The Virtual Market’s Slow Start
Consumer software/services
Hardware
$7.7B
$11.1B
$13.7BInflection point
2019 = major turning point:
revenue will grow over
48% year over year.
Why?
-Cost of devices
-Content diversity
-Location-based VR
@_SuperData | @XRSteph | @ARealityEvent | #AWE2019AWE 2019 | © 2019 SuperData, a Nielsen company | All rights reserved.
!8
VR headset shipments by type
2016-2022
The VR Market
0M
10M
20M
30M
2016 2017 2018 2019 2020 2021 2022
PC
Premium mobile
Console
Standalone
Oculus Go
HTC VIVE Focus
Lenovo Mirage Solo
Oculus Quest
@_SuperData | @XRSteph | @ARealityEvent | #AWE2019AWE 2019 | © 2019 SuperData, a Nielsen company | All rights reserved.
!9
SoHware revenue: 2019 vs. 2022
Billions of USD, worldwide
Virtual Reality SoOware
@_SuperData | @XRSteph | @ARealityEvent | #AWE2019AWE 2019 | © 2019 SuperData, a Nielsen company | All rights reserved.
EducaSon
2%
Social media
2%
Video & entertainment
media
3%
InteracSve media
7%
LocaSon-based
entertainment
39%
Games
45%
Worldwide
VR soOware
revenue
$1.4B
2019
!10
SoHware revenue: 2019 vs. 2022
Billions of USD, worldwide
Virtual Reality SoOware
@_SuperData | @XRSteph | @ARealityEvent | #AWE2019AWE 2019 | © 2019 SuperData, a Nielsen company | All rights reserved.
EducaSon
2%
Social media
2%
Video &
entertainment media
2%
InteracSve media
6%
LocaSon-based
entertainment
20%
Games
67%
Worldwide
VR soOware
revenue
$4.7B
2022
EducaSon
2%
Social media
2%
Video & entertainment
media
3%
InteracSve media
7%
LocaSon-based
entertainment
39%
Games
45%
Worldwide
VR soOware
revenue
$1.4B
2019
2015 2016 2017 2018 2019 2020
1.7B
1.4B
1.1B
0.5B0.6B
0.3B
11
Mobile Augmented Reality
Mobile AR users
@_SuperData | @XRSteph | @ARealityEvent | #AWE2019
Billions of users, worldwide
Usage, % share
AWE 2019 | © 2019 SuperData, a Nielsen company | All rights reserved.
12
2015 2016 2017 2018 2019 2020
1.7B
1.4B
1.1B
0.5B0.6B
0.3B
Mobile AR users Most popular types of AR apps
Social media apps
Online shopping
apps
AR games
Other 25%
34%
41%
84%
Billions of users, worldwide
Usage, % share
Mobile Augmented Reality
@_SuperData | @XRSteph | @ARealityEvent | #AWE2019AWE 2019 | © 2019 SuperData, a Nielsen company | All rights reserved.
$0B
$5B
$10B
$15B
$20B
2019 2020 2021 2022
$10.9B
$7.9B
$4.2B
$1.5B
$7.9B
$6.0B
$4.5B
$3.3B
$13.7B
$11.1B
$7.7B
$4.9B
!13
Immersive technology consumer revenue: 2019-2022
Billions of USD, worldwide
The Immersive Market
Virtual Reality
Mobile Augmented Reality
Augmented/Mixed Reality headsets
Hardware
SoHware
@_SuperData | @XRSteph | @ARealityEvent | #AWE2019AWE 2019 | © 2019 SuperData, a Nielsen company | All rights reserved.
$0B
$5B
$10B
$15B
$20B
2019 2020 2021 2022
$10.9B
$7.9B
$4.2B
$1.5B
$7.9B
$6.0B
$4.5B
$3.3B
$13.7B
$11.1B
$7.7B
$4.9B
!14
Immersive technology consumer revenue: 2019-2022
Billions of USD, worldwide
The Immersive Market
Virtual Reality
Mobile Augmented Reality
Augmented/Mixed Reality headsets
Hardware
SoHware
2022
$32.5B
XR market
@_SuperData | @XRSteph | @ARealityEvent | #AWE2019AWE 2019 | © 2019 SuperData, a Nielsen company | All rights reserved.

Stephanie Llamas (SuperData): XR by the Numbers: What the Data Tells Us

  • 1.
    AWE 2019 |© 2019 SuperData, a Nielsen company | All rights reserved. XR BY THE NUMBERS: WHAT THE DATA TELLS US May 2019 @_SuperData | @XRSteph | @ARealityEvent | #AWE2019
  • 2.
    !2 AWE 2019 |© 2019 SuperData, a Nielsen company | All rights reserved. Who I am @_SuperData | @XRSteph | @ARealityEvent | #AWE2019 STEPHANIE LLAMAS VP, Research & Strategy Head of XR @XRSteph www.superdataresearch.com
  • 3.
    !3 Our products includequarterly data subscriptions, custom reports, syndicated one-off reports • Dynamic Markets, Explained • Thinking, Doing, Buying • Key Benefits • Industry-Standard Methodology • Your Questions, Answered What we do For more information, visit superdataresearch.com or email stephanie.llamas@nielsen.com @_SuperData | @XRSteph | @ARealityEvent | #AWE2019AWE 2019 | © 2019 SuperData, a Nielsen company | All rights reserved.
  • 4.
    !4 The XR DataNetwork is the first industry collaboration to quantify and validate the global XR market. • Partners include headset makers, developers and ad networks • Partners get ongoing insights and data to improve strategy How we do what we do For more information, visit superdataresearch.com or email stephanie.llamas@nielsen.com @_SuperData | @XRSteph | @ARealityEvent | #AWE2019AWE 2019 | © 2019 SuperData, a Nielsen company | All rights reserved.
  • 5.
    *Includes all mobilephones that have accessed an AR-enabled at least once that year **Includes Google Cardboard-based devices. Technology adoption rates Share of U.S. households, 1960-2020 VR Adoption !5 25% 50% 75% 100% 1960 1970 1980 1990 2000 2010 2020 Color TV VCR PC Cell phone Internet Technology adop.on rates Share of U.S. households, 1960-2020 18% 35% 53% 70% 2015 2016 2017 2018 2019 2020 Virtual Reality Mobile AR Sources: Michael Felton, The New York Times; Pew Research Center; Gallup; U.S. Census; SuperData Research @_SuperData | @XRSteph | @ARealityEvent | #AWE2019AWE 2019 | © 2019 SuperData, a Nielsen company | All rights reserved.
  • 6.
    $0B $5B $10B $15B $20B 2019 2020 20212022 $10.9B $7.9B $4.2B $1.5B $7.9B $6.0B $4.5B $3.3B $13.7B $11.1B $7.7B $4.9B !6 Immersive technology consumer revenue: 2019-2022 Billions of USD, worldwide The Immersive Market Virtual Reality Mobile Augmented Reality Augmented/Mixed Reality headsets Hardware SoHware 2022 $32.5B XR market @_SuperData | @XRSteph | @ARealityEvent | #AWE2019AWE 2019 | © 2019 SuperData, a Nielsen company | All rights reserved.
  • 7.
    2019 2020 20212022 $4.9B !7 Virtual Reality consumer revenue by segment: 2019-2022 Billions of USD, worldwide The Virtual Market’s Slow Start Consumer software/services Hardware $7.7B $11.1B $13.7BInflection point 2019 = major turning point: revenue will grow over 48% year over year. Why? -Cost of devices -Content diversity -Location-based VR @_SuperData | @XRSteph | @ARealityEvent | #AWE2019AWE 2019 | © 2019 SuperData, a Nielsen company | All rights reserved.
  • 8.
    !8 VR headset shipmentsby type 2016-2022 The VR Market 0M 10M 20M 30M 2016 2017 2018 2019 2020 2021 2022 PC Premium mobile Console Standalone Oculus Go HTC VIVE Focus Lenovo Mirage Solo Oculus Quest @_SuperData | @XRSteph | @ARealityEvent | #AWE2019AWE 2019 | © 2019 SuperData, a Nielsen company | All rights reserved.
  • 9.
    !9 SoHware revenue: 2019vs. 2022 Billions of USD, worldwide Virtual Reality SoOware @_SuperData | @XRSteph | @ARealityEvent | #AWE2019AWE 2019 | © 2019 SuperData, a Nielsen company | All rights reserved. EducaSon 2% Social media 2% Video & entertainment media 3% InteracSve media 7% LocaSon-based entertainment 39% Games 45% Worldwide VR soOware revenue $1.4B 2019
  • 10.
    !10 SoHware revenue: 2019vs. 2022 Billions of USD, worldwide Virtual Reality SoOware @_SuperData | @XRSteph | @ARealityEvent | #AWE2019AWE 2019 | © 2019 SuperData, a Nielsen company | All rights reserved. EducaSon 2% Social media 2% Video & entertainment media 2% InteracSve media 6% LocaSon-based entertainment 20% Games 67% Worldwide VR soOware revenue $4.7B 2022 EducaSon 2% Social media 2% Video & entertainment media 3% InteracSve media 7% LocaSon-based entertainment 39% Games 45% Worldwide VR soOware revenue $1.4B 2019
  • 11.
    2015 2016 20172018 2019 2020 1.7B 1.4B 1.1B 0.5B0.6B 0.3B 11 Mobile Augmented Reality Mobile AR users @_SuperData | @XRSteph | @ARealityEvent | #AWE2019 Billions of users, worldwide Usage, % share AWE 2019 | © 2019 SuperData, a Nielsen company | All rights reserved.
  • 12.
    12 2015 2016 20172018 2019 2020 1.7B 1.4B 1.1B 0.5B0.6B 0.3B Mobile AR users Most popular types of AR apps Social media apps Online shopping apps AR games Other 25% 34% 41% 84% Billions of users, worldwide Usage, % share Mobile Augmented Reality @_SuperData | @XRSteph | @ARealityEvent | #AWE2019AWE 2019 | © 2019 SuperData, a Nielsen company | All rights reserved.
  • 13.
    $0B $5B $10B $15B $20B 2019 2020 20212022 $10.9B $7.9B $4.2B $1.5B $7.9B $6.0B $4.5B $3.3B $13.7B $11.1B $7.7B $4.9B !13 Immersive technology consumer revenue: 2019-2022 Billions of USD, worldwide The Immersive Market Virtual Reality Mobile Augmented Reality Augmented/Mixed Reality headsets Hardware SoHware @_SuperData | @XRSteph | @ARealityEvent | #AWE2019AWE 2019 | © 2019 SuperData, a Nielsen company | All rights reserved.
  • 14.
    $0B $5B $10B $15B $20B 2019 2020 20212022 $10.9B $7.9B $4.2B $1.5B $7.9B $6.0B $4.5B $3.3B $13.7B $11.1B $7.7B $4.9B !14 Immersive technology consumer revenue: 2019-2022 Billions of USD, worldwide The Immersive Market Virtual Reality Mobile Augmented Reality Augmented/Mixed Reality headsets Hardware SoHware 2022 $32.5B XR market @_SuperData | @XRSteph | @ARealityEvent | #AWE2019AWE 2019 | © 2019 SuperData, a Nielsen company | All rights reserved.