Download to read offline


![The bottom line
Although we do not expect video visits to stay at pandemic levels, they will almost certainly not return
to the pre-pandemic rate of about 1%. Evidence suggests that many caregivers agree: A summer 2020
webinar survey of US health care professionals found that only 5% anticipated virtual visits to return
to pre-pandemic levels.132
One big reason that virtual visits are likely to persist is that patients like them. In a recent survey,
nearly half of Americans said they prefer health care professionals who offer phone or web-
conference-based consultations.133
Virtual visits tend to be more efficient, reducing visit time by
20%.134
They reduce the wait time for seeing a specialist (pre-COVID-19 studies show that median wait
times for specialist consultations were down 50% in New York City and 75% in San Francisco following
virtual consultations).135
They eliminate the need to travel to and from a doctor’s office. They are also
seen as safer.136
Further, having video visits offer value beyond just convenience will enhance adoption
over time.
That said, there are still some patients who do not see video visits as equal to physical ones. In an
April 2020 survey, 66% of respondents believe that a doctor or nurse needs to physically examine
them to understand their health needs, and 56% don’t think they get the same quality of care/value
from a virtual visit as from an in-person visit.137
More broadly, although many patients, health professionals, insurers, and regulators already like
video visits, driving adoption higher than pandemic levels will require buy-in from not just some,
but many or all of these stakeholders. Health care providers and the health care ecosystem have
considered video visits and other kinds of virtual health as a substitutive channel for in-person care
delivery. ”Next reality” transformation requires capabilities to position video visits as a integral
channel for care management and as a way to drive reduction in the total cost of care.
Doctors and medical professionals are still learning how to optimize video technology and their own
behavior for new models of care. As just one example, health care professionals should adapt their
learning and training to go from a bedside manner to a “webside” manner. They also should look
strongly at more proactive care with wearable and “nearables” (smart objects: everyday items with
small, wireless computing devices attached to them) and more ubiquitous team-based solutions that
also support caregivers.
Whether insurers and governments continue to reimburse for virtual video visits will matter a great
deal in markets where insurers play a key role. Historically, many insurers have not paid for virtual
visits at the same rate (or at all) as in-person visits. Once again, however, COVID-19 has prompted
the situation to change. Many US insurers and the US Center for Medicare and Medicaid Services
(CMS) relaxed rules around virtual visit reimbursement due to the pandemic. According to one US
analysis, only 0.2% of the medical claims filed in March 2019 were telehealth-related; in March 2020,
that number had risen to 7.5%.138
Two-thirds of health professionals surveyed in a pre-COVID-19
2020 survey said that “top accelerators [for virtual health adoption] included overcoming regulatory
barriers such as licensing restrictions and restrictions on allowing for site-neutral payments, along
with implementing payment methods that reward better health outcomes.”139
Technology, Media, and Telecommunications Predictions 2021
48](https://image.slidesharecdn.com/technologymediaandtelecommunicationspredictions2021-210326095450/85/Technology-Media-and-Telecommunications-Predictions-2021-48-320.jpg)


![centers has fallen by 36% over 13 years, from 2.5 in 2007 to 1.59 in 2020 (lower numbers are
better). Hyperscale data centers do even better on the PUE scale, at around 1.1–1.2.193
That said, this
improvement has slowed in recent years, and both hyperscale cloud companies and chip companies are
working hand in hand to keep power consumption as low as possible.
Two megatrends account for much of cloud computing’s energy demands. The first is obvious: if overall
use of the cloud doubles, then, all other things being equal, energy use doubles as well. The second is
that AI is making up a higher and higher percentage of cloud computing. Between mid-2012 and 2018,
the cloud computing resources used by state-of-the art AI grew by 300,000 times.194
Much of this can be
attributed to the increasing use of a kind of AI called machine learning—more specifically, a subset of
machine learning called deep learning. In the past decade, deep learning has become more widely used
in the cloud, offering tremendous new functionality. But the way that deep learning has become more
powerful is by using much larger data sets for training, which means more computation, which in turn
results in greater energy use. According to one Canadian AI researcher, “The concern is that machine-
learning algorithms in general are consuming more and more energy, using more data, [and] training for
longer and longer.”195
Several avenues exist to keep cloud’s rising energy needs under control:
Improving overall transistor efficiency. Over time, transistors keep getting smaller. Today, a state-of-
the-art 10-nanometer (nm) semiconductor device fabrication node is about 20–30 times more power-
efficient than a 90-nm node from fifteen years ago.196
Over time, we expect data center chips to keep
becoming still more efficient.
Moving to special AI chips. Initially, all AI computing took place on general-purpose central processing
unit chips (CPUs.) Over time, more specialized AI-specific kinds of chips were put into data centers:
graphics processing units (GPUs, used for both training and inference), field programmable gate arrays
(FPGAs, mainly used for inference), and application-specific integrated circuits (ASICs, used for both
training and inference.)197
Although power efficiency varies by the exact chips and tasks, at a high level,
GPUs are 10–100 times more efficient than CPUs at training and 1–10 times as efficient at inference;
FPGAs are 10–100 times more efficient at inference; and ASICs are 100–1000 times more efficient at both
training and inference.198
As more of these AI-specific chips are deployed in data centers, data center
efficiency will keep improving.
Improving special AI chips. Moving from CPUs to specialized AI chips improves AI power efficiency, but
AI chip technology is not standing still either. As one example, the next-generation AI GPU Tesla T4 from
Nvidia doubled the energy efficiency for inference AI compared to its predecessor, Tesla P4.199
Moving some AI processing to the edge: At one time, almost all AI was performed on the cloud,
as edge devices such as smartphones, cameras, sensors and robots lacked the onboard processing
capacity for complex AI. By 2024, in contrast, more than 1.5 billion devices will have dedicated edge
AI chips (called neural processing units, or NPUs) in them by 2023.200
These NPUs, mainly used for
inference, will likely reduce the demand for energy over time: They tend to be more efficient than
the chips in data centers, and they eliminate the need to send large data files up to the cloud, which
consumes more energy. And not only are edge AI chips relatively efficient already, but they are
progressing rapidly, with one company announcing that its current edge AI solution is 25 times more
efficient than last year’s model.201
Technology, Media, and Telecommunications Predictions 2021
61](https://image.slidesharecdn.com/technologymediaandtelecommunicationspredictions2021-210326095450/85/Technology-Media-and-Telecommunications-Predictions-2021-61-320.jpg)
![transmission methods that have
been used for decades. Content is
created, relayed over radio waves, and
received—a technique that has been
delivering content wirelessly for more
than 100 years.
Like the technology itself, concerns
about the health effects of wireless
transmission are not new. Some
individuals were concerned about the
impacts of earlier mobile network
generations as well as of other types
of wireless network, principally Wi-Fi
and TETRA (a type of private radio
communications network often used by
emergency services). Looking further
back still, some people worried about
the health impacts of emissions from
television transmitters too.206
A common concern going back decades
has been the risk of brain and skin
cancer from mobile phones. However,
this concern has been demonstrated
to be unproven. A 2019 study of mobile
phone use and the incidence of brain
tumors in Australia found no increase
in the incidence of brain tumours since
the 1980s. The researchers looked at
the periods 1982–1992, 1993–2002,
and 2003–2013,207
which covered the
introduction of analog cellular (1G),
2G, 3G, and the beginning of 4G. Their
conclusion: “[There have been] no
increases in any brain tumour types,
including glioma and glioblastoma,
during the period of substantial mobile
phone use from 2003 to 2013.” As for skin
cancer, a 2018 review of medical studies
undertaken between 1995 and 2017
found that “overall evaluations showed
that the effects of mobile phone radiation
on skin diseases are weak and have no
statistical significance.”208
These skin
cancer study alone comprised data from
392,119 individuals—a very large sample
size.
What has been different about 5G
is that the means of amplifying
misunderstandings about its health
impacts, either deliberately or ignorantly,
are greater than ever, because the
capability to share true or false
information is greater than ever before.
Many individuals who believe 5G may
cause them harm have had these ideas
suggested to them, most typically via
social networks, in sensational but
plausible language.
Extremely low power, extremely
low risk
Of course, non-ionizing radiation is not
always completely harmless. The most
common form of non-ionizing radiation
is visible light, which has a higher energy
level than radio waves. An excess of
visible light—or even radio waves—can
produce heat, and in extreme cases cause
burns and body tissue damage. However,
the power behind the radiofrequency
radiation generated by mobile networks
is controlled and poses virtually no risk to
consumers.
Power transmission from mobile
telephony, including 5G, is far lower than
that from light bulbs, TV, radio towers,
or even sunlight on an overcast day. The
quantity of this power is measured in
watts, and a single watt is a tiny quantity
of energy. The power transmitted by the
mobile phones used in 2021 and into
the foreseeable future can reach up to
two watts, depending on the age of the
phone; it can be as low as 0.001 watt, with
the vast majority of devices in use this
year peaking at 1 watt. By comparison,
the power transmitted by CB radios,
which have been in use for decades,
reaches up to four watts.209
As with a car journey, the shorter the
distance, the less the power required.
A phone held next to the head or kept
in a pocket would have the greatest
impact. The radiation level from a phone
or speaker placed on a table near the
user would be lower. A smartphone
will transmit more power when base
stations are relatively distant, but most
smartphones are used predominantly
indoors, and tend to be connected to
Wi-Fi routers (which are effectively
Technology, Media, and Telecommunications Predictions 2021
66](https://image.slidesharecdn.com/technologymediaandtelecommunicationspredictions2021-210326095450/85/Technology-Media-and-Telecommunications-Predictions-2021-66-320.jpg)


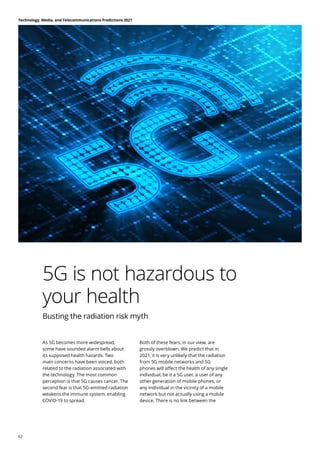
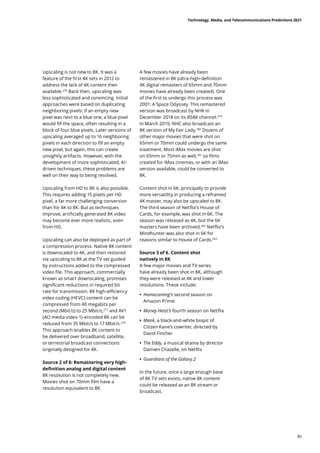
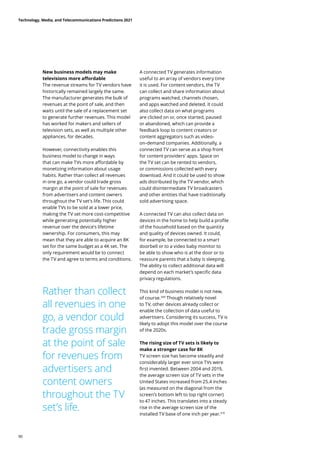
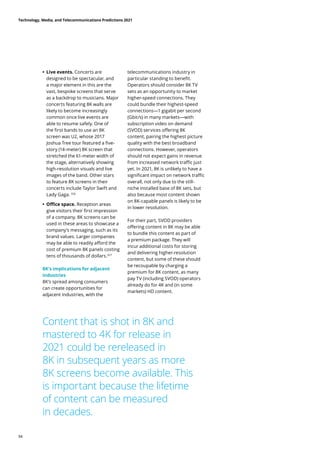
![TV’s New Year’s
resolution
The start of the 8K wave
If you have a 4K-resolution TV screen—
and many consumers do these days—
you’re used to seeing your favorite
shows, movies, and videos with few
visible individual pixels. But over the next
few years, those images may be about
to get even sharper. We predict that
8K—an upgrade and complement to 4K
resolution—will generate US$3.3 billion in
global revenue in 2021, with this amount
rising steadily over subsequent years
(figure 15).265
These revenues will come
predominantly from sales of 8K TV sets to
consumers (an anticipated 1 million units
with an average selling price [ASP] of
US$3,300), with the standard becoming
increasingly popular for the largest
television set sizes. In addition, sales of
equipment (such as cameras, monitors,
storage, and computers) related to the
creation and production of 8K content
should generate hundreds of millions of
dollars globally for the year.
Technology, Media, and Telecommunications Predictions 2021
82](https://image.slidesharecdn.com/technologymediaandtelecommunicationspredictions2021-210326095450/85/Technology-Media-and-Telecommunications-Predictions-2021-82-320.jpg)
![double every year from 2019 to 2024.
And both post-secondary and K–12 lab
and field spending on digital reality is
expected to rise more than 120% annually
over the same period.333
It may be surprising that organizational
XR sales are expected to gain ground on
those to consumers, especially in a time
of pandemic when consumers might have
flocked to VR headsets to alleviate the
boredom of being locked down at home.
(The consumer headset market is almost
entirely for VR headsets, with AR and
MR being primarily enterprise devices.)
In tech blogger Ben Evans’ memorable
phrase, pandemic lockdowns were a
kind of “forced experiment” for various
technologies—including work-from-home
tools, online grocery delivery, and home
entertainment setups for gaming and
video streaming—and VR seems a natural
technology for consumers to add to the
mix.334
But although consumer VR did not
collapse in 2020, neither did it surge. To
quote Ben Evans again: “This should have
been a [consumer] VR moment, and it
isn’t.”335
Consumers bought about US$2.9
billion worth of VR headsets in 2020,
down 12% from US$3.3 billion in 2019,
though sales are expected to rebound
to US$3.5 billion in 2021.336
That 2020
decline is better than what happened to
cinema attendance during the COVID-19
lockdowns, which were down 66%
worldwide for the year.337
But it is less
good than game console sales, which
were up 150% annually in March 2020 as
billions of people confined to their homes
sought ways to entertain themselves.338
Given lower-than-hoped for growth
in the consumer market, XR headset
makers have been shifting to the
enterprise. The first AR headset, Google
Glass, was originally intended for the
consumer market at its release in 2014,
but it was relaunched in 2017 in a pivot
to the enterprise market339
. In April of
2020, Magic Leap announced that it
too had decided to pursue enterprises
Overall spending on AR and VR headsets,
software, and services, including
purchases by consumers, rose in 2020
to US$12 billion globally, up 50% from
2019.329
Although this figure is lower
than the prepandemic forecast of almost
80% growth, it was much better than
worldwide IT spending, which declined by
more than 5% for 2020 year over year.330
Postpandemic, higher growth is expected
to resume for XR, with one group
predicting the industry will reach a total
of US$73 billion in 2024, or a 54% annual
growth rate between 2020 and 2024.331
Although the predicted growth rate in
headsets specifically is off a low base,
with fewer than 100,000 VR, AR, and
MR headsets purchased annually by
enterprises and schools from 2015
through 2019, the upward trend appears
clear. Market growth for these types
of headsets has already accelerated
in some markets due to the risk of
COVID-19 infection driving their use
in teaching employees and students
virtually rather than in person. With the
pandemic accelerating the opportunity
to demonstrate their value, digital
reality headsets may continue to gain
ground after the pandemic ends due to
a variety of other benefits, such as lower
cost, greater safety, and better learning
retention.
XR’s pivot to the enterprise market
Within the total XR industry, enterprise
applications such as training and
industrial maintenance were predicted
to generate US$1.3 billion and US$0.4
billion in 2020, respectively.332
These
numbers are still smaller than consumer
sales—but over the next few years,
organizational purchases of XR will likely
narrow the gap, with all of the fastest-
growing digital reality markets expected
to be in enterprise or education. Sales
of XR for use in public infrastructure
maintenance, industrial maintenance,
and logistics and package delivery
management are predicted to more than
Technology, Media, and Telecommunications Predictions 2021
97](https://image.slidesharecdn.com/technologymediaandtelecommunicationspredictions2021-210326095450/85/Technology-Media-and-Telecommunications-Predictions-2021-97-320.jpg)


![275. Samsung Newsroom, “[The future of viewing] QLED 8K: Where AI upscaling meets deep learning,” April
3, 2020.
276. For an explanation of how upscaling was applied on the first 4K TVs, and why this sometimes delivered
suboptimal images, see Hicks, “Here’s the secret behind 8K AI upscaling technology.”
277. Jeff Baumgartner, “Putting the squeeze on 8K,” Light Reading, May 19, 2020.
278. Ibid.
279. Gavin J. Blair, “Japan’s NHK launches world’s first 8K TV channel,” Hollywood Reporter, January 4, 2019.
280. My Fair Lady had already been scanned into 8K a few years back in order to create a 4K version. The 8K
version created for 8K broadcast was based on the existing archived scan. See Carolyn Giardina, “‘My
Fair Lady’ gets 8K restoration,” Hollywood Reporter, March 8, 2019.
281. Display Daily, “Production of 8K content for 8K TVs,” accessed November 5, 2020.
282. Jacob Kastrenakes, “Netflix had House of Cards’ third season made in 6K,” The Verge, March 10, 2015.
283. Matt Mulcahey, “DP Erik Messerschmidt on shooting Netflix’s Mindhunter with a custom red
Xenomorph,” Filmmaker Magazine, October 26, 2017.
284. There are also a few devices with 64-megapixel and 108-megapixel capabilities that may output photos
as 12 megapixels by compressing nine pixels into one. For more information, see Sam Byford, “Why
Samsung’s 108-megapixel camera isn’t just a gimmick,” The Verge, February 12, 2020; Sam Byford, “Do
64-megapixel phone cameras really make a difference?,” The Verge, October 1, 2019.
285. Richard Bennett, “The best 8K phones in 2020,” Wondershare, October 20, 2020.
286. Jamie Carter and James Artaius, “What is 8K? And what does it mean to photographers and
videomakers?,” Digital Camera World, July 7, 2020.
287. Rasmus Larsen, “YouTube now streaming 8K video on 8K TVs with AV1 support,” FlatpanelsHD, May 8,
2020.
288. Vimeo, “Videos tagged ‘8k,’” accessed September 23, 2020.
289. Geoffrey Morrison, “PS5 and Xbox Series X can game in 8K resolution. Should you care?,” CNET, October
29, 2020.
290. Consoles will use SSD to enable much faster loading of games content. See Chaim Gartenberg, “Sony
reveals full PS5 hardware specifications,” The Verge, March 18, 2020.
291. Ibid.
292. Charlie Noon, “1080p vs. 4K gaming: Is gaming at 4K worth it?,” WePC, October 28, 2020.
293. For example, Apple Fitness+ enables data from the Apple Watch wrist wearable device to be displayed
on a television set via the Apple TV digital media extender. See Apple, “Apple Fitness+,” accessed
September 23, 2020. TMT Predictions 2021 is an independent publication and has not been authorized,
sponsored, or otherwise approved by Apple Inc.
294. Amazon Fire TV, “All 182 screensavers on your Amazon Fire TV and their locations (photos),” June 16,
2017; Benjamin Mayo, “Apple TV now features 10 beautiful underwater video screensavers,” 9to5Mac,
September 25, 2019. TMT Predictions 2021 is an independent publication and has not been authorized,
sponsored, or otherwise approved by Apple Inc.
295. For example, see Loupe, accessed September 23, 2020.
296. GfK, “4K is becoming the standard for today’s TVs,” press release, September 4, 2019.
297. The Korea Bizwire, “8K TV war intensifies but consumers still prefer 4K.”
298. Ibid.
299. Ibid.
300. 8K TV sets first went on sale in the last quarter of 2017. See GfK, “4K is becoming the standard for
today’s TVs.”
301. Advanced Television, “IHS: Over half of Q4 TV shipments were UHD,” March 7, 2019.
302. Chris Chinnock, “Yes, you really can see 8K in your future,” Information Display, November 28, 2019.
303. GfK, “4K is becoming the standard for today’s TVs.”
304. Danielle Cassagnol, “Consumer tech U.S. sales to reach record $422 billion in 2020; streaming services
spending soars, says CTA,” Consumer Technology Association, press release, January 5, 2020.
305. GfK, “Global smartphone sales reached $522 billion in 2018,” press release, February 22, 2019.
306. Gartner, “Gartner forecasts worldwide device shipments to decline 14% in 2020 due to coronavirus
impact,” press release, May 26, 2020.
Technology, Media, and Telecommunications Predictions 2021
111](https://image.slidesharecdn.com/technologymediaandtelecommunicationspredictions2021-210326095450/85/Technology-Media-and-Telecommunications-Predictions-2021-111-320.jpg)


The document outlines predictions for the technology, media, and telecommunications (TMT) sectors in India for 2021, heavily influenced by the COVID-19 pandemic, which acted as a catalyst for accelerated change in these industries. It highlights significant growth in online gaming, driven by factors like increased smartphone penetration, affordable data services, and a young demographic base, projecting a growth rate of 40% up to 2022. Additionally, the report emphasizes the expected broad-based cloud adoption among various sectors, further fueled by the pandemic-induced shifts in business operations and consumer behavior.