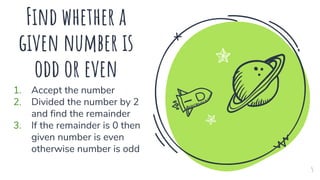
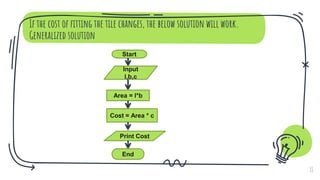
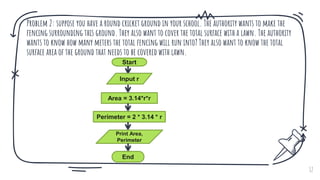
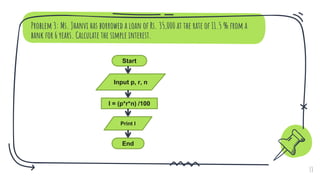
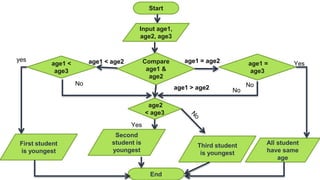
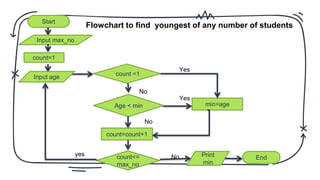
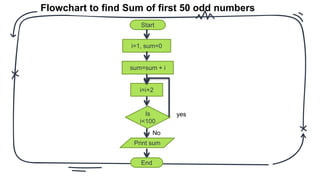
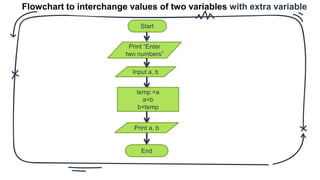
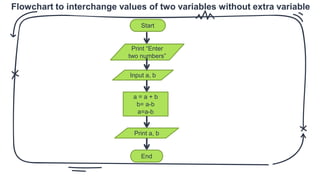
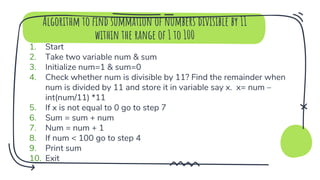
Chapter 9
Problem and problem
solving
What a problem can be?
 Problem solving can be a mental or machine (any systematic
procedure) process that leads to the desired outcome
required by the user.
 Thus the problem can be classified into two types
■ Well defined problem – Well defined problems have
clear goals and hence we can clearly define solution
steps.
■ And ill defined problem- no clear goals and hence cant
define steps to solve the problem.
■ In fact computers solve well defined problems only
2
What a problem can be?
✗ Well defined problems have clear goals and hence we can clearly
define solution steps. It is fact that computers solve well defined
problems only.
✗ In the field of computers, solution of a given problem is a
sequence of instructions given to a computer.
✗ Computer can solve variety of problems from the easiest to the
most complex ones.
✗ To solve a problem it needs to be given a complete set of
instructions. These instructions tell the computer what is to be
done at every step. Computer does not solve a problem; it
merely assists in solving the problem.
3
Steps to solve any problem
1. Define the problem
2. Identify the input, output and constraint of the problem
3. Identify different alternative from the above list.
4. Choose the best possible alternative from the above list.
5. Prepare detailed stepwise instruction set of the identified alternative
6. Compute results using this instruction set.
7. Check correctness of the answer obtained.
Steps 1 to 5 are performed by person who needs the solution,
while step 6 and 7 are performed by a computer.
4
Find whether a
given number is
odd or even
1. Accept the number
2. Divided the number by 2
and find the remainder
3. If the remainder is 0 then
given number is even
otherwise number is odd
5
1. Pseudo code
2. Flowchart
3. Algorithm
 The three steps given for finding whether a number is odd or even is
known as pseudo code.
 Pseudo code means fake or simulated, we should consider the second
meaning (ie Flowchart) as it is more appropriate in our context.
 The steps mentioned to solve the problem is simulated code.
The generalized solution to the problem using three
different technique
6
Flow chart
✗ A flowchart is a technique in which we use pictorial representation
of every action that we perform within the machine process that
solves a problem.
✗ A set of symbols, showing different actions, is used to represent a
flowchart.
✗ The symbols are also called components of flowcharts.
✗ We have a unique symbol corresponding to each action within a
process.
7
Symbols of Flowchart
Start/ end
✗ An oval represents a start or end point
Arrows
✗ An arrow is used to show the sequence of the actions that are
to be performed.
Input / Output
✗ A parallelogram represents input or output
Process
✗ A rectangle represents a process. A process is the core part of
any solution procedure. It is a sequence of actions. Normally a
process in computer is either arithmetic or logical operation.
8
Symbols of Flowchart
Decision
✗ A diamond indicates a decision. It is used when we want to
alter the normal sequence of the solution or when a specific
statement needs to be executed based on the result of decision
Connector
✗ A circle indicated a connector. Sometimes a flowchart may not
fit into a single part or not possible to link two process. A
connector can be used to join the two parts.
9
Problem 1: The fitting charge of tiles is Rs. 10 per square feet. Now assume that the problem is
to find the total cost of fitting tiles on the rectangular shaped town hall floor
10
Start
Input l,b
Area = l*b
Cost = Area * 10
Print Cost
End
If the cost of fitting the tile changes, the below solution will work.
Generalized solution
11
Start
Input
l,b,c
Area = l*b
Cost = Area * c
Print Cost
End
12
Problem 2: suppose you have a round cricket ground in your school. The authority wants to make the
fencing surrounding this ground. They also want to cover the total surface with a lawn. The authority
wants to know how many meters the total fencing will run into? They also want to know the total
surface area of the ground that needs to be covered with lawn.
Start
Input r
Area = 3.14*r*r
Perimeter = 2 * 3.14 * r
Print Area,
Perimeter
End
Problem 3: Ms. Jhanvi has borrowed a loan of Rs. 35,000 at the rate of 11.5 % from a
bank for 6 years. Calculate the simple interest.
13
Start
Input p, r, n
I = (p*r*n) /100
Print I
End
Problem 4: Assume that you want to find out the youngest student amongst two students.
The input in this case will be the age of the student.
14
Start
Input age1, age2
Compare
age1 & age2
Print both
students have
same age
Print First
student is
youngest
Print
Second
student is
youngest
End
Age1 < Age2 Age1 > Age2
Age1 = Age2
Start
Input age1,
age2, age3
Compare
age1 &
age2
age1 =
age3
age1 <
age3
age1 = age2
age1 < age2
age2
< age3
age1 > age2
First student
is youngest
All student
have same
age
yes
Yes
No
Yes
Third student
is youngest
Second
student is
youngest
No
No
End
Start
Input max_no
count=1
count =1
min=age
Age < min
count=count+1
No
Yes
Yes
No
count<=
max_no
Input age
yes Print
min
End
No
Flowchart to find youngest of any number of students
Start
i=1, sum=0
sum=sum + i
i=i+2
Is
i<100
yes
No
Print sum
End
Flowchart to find Sum of first 50 odd numbers
Flowchart to interchange values of two variables with extra variable
Start
Print “Enter
two numbers”
Input a, b
temp =a
a=b
b=temp
Print a, b
End
Flowchart to interchange values of two variables without extra variable
Start
Print “Enter
two numbers”
Input a, b
a = a + b
b= a-b
a=a-b
Print a, b
End
Advantages of flowchart
1. As it provides pictorial representation of the
problem solution, it is easy to understand.
2. It provides a convenient aid for writing computer
instructions.
3. It assists the programmer in reviewing and
correcting the solution steps.
4. It helps in discussion of different methods for
solving a problem. This is turn provides us a
facility to compare them accurately.
Disadvantages of flowchart
1. Drawing a flowchart for a large and complex
problem is time consuming and laborious.
2. As a flowchart consists of symbols, any changes
or modification in the program logic will most of
the times require a new flowchart to be drawn.
3. There are no standards specifying the details of
data that should be shown in a flowchart. Hence
flowchart for a given problem although with
similar logic may vary in terms of data shown.
Algorithm
 Algorithm refers to a step by step procedure for solving a
particular problem.
 An algorithm is written in a natural language like English.
 Algorithm once written then can be easily converted into
computer programs.
Algorithm to find summation of numbers divisible by 11
within the range of 1 to 100
1. Start
2. Take two variable num & sum
3. Initialize num=1 & sum=0
4. Check whether num is divisible by 11? Find the remainder when
num is divided by 11 and store it in variable say x. x= num –
int(num/11) *11
5. If x is not equal to 0 go to step 7
6. Sum = sum + num
7. Num = num + 1
8. If num < 100 go to step 4
9. Print sum
10. Exit
Algorithm to find compound interest
1. Start
2. Take four variables P,R,N and I
3. Assign values to P,N & R.
4. Calculate compound interest using
I = P * (1+R/100)N –P
5. Print value stored in I
6. End
Algorithm to find out the total weekly pay to be given to an
employee based on the number of hours he/she has worked
1. Start
2. Take three variables no_of_hrs_worked,
pay_per_hour and weekly_pay.
3. Assign value of no_of_hrs_worked & pay_per_hour
4. Calculate weekly pay
weekly_pay = no_of_hrs_worked * pay_per_hour
5. Print value stored in weekly_pay
6. End
Thanks!
Any questions?
You can find me at:
✗ nuzhatmemon.com
✗ nuzhat.memon@gmail.com
26

Std 10 computer chapter 9 Problems and Problem Solving

  • 1.
    Chapter 9 Problem andproblem solving
  • 2.
    What a problemcan be?  Problem solving can be a mental or machine (any systematic procedure) process that leads to the desired outcome required by the user.  Thus the problem can be classified into two types ■ Well defined problem – Well defined problems have clear goals and hence we can clearly define solution steps. ■ And ill defined problem- no clear goals and hence cant define steps to solve the problem. ■ In fact computers solve well defined problems only 2
  • 3.
    What a problemcan be? ✗ Well defined problems have clear goals and hence we can clearly define solution steps. It is fact that computers solve well defined problems only. ✗ In the field of computers, solution of a given problem is a sequence of instructions given to a computer. ✗ Computer can solve variety of problems from the easiest to the most complex ones. ✗ To solve a problem it needs to be given a complete set of instructions. These instructions tell the computer what is to be done at every step. Computer does not solve a problem; it merely assists in solving the problem. 3
  • 4.
    Steps to solveany problem 1. Define the problem 2. Identify the input, output and constraint of the problem 3. Identify different alternative from the above list. 4. Choose the best possible alternative from the above list. 5. Prepare detailed stepwise instruction set of the identified alternative 6. Compute results using this instruction set. 7. Check correctness of the answer obtained. Steps 1 to 5 are performed by person who needs the solution, while step 6 and 7 are performed by a computer. 4
  • 5.
    Find whether a givennumber is odd or even 1. Accept the number 2. Divided the number by 2 and find the remainder 3. If the remainder is 0 then given number is even otherwise number is odd 5
  • 6.
    1. Pseudo code 2.Flowchart 3. Algorithm  The three steps given for finding whether a number is odd or even is known as pseudo code.  Pseudo code means fake or simulated, we should consider the second meaning (ie Flowchart) as it is more appropriate in our context.  The steps mentioned to solve the problem is simulated code. The generalized solution to the problem using three different technique 6
  • 7.
    Flow chart ✗ Aflowchart is a technique in which we use pictorial representation of every action that we perform within the machine process that solves a problem. ✗ A set of symbols, showing different actions, is used to represent a flowchart. ✗ The symbols are also called components of flowcharts. ✗ We have a unique symbol corresponding to each action within a process. 7
  • 8.
    Symbols of Flowchart Start/end ✗ An oval represents a start or end point Arrows ✗ An arrow is used to show the sequence of the actions that are to be performed. Input / Output ✗ A parallelogram represents input or output Process ✗ A rectangle represents a process. A process is the core part of any solution procedure. It is a sequence of actions. Normally a process in computer is either arithmetic or logical operation. 8
  • 9.
    Symbols of Flowchart Decision ✗A diamond indicates a decision. It is used when we want to alter the normal sequence of the solution or when a specific statement needs to be executed based on the result of decision Connector ✗ A circle indicated a connector. Sometimes a flowchart may not fit into a single part or not possible to link two process. A connector can be used to join the two parts. 9
  • 10.
    Problem 1: Thefitting charge of tiles is Rs. 10 per square feet. Now assume that the problem is to find the total cost of fitting tiles on the rectangular shaped town hall floor 10 Start Input l,b Area = l*b Cost = Area * 10 Print Cost End
  • 11.
    If the costof fitting the tile changes, the below solution will work. Generalized solution 11 Start Input l,b,c Area = l*b Cost = Area * c Print Cost End
  • 12.
    12 Problem 2: supposeyou have a round cricket ground in your school. The authority wants to make the fencing surrounding this ground. They also want to cover the total surface with a lawn. The authority wants to know how many meters the total fencing will run into? They also want to know the total surface area of the ground that needs to be covered with lawn. Start Input r Area = 3.14*r*r Perimeter = 2 * 3.14 * r Print Area, Perimeter End
  • 13.
    Problem 3: Ms.Jhanvi has borrowed a loan of Rs. 35,000 at the rate of 11.5 % from a bank for 6 years. Calculate the simple interest. 13 Start Input p, r, n I = (p*r*n) /100 Print I End
  • 14.
    Problem 4: Assumethat you want to find out the youngest student amongst two students. The input in this case will be the age of the student. 14 Start Input age1, age2 Compare age1 & age2 Print both students have same age Print First student is youngest Print Second student is youngest End Age1 < Age2 Age1 > Age2 Age1 = Age2
  • 15.
    Start Input age1, age2, age3 Compare age1& age2 age1 = age3 age1 < age3 age1 = age2 age1 < age2 age2 < age3 age1 > age2 First student is youngest All student have same age yes Yes No Yes Third student is youngest Second student is youngest No No End
  • 16.
    Start Input max_no count=1 count =1 min=age Age< min count=count+1 No Yes Yes No count<= max_no Input age yes Print min End No Flowchart to find youngest of any number of students
  • 17.
    Start i=1, sum=0 sum=sum +i i=i+2 Is i<100 yes No Print sum End Flowchart to find Sum of first 50 odd numbers
  • 18.
    Flowchart to interchangevalues of two variables with extra variable Start Print “Enter two numbers” Input a, b temp =a a=b b=temp Print a, b End
  • 19.
    Flowchart to interchangevalues of two variables without extra variable Start Print “Enter two numbers” Input a, b a = a + b b= a-b a=a-b Print a, b End
  • 20.
    Advantages of flowchart 1.As it provides pictorial representation of the problem solution, it is easy to understand. 2. It provides a convenient aid for writing computer instructions. 3. It assists the programmer in reviewing and correcting the solution steps. 4. It helps in discussion of different methods for solving a problem. This is turn provides us a facility to compare them accurately.
  • 21.
    Disadvantages of flowchart 1.Drawing a flowchart for a large and complex problem is time consuming and laborious. 2. As a flowchart consists of symbols, any changes or modification in the program logic will most of the times require a new flowchart to be drawn. 3. There are no standards specifying the details of data that should be shown in a flowchart. Hence flowchart for a given problem although with similar logic may vary in terms of data shown.
  • 22.
    Algorithm  Algorithm refersto a step by step procedure for solving a particular problem.  An algorithm is written in a natural language like English.  Algorithm once written then can be easily converted into computer programs.
  • 23.
    Algorithm to findsummation of numbers divisible by 11 within the range of 1 to 100 1. Start 2. Take two variable num & sum 3. Initialize num=1 & sum=0 4. Check whether num is divisible by 11? Find the remainder when num is divided by 11 and store it in variable say x. x= num – int(num/11) *11 5. If x is not equal to 0 go to step 7 6. Sum = sum + num 7. Num = num + 1 8. If num < 100 go to step 4 9. Print sum 10. Exit
  • 24.
    Algorithm to findcompound interest 1. Start 2. Take four variables P,R,N and I 3. Assign values to P,N & R. 4. Calculate compound interest using I = P * (1+R/100)N –P 5. Print value stored in I 6. End
  • 25.
    Algorithm to findout the total weekly pay to be given to an employee based on the number of hours he/she has worked 1. Start 2. Take three variables no_of_hrs_worked, pay_per_hour and weekly_pay. 3. Assign value of no_of_hrs_worked & pay_per_hour 4. Calculate weekly pay weekly_pay = no_of_hrs_worked * pay_per_hour 5. Print value stored in weekly_pay 6. End
  • 26.
    Thanks! Any questions? You canfind me at: ✗ nuzhatmemon.com ✗ nuzhat.memon@gmail.com 26