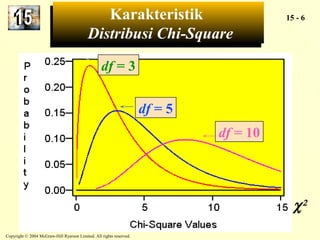
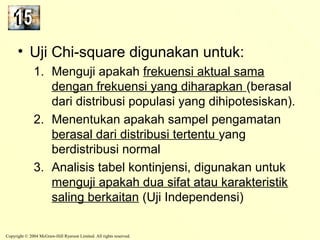
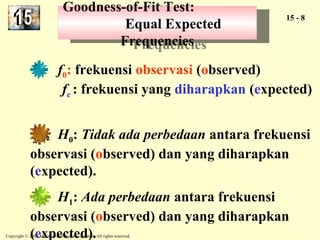
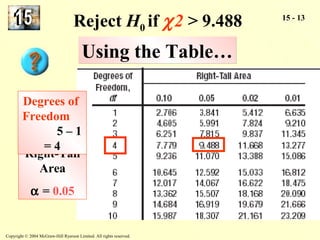
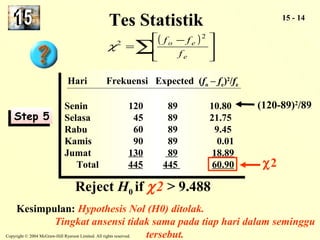
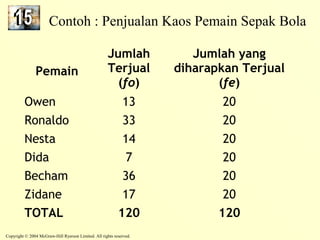
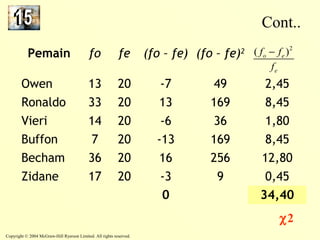
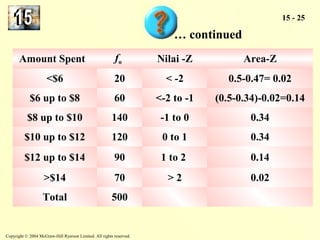
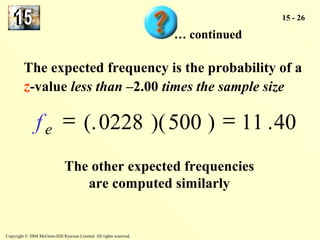
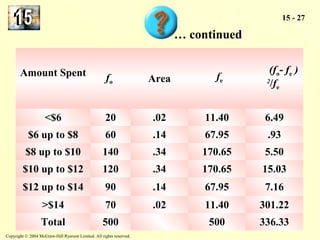
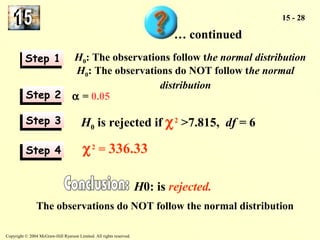
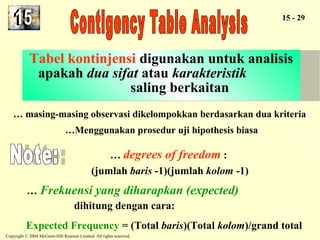
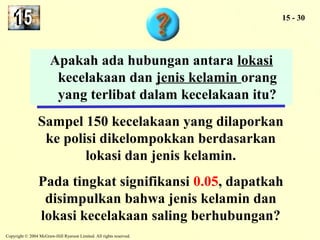
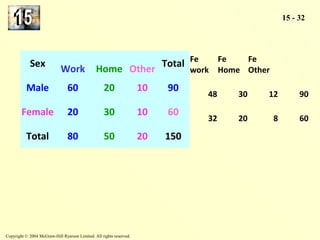
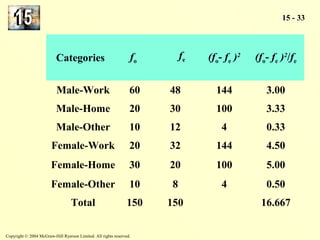
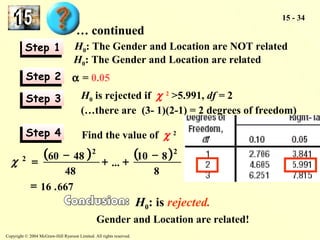
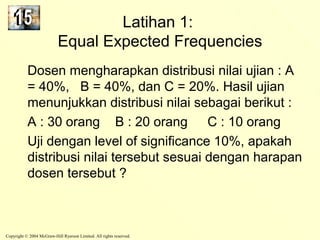
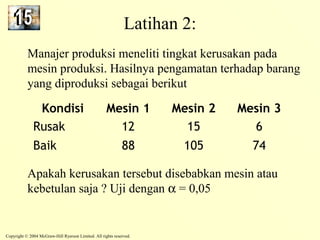
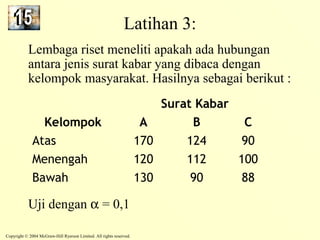
Copyright © 2004 McGraw-Hill Ryerson Limited. All rights reserved. 
15 - 1
When you have completed this chapter, you will be able to: 
Copyright © 2004 McGraw-Hill Ryerson Limited. All rights reserved. 
15 - 2 
Understand the nature and role of 
chi-square distribution 
Identify a wide variety of uses of 
the chi-square distribution 
Conduct a test of hypothesis comparing an 
observed frequency distribution to an 
expected frequency distribution
Conduct a test of hypothesis for normality 
using the chi-square distribution 
Copyright © 2004 McGraw-Hill Ryerson Limited. All rights reserved. 
15 - 3 
Conduct a hypothesis test to determine 
whether two attributes are 
independent
Copyright © 2004 McGraw-Hill Ryerson Limited. All rights reserved. 
15 - 4 
Sebelumnya: 
• skala pengukuran data: interval atau rasio 
• pengujian rata-rata, proporsi, varians populasi 
• mengasumsikan populasi mengikuti distribusi normal 
Metode Parametrik 
Sekarang, bagaimana dengan: 
• data skala pengukuran: nominal atau ordinal 
• asumsi tidak ada pada bentuk distribusi populasi 
Metode Non Parametrik 
Salah satu Metode Non Parametrik: Chi Square (c2 )
Karakteristik 
Karakteristik 15 - 5 
Distribusi Chi-Square 
… Menceng/menjulur ke kanan (positively 
skewed) 
… non-negatif 
… berdasarkan degrees of freedom 
… Ketika degrees of freedom berubah maka 
distribusi baru akan terbentuk 
Copyright © 2004 McGraw-Hill Ryerson Limited. All rights reserved. 
…e.g.
Karakteristik 
Distribusi Chi-Square 
Copyright © 2004 McGraw-Hill Ryerson Limited. All rights reserved. 
15 - 6 
df = 3 
df = 5 
df = 10 
c2 
Karakteristik 
Distribusi Chi-Square
• Uji Chi-square digunakan untuk: 
1. Menguji apakah frekuensi aktual sama 
dengan frekuensi yang diharapkan (berasal 
dari distribusi populasi yang dihipotesiskan). 
2. Menentukan apakah sampel pengamatan 
berasal dari distribusi tertentu yang 
berdistribusi normal 
3. Analisis tabel kontinjensi, digunakan untuk 
menguji apakah dua sifat atau karakteristik 
saling berkaitan (Uji Independensi) 
Copyright © 2004 McGraw-Hill Ryerson Limited. All rights reserved.
Goodness-of-Fit Test: 
15 - 8 Goodness-of-Fit Test: 
Equal Expected 
Frequencies 
Copyright © 2004 McGraw-Hill Ryerson Limited. All rights reserved. 
Equal Expected 
Frequencies 
f0: frekuensi observasi (observed) 
fe : frekuensi yang diharapkan (expected) 
H0: Tidak ada perbedaan antara frekuensi 
observasi (observed) dan yang diharapkan 
(expected). 
H1: Ada perbedaan antara frekuensi 
observasi (observed) dan yang diharapkan 
(expected).
Goodness-of-Fit Test: 
Equal Expected 
Frequencies 
Copyright © 2004 McGraw-Hill Ryerson Limited. All rights reserved. 
15 - 9 
Equal Expected 
Frequencies 
å ( ) ê êë 
é - 
= 
f f 2 
o e 
…Nilai kritis: nilai chi-square dengan 
degrees of freedom: k-1 , 
di mana k adalah jumlah kategori 
e 
f 
c 2 
ê êë 
é 
… Uji statistik:
Goodness-of-Fit Test: 
Equal Expected 
Frequencies 
Equal Expected 
Frequencies 
Hari Frekuensi 
Senin 120 
Selasa 45 
Rabu 60 
Kamis 90 
Jumat 130 
TOTAL 445 
Copyright © 2004 McGraw-Hill Ryerson Limited. All rights reserved. 
15 - 10 
Informasi berikut menunjukkan jumlah karyawan 
yang absen setiap hari dalam seminggu di sebuah pabrik. 
Hari Frekuensi 
Senin 120 
Selasa 45 
Rabu 60 
Kamis 90 
Jumat 130 
TOTAL 445 
Pada tingkat signifikansi 0.05, apakah ada 
perbedaan jumlah absensi per hari dalam 
seminggu tersebut?
Goodness-of-Fit Test: 
Equal Expected 
Frequencies 
Equal Expected 
Frequencies 
(120+45+60+90+130)/5 = 89 
Copyright © 2004 McGraw-Hill Ryerson Limited. All rights reserved. 
15 - 11 
H Hyyppootthheessisis T Teesstt 
SStteepp 11 
SStteepp 22 
SStteepp 33 
SStteepp 44 
H: Tidak ada perbedaan tingkat absensi per 
0hari dalam seminggu tersebut… 
H: Tingkat absensi per hari tidak semua sama 
1a = 0.05 
Use Chi-Square test 
Degrees of freedom (5-1) = 4 
Tolak Hjika c 2 > 
0 9.488 (dari tabel Chi-square) 
Chi-Square
Copyright © 2004 McGraw-Hill Ryerson Limited. All rights reserved. 
15 - 12
Reject H0 if c 2 > 9.488 
UUssiinngg tthhee TTaabbllee…… 
Degrees of 
Freedom 
5 – 1 
= 4 
Copyright © 2004 McGraw-Hill Ryerson Limited. All rights reserved. 
15 - 13 
Right-Tail 
Area 
a = 0.05
å( é f o úû 
ú - 
f ) 2 
ù 
e 
f 
Hari Frekuensi Expected (fo – fe)2/fe 
Senin 120 89 10.80 
Selasa 45 89 21.75 
Rabu 60 89 9.45 
Kamis 90 89 0.01 
Jumat 130 89 18.89 
Total 445 445 60.90 
Hari Frekuensi Expected (fo – fe)2/fe 
Senin 120 89 10.80 
Selasa 45 89 21.75 
Rabu 60 89 9.45 
Kamis 90 89 0.01 
Jumat 130 89 18.89 
Total 445 445 60.90 
Copyright © 2004 McGraw-Hill Ryerson Limited. All rights reserved. 
15 - 14 
== 11..9988 
ê êë 
= 
e 
c2 
c2 
Kesimpulan: Hypothesis Nol (H0) ditolak. 
Tingkat ansensi tidak sama pada tiap hari dalam seminggu 
tersebut. 
(120-89)2/89 
SStteepp 55 
Tes Statistik 
Reject H0 if c 2 > 9.488
Contoh : Penjualan Kaos Pemain Sepak Bola 
Pemain 
Jumlah 
Terjual 
(fo) 
Copyright © 2004 McGraw-Hill Ryerson Limited. All rights reserved. 
Jumlah yang 
diharapkan Terjual 
(fe) 
Owen 13 20 
Ronaldo 33 20 
Nesta 14 20 
Dida 7 20 
Becham 36 20 
Zidane 17 20 
TOTAL 120 120
Copyright © 2004 McGraw-Hill Ryerson Limited. All rights reserved. 
Cont.. 
Pemain fo fe (fo – fe) (fo – fe)2 
( )2 o e 
f - 
f 
f 
e 
Owen 13 20 -7 49 2,45 
Ronaldo 33 20 13 169 8,45 
Vieri 14 20 -6 36 1,80 
Buffon 7 20 -13 169 8,45 
Becham 36 20 16 256 12,80 
Zidane 17 20 -3 9 0,45 
0 34,40 
c2
Data Biro Sensus Amerika menunjukkan bahwa di Amerika Serikat: 
Married Widowed Divorced Single 
63.9% 7.7% 6.9% 21.5% 
Sample 500 orang dewasa dari Philadelphia menunjukkan: 
310 40 30 120 
Copyright © 2004 McGraw-Hill Ryerson Limited. All rights reserved. 
15 - 17 
Not re-married Never married 
Pada tingkat signifikansi 0.05, dapatkah disimpulkan 
bahwa area Philadelphia berbeda dengan Amerika 
Serikat secara keseluruahan?
Copyright © 2004 McGraw-Hill Ryerson Limited. All rights reserved. 
15 - 18 
… continued 
Expected (fo – fe)2/fe 
Married 310 *319.5 ** .2825 
Widowed 40 38.5 .0584 
Divorced 30 34.5 .5870 
Single 120 107.5 1.4535 
Total 500 2.3814 
c2 
* Census figures would predict: i.e. 639*500 = 319.5 
** Our sample: (310-319.5)2/319.5 = .2825
a = 0.05 
Copyright © 2004 McGraw-Hill Ryerson Limited. All rights reserved. 
15 - 19 
SStteepp 11 
SStteepp 22 
SStteepp 33 
SStteepp 44 
… continued 
H0: The distribution has not changed 
H1: The distribution has changed. 
H0 is rejected if 
c2 >7.815, df = 3 
c2 = 2.3814 
Reject the null hypothesis. 
The distribution regarding marital status in Philadelphia 
is different from the rest of the United States.
Goodness-of-Fit Test: 
Equal Expected Frequencies 
• Contoh : 
Dosen mengharapkan distribusi nilai ujian : A 
= 40%, B = 40%, dan C = 20%. Hasil ujian 
menunjukkan distribusi nilai sebagai berikut : 
A : 30 orang B : 20 orang C : 10 orang 
Uji dengan level of significance 10%, apakah 
distribusi nilai tersebut sesuai dengan harapan 
dosen tersebut ? 
Copyright © 2004 McGraw-Hill Ryerson Limited. All rights reserved.
Goodness-of-Fit Test: 
Goodness-of-Fit Test: 15 - 21 
…untuk menentukan rata-rata dan standar deviasi 
distribusi frekuensi 
Copyright © 2004 McGraw-Hill Ryerson Limited. All rights reserved. 
Normality 
Normality 
… tes ini menguji 
apakah frekuensi aktual (observed) 
pada sebuah distribusi frekuensi sesuai dengan 
distribusi normal. 
(1) Hitung nilai-z untuk batas bawah kelas dan 
batas atas kelas pada tiap kelas 
(2) Tentukan fe untuk setiap kategori. 
(3) Gunakan uji chi-square (goodness-of-fit test) 
untuk menentukan apakah fo sesuai dengan fe
Goodness-of-Fit Test: 
Copyright © 2004 McGraw-Hill Ryerson Limited. All rights reserved. 
15 - 22 
Normality 
Normality 
Sampel uang saku 500 siswa dilaporkan dalam 
distribusi frekuensi berikut ini 
Apakah dapat disimpulkan bahwa distribusinya 
normal dengan rata-rata $10 dan standar deviasi $2? 
 Gunakan tingkat signifikansi 0.05
Copyright © 2004 McGraw-Hill Ryerson Limited. All rights reserved. 
15 - 23 
Uang saku fo Nilai Z Area-Z 
fe 
(fo- fe ) 
2/fe 
<$6 20 
$6 up to $8 60 
$8 up to $10 140 
$10 up to 
$12 120 
$12 up to 
$14 90 
>$14 70 
Total 500 
… continued
z X - 
m 
= 
s 
Copyright © 2004 McGraw-Hill Ryerson Limited. All rights reserved. 
15 - 24 
… continued 
To compute fe for the first class, 
first 
determine the - 
z - value 
6 10 = - 
2 
= 
Now… 
2 . 00 
find the probability of a z - value less than –2.00 
P(z < -2.00) = 0.5000-.4772= .0228
Copyright © 2004 McGraw-Hill Ryerson Limited. All rights reserved. 
15 - 25 
… continued 
Amount Spent fo Nilai -Z Area-Z 
<$6 20 < -2 0.5-0.47= 0.02 
$6 up to $8 60 <-2 to -1 (0.5-0.34)-0.02=0.14 
$8 up to $10 140 -1 to 0 0.34 
$10 up to $12 120 0 to 1 0.34 
$12 up to $14 90 1 to 2 0.14 
>$14 70 > 2 0.02 
Total 500
f e = (.0228 )(500 ) = 11 .40 
Copyright © 2004 McGraw-Hill Ryerson Limited. All rights reserved. 
15 - 26 
… continued 
The expected frequency is the probability of a 
z-value less than –2.00 times the sample size 
The other expected frequencies 
are computed similarly
Copyright © 2004 McGraw-Hill Ryerson Limited. All rights reserved. 
15 - 27 
Amount Spent 
fo Area 
… continued 
fe 
(fo- fe ) 
2/fe 
<$6 20 .02 11.40 6.49 
$6 up to $8 60 .14 67.95 .93 
$8 up to $10 140 .34 170.65 5.50 
$10 up to $12 120 .34 170.65 15.03 
$12 up to $14 90 .14 67.95 7.16 
>$14 70 .02 11.40 301.22 
Total 500 500 336.33
H0: The observations do NOT follow the normal 
a = 0.05 
Copyright © 2004 McGraw-Hill Ryerson Limited. All rights reserved. 
15 - 28 
… continued 
SStteepp 11 
SStteepp 22 
SStteepp 33 
SStteepp 44 
H0: The observations follow the normal distribution 
distribution 
H0 is rejected if c2 >7.815, df = 6 
c2 = 336.33 
H0: is rejected. 
The observations do NOT follow the normal distribution
Tabel kontinjensi digunakan untuk analisis 
apakah dua sifat atau karakteristik 
… masing-masing observasi dikelompokkan berdasarkan dua kriteria 
…Menggunakan prosedur uji hipothesis biasa 
… degrees of freedom : 
(jumlah baris -1)(jumlah kolom -1) 
Copyright © 2004 McGraw-Hill Ryerson Limited. All rights reserved. 
15 - 29 
Tabel kontinjensi digunakan untuk analisis 
apakah dua sifat atau karakteristik 
saling berkaitan 
saling berkaitan 
… Frekuensi yang diharapkan (expected) 
dihitung dengan cara: 
Expected Frequency = (Total baris)(Total kolom)/grand total
Copyright © 2004 McGraw-Hill Ryerson Limited. All rights reserved. 
15 - 30 
Apakah ada hubungan antara lokasi 
kecelakaan dan jenis kelamin orang 
yang terlibat dalam kecelakaan itu? 
Sampel 150 kecelakaan yang dilaporkan 
ke polisi dikelompokkan berdasarkan 
lokasi dan jenis kelamin. 
Pada tingkat signifikansi 0.05, dapatkah 
disimpulkan bahwa jenis kelamin dan 
lokasi kecelakaan saling berhubungan?
Copyright © 2004 McGraw-Hill Ryerson Limited. All rights reserved. 
15 - 31 
… continued 
Sex 
Location 
Work Home Other 
Total 
Male 60 20 10 90 
Female 20 30 10 60 
Total 80 50 20 150 
Frekuensi yang diharapkan (expected) untuk 
kombinasi work-male dihitung dengan cara: (90) 
(80)/150 =48 
Expected frequencies untuk yang lain bisa dihitung 
dengan cara yang sama.
Copyright © 2004 McGraw-Hill Ryerson Limited. All rights reserved. 
15 - 32 
Sex Work Home Other Total Fe 
work 
Fe 
Home 
Fe 
Other 
Male 60 20 10 90 
48 30 12 90 
Female 20 30 10 60 
32 20 8 60 
Total 80 50 20 150
Copyright © 2004 McGraw-Hill Ryerson Limited. All rights reserved. 
15 - 33 
Categories fo 
fe 
(fo- fe )2 (fo- fe )2/fe 
Male-Work 60 48 144 3.00 
Male-Home 20 30 100 3.33 
Male-Other 10 12 4 0.33 
Female-Work 20 32 144 4.50 
Female-Home 30 20 100 5.00 
Female-Other 10 8 4 0.50 
Total 150 150 16.667
H0: The Gender and Location are related 
a = 0.05 
(…there are (3- 1)(2-1) = 2 degrees of freedom) 
Find the value of c 2 
( ) ( ) 
60 48 2 2 
c 2 = - + + - 
... 10 8 
Copyright © 2004 McGraw-Hill Ryerson Limited. All rights reserved. 
15 - 34 
SStteepp 11 
SStteepp 22 
SStteepp 33 
SStteepp 44 
H0: The Gender and Location are NOT related 
H0 is rejected if c 2 >5.991, df = 2 
8 
H0: is rejected. 
Gender and Location are related! 
48 
… continued 
= 16 .667
Latihan 1: 
Equal Expected Frequencies 
Dosen mengharapkan distribusi nilai ujian : A 
= 40%, B = 40%, dan C = 20%. Hasil ujian 
menunjukkan distribusi nilai sebagai berikut : 
A : 30 orang B : 20 orang C : 10 orang 
Uji dengan level of significance 10%, apakah 
distribusi nilai tersebut sesuai dengan harapan 
dosen tersebut ? 
Copyright © 2004 McGraw-Hill Ryerson Limited. All rights reserved.
Latihan 2: 
Manajer produksi meneliti tingkat kerusakan pada 
mesin produksi. Hasilnya pengamatan terhadap barang 
yang diproduksi sebagai berikut 
Kondisi Mesin 1 Mesin 2 Mesin 3 
Rusak 12 15 6 
Baik 88 105 74 
Apakah kerusakan tersebut disebabkan mesin atau 
kebetulan saja ? Uji dengan a = 0,05 
Copyright © 2004 McGraw-Hill Ryerson Limited. All rights reserved.
Latihan 3: 
Lembaga riset meneliti apakah ada hubungan 
antara jenis surat kabar yang dibaca dengan 
kelompok masyarakat. Hasilnya sebagai berikut : 
Uji dengan a = 0,1 
Copyright © 2004 McGraw-Hill Ryerson Limited. All rights reserved. 
Surat Kabar 
Kelompok A B C 
Atas 170 124 90 
Menengah 120 112 100 
Bawah 130 90 88
TTeesstt yyoouurr lleeaarrnniinngg…… 15 - 38 
Click on… Click on… 
www.mcgrawhill.ca/college/lind 
Online Learning Centre 
for quizzes 
extra content 
data sets 
searchable glossary 
access to Statistics Canada’s E-Stat data 
…and much more! 
Copyright © 2004 McGraw-Hill Ryerson Limited. All rights reserved.
Copyright © 2004 McGraw-Hill Ryerson Limited. All rights reserved. 
15 - 39 
TThhisis c coommppleletetess C Chhaappteterr 1 155

Statistik 1 11 15 edited_chi square

  • 1.
    Copyright © 2004McGraw-Hill Ryerson Limited. All rights reserved. 15 - 1
  • 2.
    When you havecompleted this chapter, you will be able to: Copyright © 2004 McGraw-Hill Ryerson Limited. All rights reserved. 15 - 2 Understand the nature and role of chi-square distribution Identify a wide variety of uses of the chi-square distribution Conduct a test of hypothesis comparing an observed frequency distribution to an expected frequency distribution
  • 3.
    Conduct a testof hypothesis for normality using the chi-square distribution Copyright © 2004 McGraw-Hill Ryerson Limited. All rights reserved. 15 - 3 Conduct a hypothesis test to determine whether two attributes are independent
  • 4.
    Copyright © 2004McGraw-Hill Ryerson Limited. All rights reserved. 15 - 4 Sebelumnya: • skala pengukuran data: interval atau rasio • pengujian rata-rata, proporsi, varians populasi • mengasumsikan populasi mengikuti distribusi normal Metode Parametrik Sekarang, bagaimana dengan: • data skala pengukuran: nominal atau ordinal • asumsi tidak ada pada bentuk distribusi populasi Metode Non Parametrik Salah satu Metode Non Parametrik: Chi Square (c2 )
  • 5.
    Karakteristik Karakteristik 15- 5 Distribusi Chi-Square Distribusi Chi-Square … Menceng/menjulur ke kanan (positively skewed) … non-negatif … berdasarkan degrees of freedom … Ketika degrees of freedom berubah maka distribusi baru akan terbentuk Copyright © 2004 McGraw-Hill Ryerson Limited. All rights reserved. …e.g.
  • 6.
    Karakteristik Distribusi Chi-Square Copyright © 2004 McGraw-Hill Ryerson Limited. All rights reserved. 15 - 6 df = 3 df = 5 df = 10 c2 Karakteristik Distribusi Chi-Square
  • 7.
    • Uji Chi-squaredigunakan untuk: 1. Menguji apakah frekuensi aktual sama dengan frekuensi yang diharapkan (berasal dari distribusi populasi yang dihipotesiskan). 2. Menentukan apakah sampel pengamatan berasal dari distribusi tertentu yang berdistribusi normal 3. Analisis tabel kontinjensi, digunakan untuk menguji apakah dua sifat atau karakteristik saling berkaitan (Uji Independensi) Copyright © 2004 McGraw-Hill Ryerson Limited. All rights reserved.
  • 8.
    Goodness-of-Fit Test: 15- 8 Goodness-of-Fit Test: Equal Expected Frequencies Copyright © 2004 McGraw-Hill Ryerson Limited. All rights reserved. Equal Expected Frequencies f0: frekuensi observasi (observed) fe : frekuensi yang diharapkan (expected) H0: Tidak ada perbedaan antara frekuensi observasi (observed) dan yang diharapkan (expected). H1: Ada perbedaan antara frekuensi observasi (observed) dan yang diharapkan (expected).
  • 9.
    Goodness-of-Fit Test: Goodness-of-FitTest: Equal Expected Frequencies Copyright © 2004 McGraw-Hill Ryerson Limited. All rights reserved. 15 - 9 Equal Expected Frequencies å ( ) ê êë é - = f f 2 o e …Nilai kritis: nilai chi-square dengan degrees of freedom: k-1 , di mana k adalah jumlah kategori e f c 2 ê êë é … Uji statistik:
  • 10.
    Goodness-of-Fit Test: Goodness-of-FitTest: Equal Expected Frequencies Equal Expected Frequencies Hari Frekuensi Senin 120 Selasa 45 Rabu 60 Kamis 90 Jumat 130 TOTAL 445 Copyright © 2004 McGraw-Hill Ryerson Limited. All rights reserved. 15 - 10 Informasi berikut menunjukkan jumlah karyawan yang absen setiap hari dalam seminggu di sebuah pabrik. Hari Frekuensi Senin 120 Selasa 45 Rabu 60 Kamis 90 Jumat 130 TOTAL 445 Pada tingkat signifikansi 0.05, apakah ada perbedaan jumlah absensi per hari dalam seminggu tersebut?
  • 11.
    Goodness-of-Fit Test: Goodness-of-FitTest: Equal Expected Frequencies Equal Expected Frequencies (120+45+60+90+130)/5 = 89 Copyright © 2004 McGraw-Hill Ryerson Limited. All rights reserved. 15 - 11 H Hyyppootthheessisis T Teesstt SStteepp 11 SStteepp 22 SStteepp 33 SStteepp 44 H: Tidak ada perbedaan tingkat absensi per 0hari dalam seminggu tersebut… H: Tingkat absensi per hari tidak semua sama 1a = 0.05 Use Chi-Square test Degrees of freedom (5-1) = 4 Tolak Hjika c 2 > 0 9.488 (dari tabel Chi-square) Chi-Square
  • 12.
    Copyright © 2004McGraw-Hill Ryerson Limited. All rights reserved. 15 - 12
  • 13.
    Reject H0 ifc 2 > 9.488 UUssiinngg tthhee TTaabbllee…… Degrees of Freedom 5 – 1 = 4 Copyright © 2004 McGraw-Hill Ryerson Limited. All rights reserved. 15 - 13 Right-Tail Area a = 0.05
  • 14.
    å( é fo úû ú - f ) 2 ù e f Hari Frekuensi Expected (fo – fe)2/fe Senin 120 89 10.80 Selasa 45 89 21.75 Rabu 60 89 9.45 Kamis 90 89 0.01 Jumat 130 89 18.89 Total 445 445 60.90 Hari Frekuensi Expected (fo – fe)2/fe Senin 120 89 10.80 Selasa 45 89 21.75 Rabu 60 89 9.45 Kamis 90 89 0.01 Jumat 130 89 18.89 Total 445 445 60.90 Copyright © 2004 McGraw-Hill Ryerson Limited. All rights reserved. 15 - 14 == 11..9988 ê êë = e c2 c2 Kesimpulan: Hypothesis Nol (H0) ditolak. Tingkat ansensi tidak sama pada tiap hari dalam seminggu tersebut. (120-89)2/89 SStteepp 55 Tes Statistik Reject H0 if c 2 > 9.488
  • 15.
    Contoh : PenjualanKaos Pemain Sepak Bola Pemain Jumlah Terjual (fo) Copyright © 2004 McGraw-Hill Ryerson Limited. All rights reserved. Jumlah yang diharapkan Terjual (fe) Owen 13 20 Ronaldo 33 20 Nesta 14 20 Dida 7 20 Becham 36 20 Zidane 17 20 TOTAL 120 120
  • 16.
    Copyright © 2004McGraw-Hill Ryerson Limited. All rights reserved. Cont.. Pemain fo fe (fo – fe) (fo – fe)2 ( )2 o e f - f f e Owen 13 20 -7 49 2,45 Ronaldo 33 20 13 169 8,45 Vieri 14 20 -6 36 1,80 Buffon 7 20 -13 169 8,45 Becham 36 20 16 256 12,80 Zidane 17 20 -3 9 0,45 0 34,40 c2
  • 17.
    Data Biro SensusAmerika menunjukkan bahwa di Amerika Serikat: Married Widowed Divorced Single 63.9% 7.7% 6.9% 21.5% Sample 500 orang dewasa dari Philadelphia menunjukkan: 310 40 30 120 Copyright © 2004 McGraw-Hill Ryerson Limited. All rights reserved. 15 - 17 Not re-married Never married Pada tingkat signifikansi 0.05, dapatkah disimpulkan bahwa area Philadelphia berbeda dengan Amerika Serikat secara keseluruahan?
  • 18.
    Copyright © 2004McGraw-Hill Ryerson Limited. All rights reserved. 15 - 18 … continued Expected (fo – fe)2/fe Married 310 *319.5 ** .2825 Widowed 40 38.5 .0584 Divorced 30 34.5 .5870 Single 120 107.5 1.4535 Total 500 2.3814 c2 * Census figures would predict: i.e. 639*500 = 319.5 ** Our sample: (310-319.5)2/319.5 = .2825
  • 19.
    a = 0.05 Copyright © 2004 McGraw-Hill Ryerson Limited. All rights reserved. 15 - 19 SStteepp 11 SStteepp 22 SStteepp 33 SStteepp 44 … continued H0: The distribution has not changed H1: The distribution has changed. H0 is rejected if c2 >7.815, df = 3 c2 = 2.3814 Reject the null hypothesis. The distribution regarding marital status in Philadelphia is different from the rest of the United States.
  • 20.
    Goodness-of-Fit Test: EqualExpected Frequencies • Contoh : Dosen mengharapkan distribusi nilai ujian : A = 40%, B = 40%, dan C = 20%. Hasil ujian menunjukkan distribusi nilai sebagai berikut : A : 30 orang B : 20 orang C : 10 orang Uji dengan level of significance 10%, apakah distribusi nilai tersebut sesuai dengan harapan dosen tersebut ? Copyright © 2004 McGraw-Hill Ryerson Limited. All rights reserved.
  • 21.
    Goodness-of-Fit Test: Goodness-of-FitTest: 15 - 21 …untuk menentukan rata-rata dan standar deviasi distribusi frekuensi Copyright © 2004 McGraw-Hill Ryerson Limited. All rights reserved. Normality Normality … tes ini menguji apakah frekuensi aktual (observed) pada sebuah distribusi frekuensi sesuai dengan distribusi normal. (1) Hitung nilai-z untuk batas bawah kelas dan batas atas kelas pada tiap kelas (2) Tentukan fe untuk setiap kategori. (3) Gunakan uji chi-square (goodness-of-fit test) untuk menentukan apakah fo sesuai dengan fe
  • 22.
    Goodness-of-Fit Test: Goodness-of-FitTest: Copyright © 2004 McGraw-Hill Ryerson Limited. All rights reserved. 15 - 22 Normality Normality Sampel uang saku 500 siswa dilaporkan dalam distribusi frekuensi berikut ini Apakah dapat disimpulkan bahwa distribusinya normal dengan rata-rata $10 dan standar deviasi $2?  Gunakan tingkat signifikansi 0.05
  • 23.
    Copyright © 2004McGraw-Hill Ryerson Limited. All rights reserved. 15 - 23 Uang saku fo Nilai Z Area-Z fe (fo- fe ) 2/fe <$6 20 $6 up to $8 60 $8 up to $10 140 $10 up to $12 120 $12 up to $14 90 >$14 70 Total 500 … continued
  • 24.
    z X - m = s Copyright © 2004 McGraw-Hill Ryerson Limited. All rights reserved. 15 - 24 … continued To compute fe for the first class, first determine the - z - value 6 10 = - 2 = Now… 2 . 00 find the probability of a z - value less than –2.00 P(z < -2.00) = 0.5000-.4772= .0228
  • 25.
    Copyright © 2004McGraw-Hill Ryerson Limited. All rights reserved. 15 - 25 … continued Amount Spent fo Nilai -Z Area-Z <$6 20 < -2 0.5-0.47= 0.02 $6 up to $8 60 <-2 to -1 (0.5-0.34)-0.02=0.14 $8 up to $10 140 -1 to 0 0.34 $10 up to $12 120 0 to 1 0.34 $12 up to $14 90 1 to 2 0.14 >$14 70 > 2 0.02 Total 500
  • 26.
    f e =(.0228 )(500 ) = 11 .40 Copyright © 2004 McGraw-Hill Ryerson Limited. All rights reserved. 15 - 26 … continued The expected frequency is the probability of a z-value less than –2.00 times the sample size The other expected frequencies are computed similarly
  • 27.
    Copyright © 2004McGraw-Hill Ryerson Limited. All rights reserved. 15 - 27 Amount Spent fo Area … continued fe (fo- fe ) 2/fe <$6 20 .02 11.40 6.49 $6 up to $8 60 .14 67.95 .93 $8 up to $10 140 .34 170.65 5.50 $10 up to $12 120 .34 170.65 15.03 $12 up to $14 90 .14 67.95 7.16 >$14 70 .02 11.40 301.22 Total 500 500 336.33
  • 28.
    H0: The observationsdo NOT follow the normal a = 0.05 Copyright © 2004 McGraw-Hill Ryerson Limited. All rights reserved. 15 - 28 … continued SStteepp 11 SStteepp 22 SStteepp 33 SStteepp 44 H0: The observations follow the normal distribution distribution H0 is rejected if c2 >7.815, df = 6 c2 = 336.33 H0: is rejected. The observations do NOT follow the normal distribution
  • 29.
    Tabel kontinjensi digunakanuntuk analisis apakah dua sifat atau karakteristik … masing-masing observasi dikelompokkan berdasarkan dua kriteria …Menggunakan prosedur uji hipothesis biasa … degrees of freedom : (jumlah baris -1)(jumlah kolom -1) Copyright © 2004 McGraw-Hill Ryerson Limited. All rights reserved. 15 - 29 Tabel kontinjensi digunakan untuk analisis apakah dua sifat atau karakteristik saling berkaitan saling berkaitan … Frekuensi yang diharapkan (expected) dihitung dengan cara: Expected Frequency = (Total baris)(Total kolom)/grand total
  • 30.
    Copyright © 2004McGraw-Hill Ryerson Limited. All rights reserved. 15 - 30 Apakah ada hubungan antara lokasi kecelakaan dan jenis kelamin orang yang terlibat dalam kecelakaan itu? Sampel 150 kecelakaan yang dilaporkan ke polisi dikelompokkan berdasarkan lokasi dan jenis kelamin. Pada tingkat signifikansi 0.05, dapatkah disimpulkan bahwa jenis kelamin dan lokasi kecelakaan saling berhubungan?
  • 31.
    Copyright © 2004McGraw-Hill Ryerson Limited. All rights reserved. 15 - 31 … continued Sex Location Work Home Other Total Male 60 20 10 90 Female 20 30 10 60 Total 80 50 20 150 Frekuensi yang diharapkan (expected) untuk kombinasi work-male dihitung dengan cara: (90) (80)/150 =48 Expected frequencies untuk yang lain bisa dihitung dengan cara yang sama.
  • 32.
    Copyright © 2004McGraw-Hill Ryerson Limited. All rights reserved. 15 - 32 Sex Work Home Other Total Fe work Fe Home Fe Other Male 60 20 10 90 48 30 12 90 Female 20 30 10 60 32 20 8 60 Total 80 50 20 150
  • 33.
    Copyright © 2004McGraw-Hill Ryerson Limited. All rights reserved. 15 - 33 Categories fo fe (fo- fe )2 (fo- fe )2/fe Male-Work 60 48 144 3.00 Male-Home 20 30 100 3.33 Male-Other 10 12 4 0.33 Female-Work 20 32 144 4.50 Female-Home 30 20 100 5.00 Female-Other 10 8 4 0.50 Total 150 150 16.667
  • 34.
    H0: The Genderand Location are related a = 0.05 (…there are (3- 1)(2-1) = 2 degrees of freedom) Find the value of c 2 ( ) ( ) 60 48 2 2 c 2 = - + + - ... 10 8 Copyright © 2004 McGraw-Hill Ryerson Limited. All rights reserved. 15 - 34 SStteepp 11 SStteepp 22 SStteepp 33 SStteepp 44 H0: The Gender and Location are NOT related H0 is rejected if c 2 >5.991, df = 2 8 H0: is rejected. Gender and Location are related! 48 … continued = 16 .667
  • 35.
    Latihan 1: EqualExpected Frequencies Dosen mengharapkan distribusi nilai ujian : A = 40%, B = 40%, dan C = 20%. Hasil ujian menunjukkan distribusi nilai sebagai berikut : A : 30 orang B : 20 orang C : 10 orang Uji dengan level of significance 10%, apakah distribusi nilai tersebut sesuai dengan harapan dosen tersebut ? Copyright © 2004 McGraw-Hill Ryerson Limited. All rights reserved.
  • 36.
    Latihan 2: Manajerproduksi meneliti tingkat kerusakan pada mesin produksi. Hasilnya pengamatan terhadap barang yang diproduksi sebagai berikut Kondisi Mesin 1 Mesin 2 Mesin 3 Rusak 12 15 6 Baik 88 105 74 Apakah kerusakan tersebut disebabkan mesin atau kebetulan saja ? Uji dengan a = 0,05 Copyright © 2004 McGraw-Hill Ryerson Limited. All rights reserved.
  • 37.
    Latihan 3: Lembagariset meneliti apakah ada hubungan antara jenis surat kabar yang dibaca dengan kelompok masyarakat. Hasilnya sebagai berikut : Uji dengan a = 0,1 Copyright © 2004 McGraw-Hill Ryerson Limited. All rights reserved. Surat Kabar Kelompok A B C Atas 170 124 90 Menengah 120 112 100 Bawah 130 90 88
  • 38.
    TTeesstt yyoouurr lleeaarrnniinngg……15 - 38 Click on… Click on… www.mcgrawhill.ca/college/lind Online Learning Centre for quizzes extra content data sets searchable glossary access to Statistics Canada’s E-Stat data …and much more! Copyright © 2004 McGraw-Hill Ryerson Limited. All rights reserved.
  • 39.
    Copyright © 2004McGraw-Hill Ryerson Limited. All rights reserved. 15 - 39 TThhisis c coommppleletetess C Chhaappteterr 1 155