Downloaded 29 times

![State University DC Network Assessment March 2013
_____________________________________________________________________________________
_____________________________________________________________________________________
41
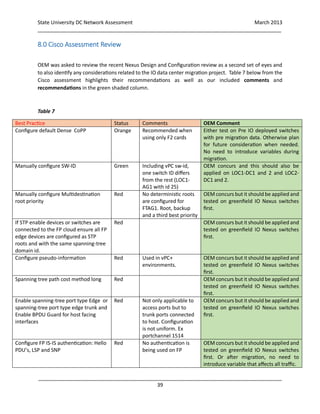
Configuration
Suggestion section.
ongoing administration and
troubleshooting. Ensures STATE
UNIVERSITY is more efficient working
from one standard set of configurations
or configuration profiles. Configuration
profiles can be defined in infrastructure
components for reuse. Improves
consistency and efficiency of
administration.
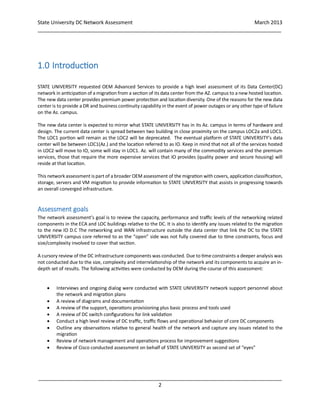
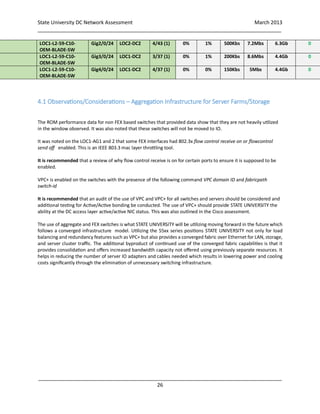
Cisco recommends using static switch-ids when configuring the FabricPath switches. This scheme gives
STATE UNIVERSITY deterministic and meaningful values that should aid to the operation and
troubleshooting of the FabricPath network.
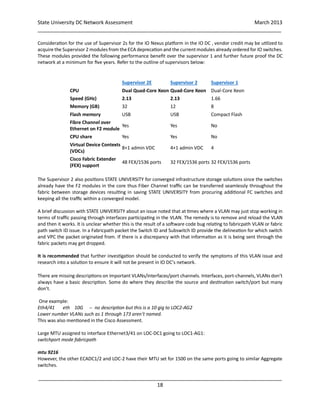
OEM concurs with Cisco’s assessment and recommendation of VDC usage. Refer to page 18 of the ARIZONA
STATE UNIVERSITY Nexus Design Review.
In addition consideration towards the use of a network management VDC to separate the management
plane traffic from production and add flexibility in administration of the management systems without
affecting production.
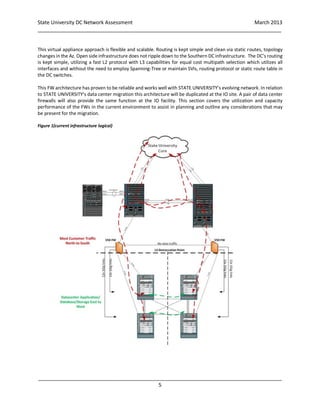
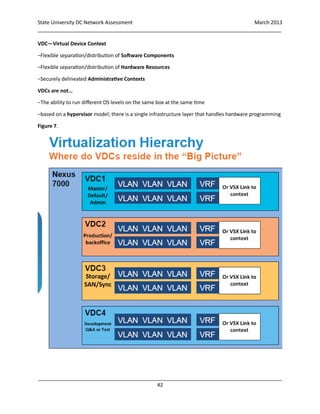
The use of VDC follows in line with a converged infrastructure model. Separation of traffic logically for
performance,scaling and flexible managementof traffic flows especially for VM mobility utilizing a physical
converged infrastructure platform. Some examples are an Admin VDC/Management VDC, Production
traffic VDC, Storage VDC, Test QA VDC. Refer to figure 7.
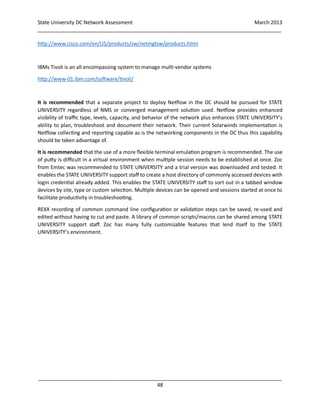
OEM concurs with switch-ids especially when future testing and troubleshooting commands will identify Fabricpath
routes based on Switch-ID value.
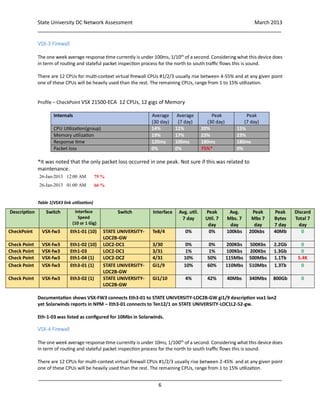
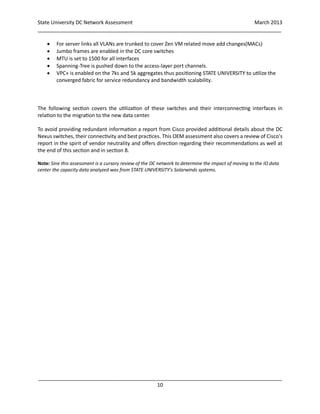
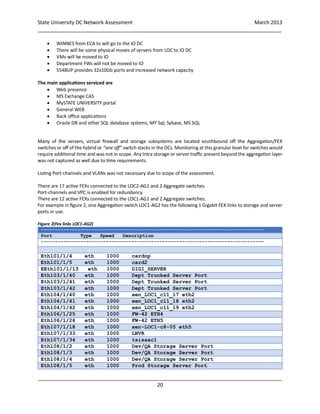
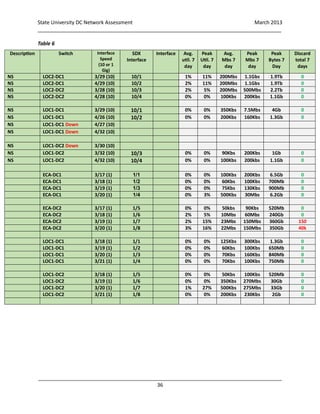
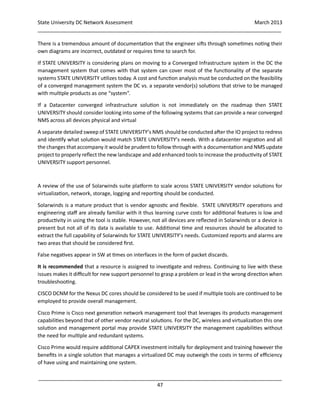
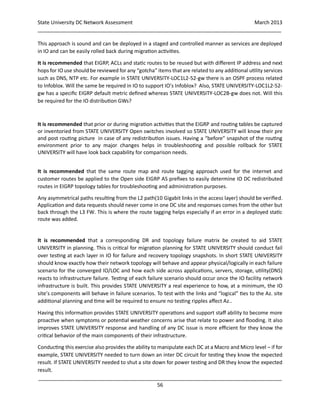
From the following Fabricpath route table we can now determine route vector details.
FabricPath Unicast Route Table
'a/b/c' denotes ftag/switch-id/subswitch-id – Keep in mind that subswitch-id refers to VPC+ routed packets.
'[x/y]' denotes [admin distance/metric]
1/2/0, number of next-hops: 2
via Eth3/46, [115/80], 54 day/s 08:06:25, isis_fabricpath-default
via Eth4/43, [115/80], 26 day/s 09:46:22, isis_fabricpath-default
0/1/12, number of next-hops: 1
via Po6, [80/0], 54 day/s 09:04:17, vpcm](https://image.slidesharecdn.com/stateunivdcassessment-150818190503-lva1-app6891/85/State-Univeristy-Data-Center-Assessment-42-320.jpg)
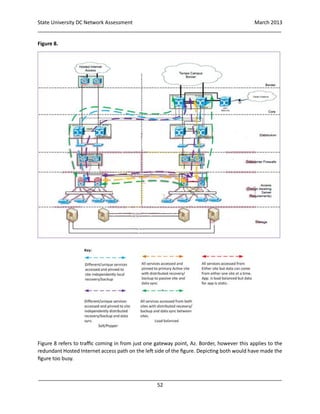
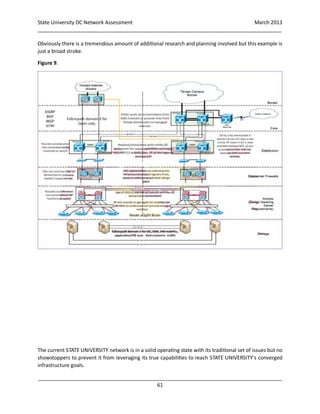

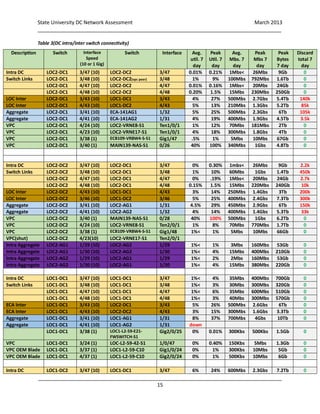
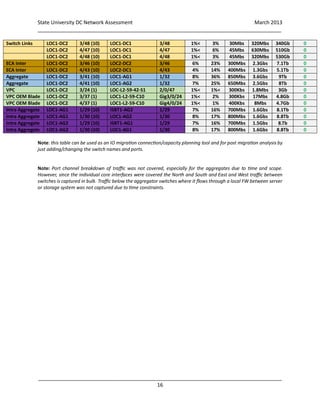
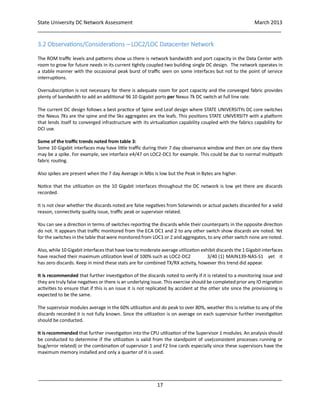
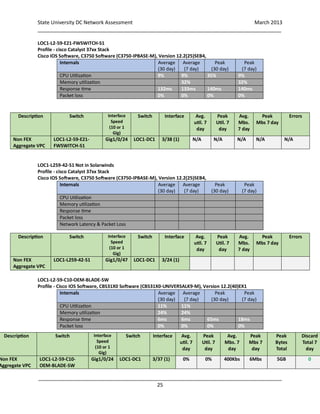
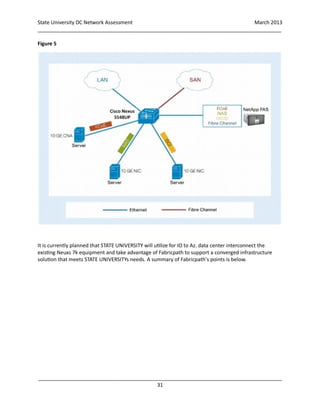
This document provides a high-level assessment of State University's data center network in anticipation of migrating parts of the data center to a new hosted location. It analyzes the firewalls, data center network infrastructure, aggregation switches, NetApp storage, NetScaler appliances, and DNS. Observations are outlined for each component along with considerations and recommendations for migrating to the new data center location. The assessment is intended to assist State University in planning the migration and progressing towards a converged infrastructure.