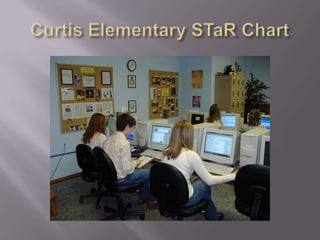
Curtis Elementary STaR Chart
AgendaPurpose of the STaR ChartState Requirements for TechnologyKey Areas Measured DataStrengths and WeaknessesSummary
Purpose of the STaR ChartLong-Range Plan for Technology, 2006-2020.The Texas Campus STaR Chart is a tool designed for use in technology planning, budgeting for resources, and evaluation    of progress in local technology projects.
Statewide RequirementsNo Child Left Behind, Title II, Part DAll teachers should be technology literate and integrate technology across the curriculum.All students should be technology literate by the time they leave eighth grade.
STaR Charthttp://starchart.esc12.net/docs/TxCSC.pdf
Curtis STaR Chart Datahttp://starchart2.esc12.net/campusSearchlist.aspx?foryear=20082009&district=weatherford&campus=curtis
Key Area I:  Teaching and Learning	Patterns of Classroom UseFrequency/Design of Instructional SettingContent Area ConnectionsTechnology Applications (TA) TEKS ImplementationStudent Mastery of Technology ApplicationsOnline Learning
Key Area II:  Educator Preparation and DevelopmentProfessional Development ExperiencesModels of Professional DevelopmentCapabilities of EducatorsAccess to Professional DevelopmentLevels of Understanding and Patterns of UseProfessional Development for Online Learning
Key Area III:  Leadership, Administration and Instructional SupportLeadership and VisionPlanningInstructional SupportCommunication and CollaborationBudgetLeadership ad Support for Online Learning
Key Area IV:  Infrastructure for TechnologyStudents per ComputerInternet Access Connectivity SpeedOther Classroom TechnologyTechnical SupportLocal Area Network Wide Area NetworkDistance Learning Capacity
Curtis STaR ChartKey Area SummaryKey Area 1: Teaching and Learning
Campus StrengthsStrengthsInfrastructure for TechnologyInternet Access Connectivity SpeedTechnical SupportLocal Area Network Wide Area NetworkTeaching and Learning
Campus Areas of ImprovementTeaching and LearningContent Area Connections and Patterns of UseEducator Preparation and DevelopmentProfessional Development for Online LearningProfessional Development ExperiencesCapabilities of Educators
SummaryThe STaR chart measures the level of proficiency in technology.The STaR chart provides information for areas of improvement.Aligned to the Long Range Plan for Technology

Star Chart Presentation

  • 1.
  • 2.
    AgendaPurpose of theSTaR ChartState Requirements for TechnologyKey Areas Measured DataStrengths and WeaknessesSummary
  • 3.
    Purpose of theSTaR ChartLong-Range Plan for Technology, 2006-2020.The Texas Campus STaR Chart is a tool designed for use in technology planning, budgeting for resources, and evaluation of progress in local technology projects.
  • 4.
    Statewide RequirementsNo ChildLeft Behind, Title II, Part DAll teachers should be technology literate and integrate technology across the curriculum.All students should be technology literate by the time they leave eighth grade.
  • 5.
  • 6.
    Curtis STaR ChartDatahttp://starchart2.esc12.net/campusSearchlist.aspx?foryear=20082009&district=weatherford&campus=curtis
  • 7.
    Key Area I: Teaching and Learning Patterns of Classroom UseFrequency/Design of Instructional SettingContent Area ConnectionsTechnology Applications (TA) TEKS ImplementationStudent Mastery of Technology ApplicationsOnline Learning
  • 8.
    Key Area II: Educator Preparation and DevelopmentProfessional Development ExperiencesModels of Professional DevelopmentCapabilities of EducatorsAccess to Professional DevelopmentLevels of Understanding and Patterns of UseProfessional Development for Online Learning
  • 9.
    Key Area III: Leadership, Administration and Instructional SupportLeadership and VisionPlanningInstructional SupportCommunication and CollaborationBudgetLeadership ad Support for Online Learning
  • 10.
    Key Area IV: Infrastructure for TechnologyStudents per ComputerInternet Access Connectivity SpeedOther Classroom TechnologyTechnical SupportLocal Area Network Wide Area NetworkDistance Learning Capacity
  • 11.
    Curtis STaR ChartKeyArea SummaryKey Area 1: Teaching and Learning
  • 12.
    Campus StrengthsStrengthsInfrastructure forTechnologyInternet Access Connectivity SpeedTechnical SupportLocal Area Network Wide Area NetworkTeaching and Learning
  • 13.
    Campus Areas ofImprovementTeaching and LearningContent Area Connections and Patterns of UseEducator Preparation and DevelopmentProfessional Development for Online LearningProfessional Development ExperiencesCapabilities of Educators
  • 14.
    SummaryThe STaR chartmeasures the level of proficiency in technology.The STaR chart provides information for areas of improvement.Aligned to the Long Range Plan for Technology