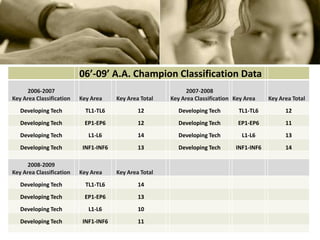
Campus Planning and Technology Needs AssessmentSchoolTechnologyand Readiness at A.A. Champion ElementaryBy Luis E. Troncoso
SchoolTechnologyandReadinessOverviewStarTechnologyandReadiness Chart (STaR Chart)What is StaR Chart?Background and Purpose of STaR Chart
STaR Chart’s Key AreasKey Area I: Teaching and LearningKey Area II: Educator, Preparation, and 		                DevelopmentKey Area III: Leadership, Administration, and 		                 Instructional SupportKey Area IV: Infrastructure and Technology
STaR Chart’s ClassificationsEarly TechnologyDeveloping TechnologyAdvanced TechnologyTarget Technology
Classification Variations21-24 Target Technology12-20 Advanced Technology1414141313121212139-14 Developing Technology1111106-8 Early Technology
Key Areas III and IV in Constant Decline
Campus STaR Chart OverviewNo Significant Growth Level in 3 YearsLeadership and Infrastructure in Constant Decline Teaching and Learning Area Shows ImprovementCampus at About 50% Technology Development
Recommendations to ReachTarget Technology LevelPlan for Master Teachers of TechnologyPlan for True Tech Support TeachersUp to Date Technology Equipment and ProgramsEfficient and Effective Technology Infrastructure
KeepingThe Long Range Technology Plan, 2006-2020 in PerspectiveShort Term Goal, Meet Phase 1 (2006-2010)Target Key Areas of The Long Range Technology PlanStudent and Teacher Voices are Imperative
ConclusionSTaR Chart as Part of The Planning ProcessAddress Technology StandardsIdentify Teachers in Need of Technology Skills
Final Thoughts21st century education requires greater technology, greater knowledge, greater skills, greater preparation, greater effort, greater everything…	Our children's future relies on well developed educational systems that can achieve goals and establish new ones. STaR Chart is a significant needs assessment tool that will play a major role in reaching these goals. Goals that will result in competent and computer savvy generations of students equipped for the technology of tomorrow.  

Edtc6342 ltroncoso project3

  • 1.
    Campus Planning andTechnology Needs AssessmentSchoolTechnologyand Readiness at A.A. Champion ElementaryBy Luis E. Troncoso
  • 2.
    SchoolTechnologyandReadinessOverviewStarTechnologyandReadiness Chart (STaRChart)What is StaR Chart?Background and Purpose of STaR Chart
  • 3.
    STaR Chart’s KeyAreasKey Area I: Teaching and LearningKey Area II: Educator, Preparation, and DevelopmentKey Area III: Leadership, Administration, and Instructional SupportKey Area IV: Infrastructure and Technology
  • 4.
    STaR Chart’s ClassificationsEarlyTechnologyDeveloping TechnologyAdvanced TechnologyTarget Technology
  • 6.
    Classification Variations21-24 TargetTechnology12-20 Advanced Technology1414141313121212139-14 Developing Technology1111106-8 Early Technology
  • 7.
    Key Areas IIIand IV in Constant Decline
  • 8.
    Campus STaR ChartOverviewNo Significant Growth Level in 3 YearsLeadership and Infrastructure in Constant Decline Teaching and Learning Area Shows ImprovementCampus at About 50% Technology Development
  • 9.
    Recommendations to ReachTargetTechnology LevelPlan for Master Teachers of TechnologyPlan for True Tech Support TeachersUp to Date Technology Equipment and ProgramsEfficient and Effective Technology Infrastructure
  • 10.
    KeepingThe Long RangeTechnology Plan, 2006-2020 in PerspectiveShort Term Goal, Meet Phase 1 (2006-2010)Target Key Areas of The Long Range Technology PlanStudent and Teacher Voices are Imperative
  • 11.
    ConclusionSTaR Chart asPart of The Planning ProcessAddress Technology StandardsIdentify Teachers in Need of Technology Skills
  • 12.
    Final Thoughts21st centuryeducation requires greater technology, greater knowledge, greater skills, greater preparation, greater effort, greater everything… Our children's future relies on well developed educational systems that can achieve goals and establish new ones. STaR Chart is a significant needs assessment tool that will play a major role in reaching these goals. Goals that will result in competent and computer savvy generations of students equipped for the technology of tomorrow.  

Editor's Notes

  • #8 Our new principal began its first full year in 2007-2008. She implemented a budgeting technology plan which consisted of purchasing a certain amount of technology resources per year and per grade level. Fifth grade teachers were first, followed by fourth grade teachers, and know third grade teachers. This pattern will continue into the lower grade levels. So, our leadership and instructional support has to improve along our campus infrastructure for technology.As demonstrated by teachers’ input in STaR Chart and the above chart, the plan has been decreasing in popularity. The outcome of this is due to the inefficiency in implementing the plan. Technology equipment being purchased is coming into the campus around mid school year. By this time, TAKS is too close and the interest on effectively integrating technology into the classroom diminishes. In addition, the campus does not offer professional development on the new technology purchased.