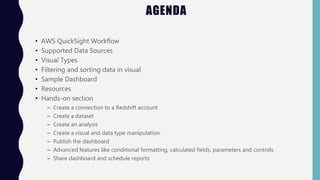
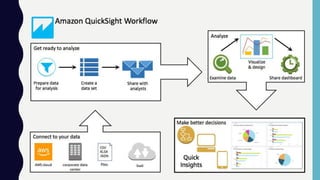
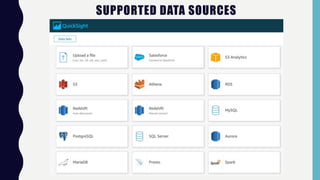
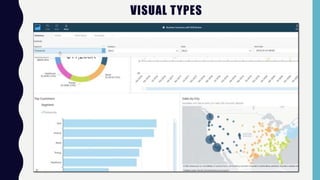
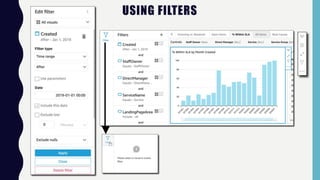
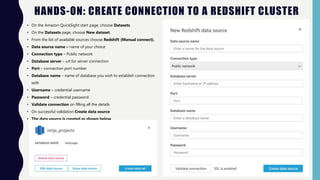
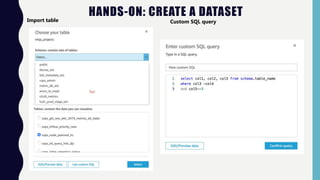
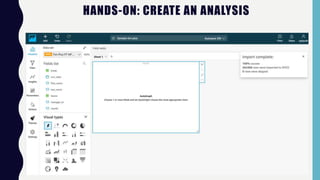
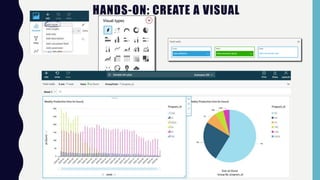
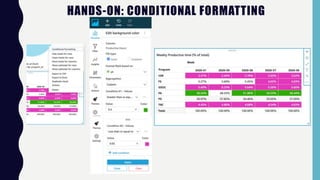
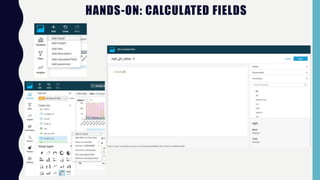
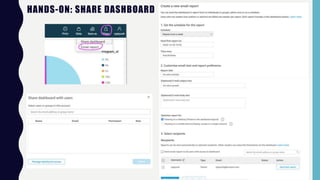
This document provides an overview and hands-on guide to using Amazon QuickSight for data analytics. It introduces the QuickSight workflow, supported data sources like Redshift, different visual types, and how to filter and sort data. The hands-on section walks through creating a connection to a Redshift database, building a dataset, developing an analysis with visualizations, and publishing and sharing a dashboard. It demonstrates features like conditional formatting, calculated fields, and parameters.


![[Keynote] Accelerating Business Outcomes with AWS Data - 발표자: Saeed Gharadagh...](https://cdn.slidesharecdn.com/ss_thumbnails/d2s01keynoteacceleratingbusinessoutcomeswithawsdata-230704011737-e053cfca-thumbnail.jpg?width=640&height=640&fit=bounds)