


![NATURE BIOTECHNOLOGY VOLUME 35 NUMBER 10 OCTOBER 2017 897
23andMe wades further into drug discovery
Direct-to-consumer genetics testing com-
pany 23andMe is advancing its drug dis-
covery efforts with a $250 million financing
round announced in September. The
Mountain View, California–based firm
plans to use the funds for its own therapeu-
tics division aimed at mining the company’s
database for novel drug targets, in addition
to its existing consumer genomics business
and genetic research platform. At the same
time, the company has strengthened ongo-
ing partnerships with Pfizer and Roche, and
inked a new collaboration with Lundbeck—
all are keen to incorporate 23andMe’s human
genetics data cache into their discovery and
clinical programs.
It was over a decade ago that Icelandic
company deCODE Genetics pioneered
genetics-driven drug discovery. The
Reykjavik-based biotech’s DNA database of
140,000 Icelanders, which Amgen bought in
2012 (Nat. Biotechnol. 31, 87–88, 2013), was
set up to identify genes associated with dis-
ease. But whereas the bedrock of deCODE’s
platform was the health records stretching
back over a century, the value in 23andMe’s
platform lies instead in its database of more
than 2 million genotyped customers, and
the reams of phenotypic information par-
ticipants collect at home by online surveys
of mood, cognition and even food intake.
For Danish pharma Lundbeck, a partner-
ship signed in August with 23andMe and
think-tank Milken Institute will provide a
fresh look at major depressive disorder and
bipolar depression. The collaboration study-
ing 25,000 participants will link genomics
with complete cognitive tests and surveys
taken over nine months, providing an almost
continuous monitoring of participants’
symptoms. “Cognition is a key symptom in
depression,” says Niels Plath, vice president
for synaptic transmission at Copenhagen-
based Lundbeck. But the biological processes
leading to depression are poorly understood,
and the condition is difficult to classify as
it includes a broad population of patients.
“If we could use genetic profiling to sort
people into groups and link to biology, we
could identify new drug targets, novel path-
ways and protein networks. With 23andMe,
we can combine the genetic profiling with
symptomatic presentation,” says Plath. An
approach like this leapfrogs the traditional
paradigm of mouse models and cell-based
assays for drug discovery. “Our scientific
hypotheses must come from patient-derived
information,” says Plath. “It could be pheno-
type, it could be genetic.”
Drug maker Roche has been taking advan-
tage of 23andMe’s data cache for several years,
and its collaborations are yielding results. In
September, researchers from the Basel-based
pharma’s wholly owned Genentech subsid-
iary, in partnership with 23andMe and oth-
ers, published a paper showcasing 17 new
Parkinson’s disease risk loci that could be
potential targets for therapeutics (Nat. Genet.
http://dx.doi.org/10.1038/ng.3955, 2017).
A year earlier, in August 2016, scientists
at New York–based Pfizer, 23andMe and
Massachusetts General Hospital announced
that they had identified 15 genetic regions
linked to depression (Nat. Genet. 48, 1031–
1036, 2016). A 23andMe spokesperson this
week called that paper a “landmark,” because
it was the first study to uncover 17 variants
associated with major depressive disorder.
Ashley Winslow, who was corresponding
author on the 2016 Nature Genetics paper, and
who used to work at Pfizer, says, “Initially,
the focus was on using the database to either
confirm [or refute] the findings established
by traditional, clinical methods of ascertain-
ment.” It soon occurred to the investigators
that they could move beyond traditional
association studies and do discovery work in
indications that to date had “not been well
powered,” such as major depression, espe-
cially since some of 23andMe’s questionnaires
specifically asked if subjects had once been
clinically diagnosed.
“I think [the database is] of particular
interest for psychiatric disorders because
the medications just have such a poor track
record of not working,” says Winslow, now
senior director of translational research and
portfolio development at the University of
Pennsylvania’s Orphan Disease Center in
Philadelphia. “23andMe offered us a fresh
new look.”
Winslow thinks there is a “powerful
shift” under way in pharma as it recognizes
the benefits of rooting target discovery in
human-derived data. “You still have to do
the work-up through cell-line screening or
animals at some point, but the starting point
being human-derived data is hugely impor-
tant.”
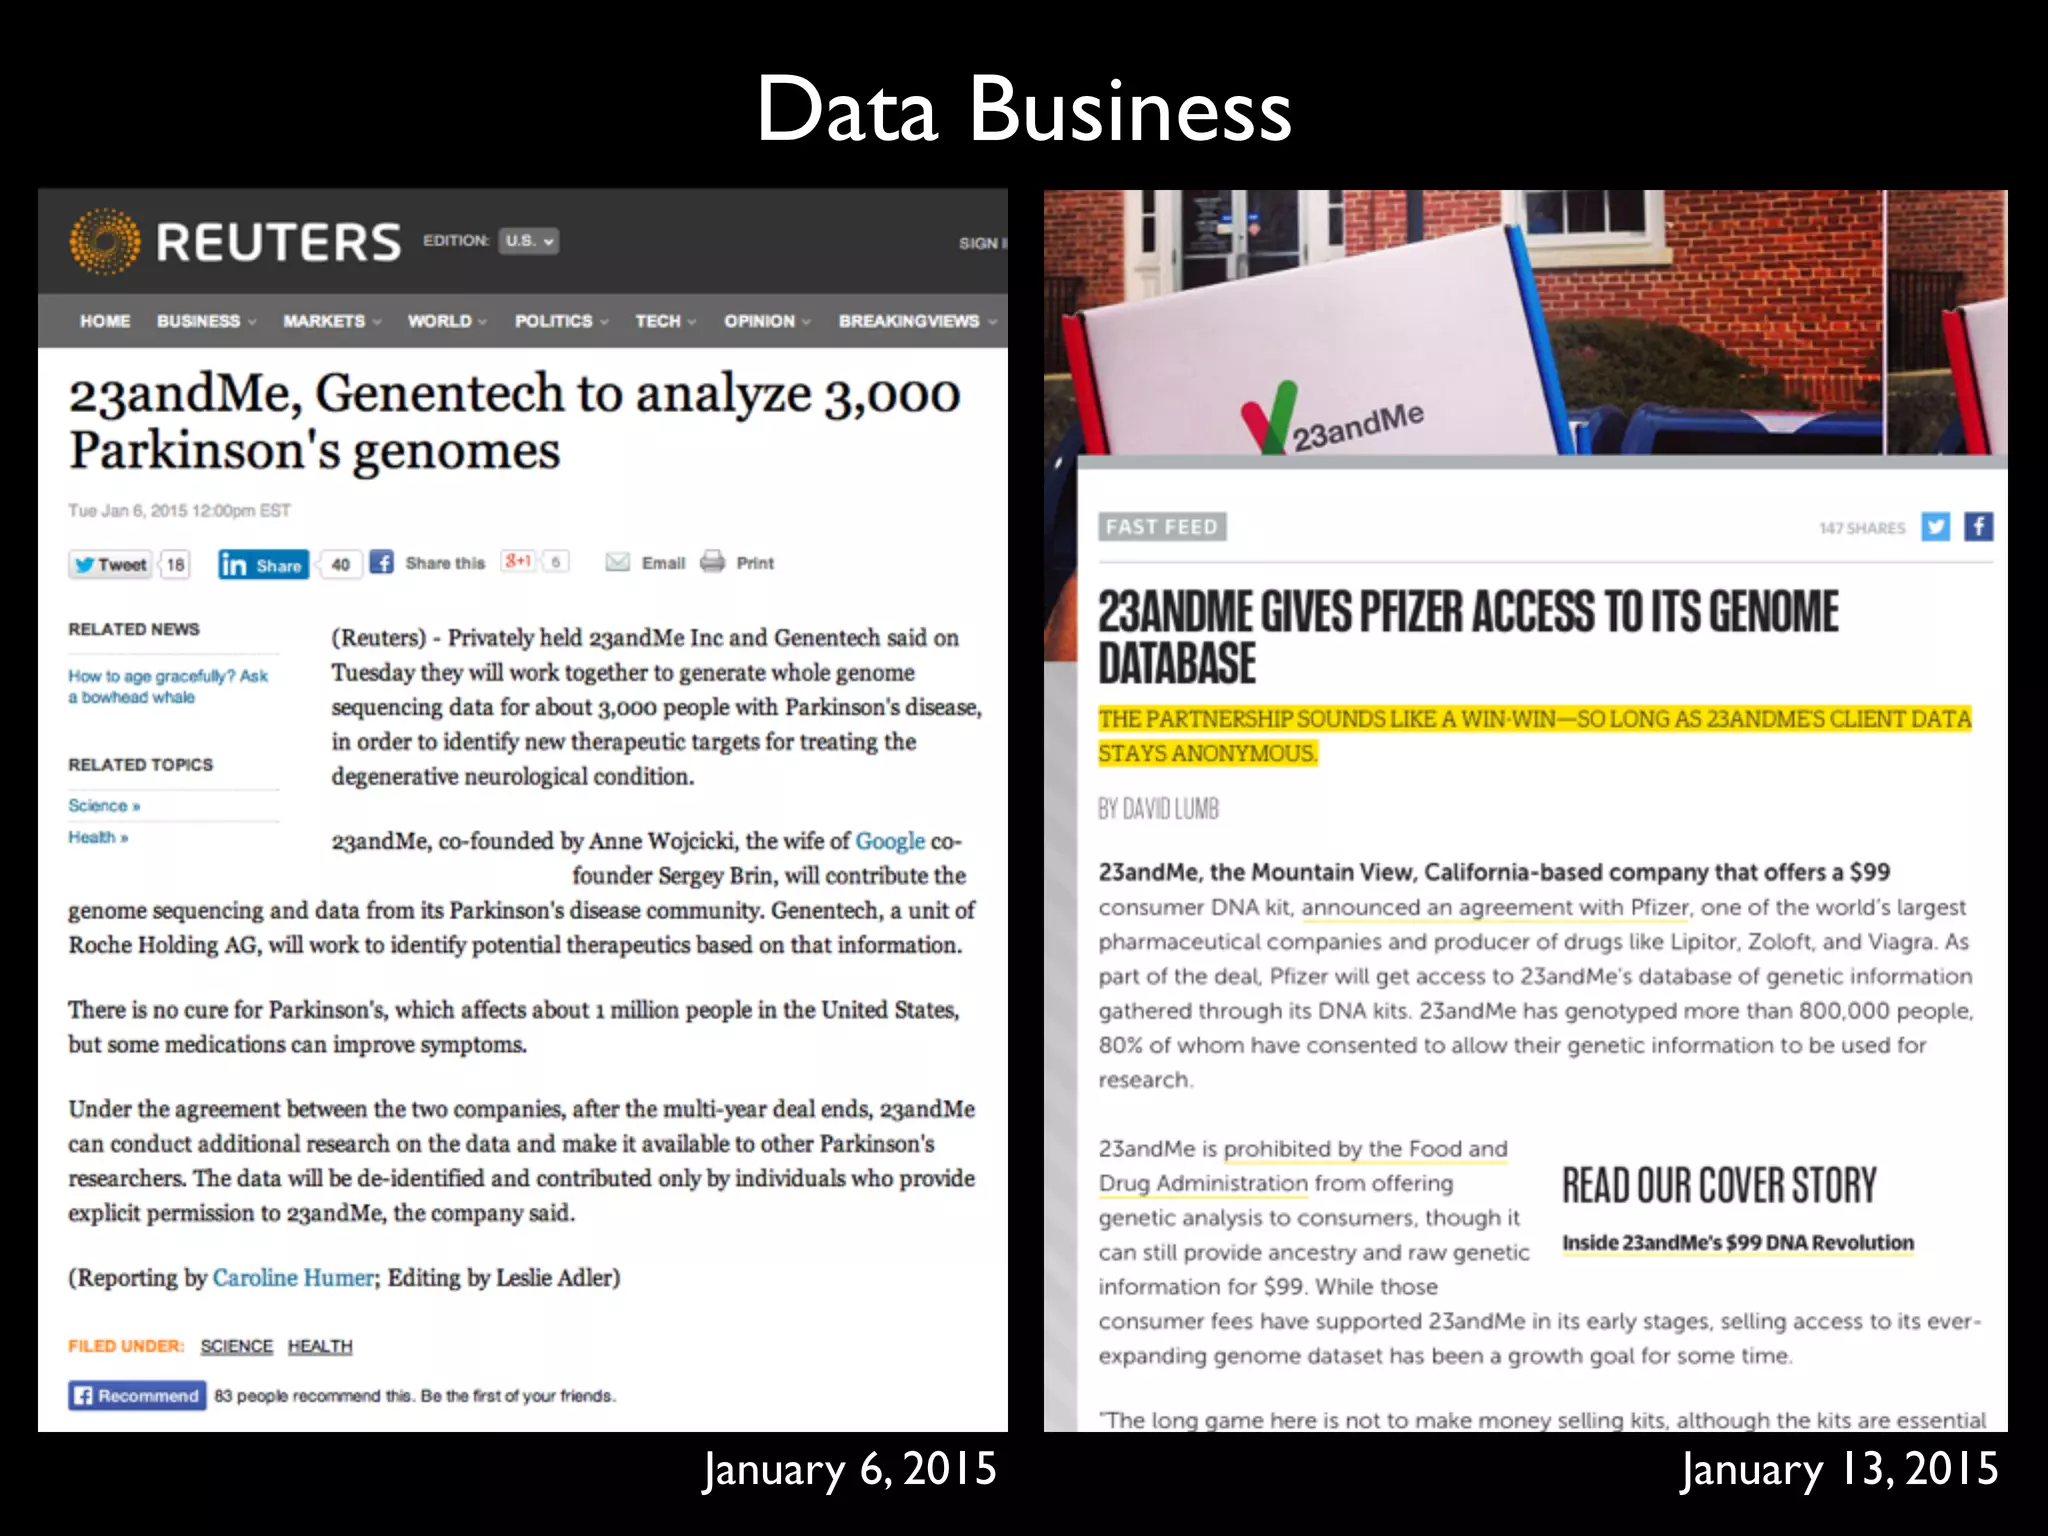
Justin Petrone Tartu, EstoniaBeyond consumer genetics: 23andMe sells access to its database to drug companies.
KristofferTripplaar/AlamyStockPhoto
N E W S
©2017NatureAmerica,Inc.,partofSpringerNature.Allrightsreserved.](https://image.slidesharecdn.com/digitaltherapeutics-180401151009/75/slide-26-2048.jpg)


![DeepFace: Closing the Gap to Human-Level
Performance in FaceVerification
Taigman,Y. et al. (2014). DeepFace: Closing the Gap to Human-Level Performance in FaceVerification, CVPR’14.
Figure 2. Outline of the DeepFace architecture. A front-end of a single convolution-pooling-convolution filtering on the rectified input, followed by three
locally-connected layers and two fully-connected layers. Colors illustrate feature maps produced at each layer. The net includes more than 120 million
parameters, where more than 95% come from the local and fully connected layers.
very few parameters. These layers merely expand the input
into a set of simple local features.
The subsequent layers (L4, L5 and L6) are instead lo-
cally connected [13, 16], like a convolutional layer they ap-
ply a filter bank, but every location in the feature map learns
a different set of filters. Since different regions of an aligned
image have different local statistics, the spatial stationarity
The goal of training is to maximize the probability of
the correct class (face id). We achieve this by minimiz-
ing the cross-entropy loss for each training sample. If k
is the index of the true label for a given input, the loss is:
L = log pk. The loss is minimized over the parameters
by computing the gradient of L w.r.t. the parameters and
Human: 95% vs. DeepFace in Facebook: 97.35%
Recognition Accuracy for Labeled Faces in the Wild (LFW) dataset (13,233 images, 5,749 people)](https://image.slidesharecdn.com/digitaltherapeutics-180401151009/75/slide-51-2048.jpg)
![FaceNet:A Unified Embedding for Face
Recognition and Clustering
Schroff, F. et al. (2015). FaceNet:A Unified Embedding for Face Recognition and Clustering
Human: 95% vs. FaceNet of Google: 99.63%
Recognition Accuracy for Labeled Faces in the Wild (LFW) dataset (13,233 images, 5,749 people)
False accept
False reject
s. This shows all pairs of images that were
on LFW. Only eight of the 13 errors shown
he other four are mislabeled in LFW.
on Youtube Faces DB
ge similarity of all pairs of the first one
our face detector detects in each video.
False accept
False reject
Figure 6. LFW errors. This shows all pairs of images that were
incorrectly classified on LFW. Only eight of the 13 errors shown
here are actual errors the other four are mislabeled in LFW.
5.7. Performance on Youtube Faces DB
We use the average similarity of all pairs of the first one
hundred frames that our face detector detects in each video.
This gives us a classification accuracy of 95.12%±0.39.
Using the first one thousand frames results in 95.18%.
Compared to [17] 91.4% who also evaluate one hundred
frames per video we reduce the error rate by almost half.
DeepId2+ [15] achieved 93.2% and our method reduces this
error by 30%, comparable to our improvement on LFW.
5.8. Face Clustering
Our compact embedding lends itself to be used in order
to cluster a users personal photos into groups of people with
the same identity. The constraints in assignment imposed
by clustering faces, compared to the pure verification task,
lead to truly amazing results. Figure 7 shows one cluster in
a users personal photo collection, generated using agglom-
erative clustering. It is a clear showcase of the incredible
invariance to occlusion, lighting, pose and even age.
Figure 7. Face Clustering. Shown is an exemplar cluster for one
user. All these images in the users personal photo collection were
clustered together.
6. Summary
We provide a method to directly learn an embedding into
an Euclidean space for face verification. This sets it apart
from other methods [15, 17] who use the CNN bottleneck
layer, or require additional post-processing such as concate-
nation of multiple models and PCA, as well as SVM clas-
sification. Our end-to-end training both simplifies the setup
and shows that directly optimizing a loss relevant to the task
at hand improves performance.
Another strength of our model is that it only requires
False accept
False reject
Figure 6. LFW errors. This shows all pairs of images that were
incorrectly classified on LFW. Only eight of the 13 errors shown
here are actual errors the other four are mislabeled in LFW.
5.7. Performance on Youtube Faces DB
We use the average similarity of all pairs of the first one
hundred frames that our face detector detects in each video.
This gives us a classification accuracy of 95.12%±0.39.
Using the first one thousand frames results in 95.18%.
Compared to [17] 91.4% who also evaluate one hundred
frames per video we reduce the error rate by almost half.
DeepId2+ [15] achieved 93.2% and our method reduces this
error by 30%, comparable to our improvement on LFW.
5.8. Face Clustering
Our compact embedding lends itself to be used in order
to cluster a users personal photos into groups of people with
the same identity. The constraints in assignment imposed
by clustering faces, compared to the pure verification task,
Figure 7. Face Clustering. Shown is an exemplar cluster for one
user. All these images in the users personal photo collection were
clustered together.
6. Summary
We provide a method to directly learn an embedding into
an Euclidean space for face verification. This sets it apart
from other methods [15, 17] who use the CNN bottleneck
layer, or require additional post-processing such as concate-
nation of multiple models and PCA, as well as SVM clas-](https://image.slidesharecdn.com/digitaltherapeutics-180401151009/75/slide-52-2048.jpg)
![Targeting Ultimate Accuracy: Face
Recognition via Deep Embedding
Jingtuo Liu (2015) Targeting Ultimate Accuracy: Face Recognition via Deep Embedding
Human: 95% vs.Baidu: 99.77%
Recognition Accuracy for Labeled Faces in the Wild (LFW) dataset (13,233 images, 5,749 people)
3
Although several algorithms have achieved nearly perfect
accuracy in the 6000-pair verification task, a more practical
can achieve 95.8% identification rate, relatively reducing the
error rate by about 77%.
TABLE 3. COMPARISONS WITH OTHER METHODS ON SEVERAL EVALUATION TASKS
Score = -0.060 (pair #113) Score = -0.022 (pair #202) Score = -0.034 (pair #656)
Score = -0.031 (pair #1230) Score = -0.073 (pair #1862) Score = -0.091(pair #2499)
Score = -0.024 (pair #2551) Score = -0.036 (pair #2552) Score = -0.089 (pair #2610)
Method
Performance on tasks
Pair-wise
Accuracy(%)
Rank-1(%)
DIR(%) @
FAR =1%
Verification(%
)@ FAR=0.1%
Open-set
Identification(%
)@ Rank =
1,FAR = 0.1%
IDL Ensemble
Model
99.77 98.03 95.8 99.41 92.09
IDL Single Model 99.68 97.60 94.12 99.11 89.08
FaceNet[12] 99.63 NA NA NA NA
DeepID3[9] 99.53 96.00 81.40 NA NA
Face++[2] 99.50 NA NA NA NA
Facebook[15] 98.37 82.5 61.9 NA NA
Learning from
Scratch[4]
97.73 NA NA 80.26 28.90
HighDimLBP[10] 95.17 NA NA
41.66(reported
in [4])
18.07(reported
in [4])
• 6,000쌍의 얼굴 사진 중에 바이두의 인공지능은 불과 14쌍만을 잘못 판단
• 알고 보니 이 14쌍 중의 5쌍의 사진은 오히려 정답에 오류가 있었고,
실제로는 인공지능이 정확 (red box)](https://image.slidesharecdn.com/digitaltherapeutics-180401151009/75/slide-53-2048.jpg)


![AtomNet: A Deep Convolutional Neural Network for
Bioactivity Prediction in Structure-based Drug
Discovery
Izhar Wallach
Atomwise, Inc.
izhar@atomwise.com
Michael Dzamba
Atomwise, Inc.
misko@atomwise.com
Abraham Heifets
Atomwise, Inc.
abe@atomwise.com
Abstract
Deep convolutional neural networks comprise a subclass of deep neural networks
(DNN) with a constrained architecture that leverages the spatial and temporal
structure of the domain they model. Convolutional networks achieve the best pre-
dictive performance in areas such as speech and image recognition by hierarchi-
cally composing simple local features into complex models. Although DNNs have
been used in drug discovery for QSAR and ligand-based bioactivity predictions,
none of these models have benefited from this powerful convolutional architec-
ture. This paper introduces AtomNet, the first structure-based, deep convolutional
neural network designed to predict the bioactivity of small molecules for drug dis-
covery applications. We demonstrate how to apply the convolutional concepts of
feature locality and hierarchical composition to the modeling of bioactivity and
chemical interactions. In further contrast to existing DNN techniques, we show
that AtomNet’s application of local convolutional filters to structural target infor-
mation successfully predicts new active molecules for targets with no previously
known modulators. Finally, we show that AtomNet outperforms previous docking
approaches on a diverse set of benchmarks by a large margin, achieving an AUC
greater than 0.9 on 57.8% of the targets in the DUDE benchmark.
1 Introduction
Fundamentally, biological systems operate through the physical interaction of molecules. The ability
to determine when molecular binding occurs is therefore critical for the discovery of new medicines
and for furthering of our understanding of biology. Unfortunately, despite thirty years of compu-
tational efforts, computer tools remain too inaccurate for routine binding prediction, and physical
experiments remain the state of the art for binding determination. The ability to accurately pre-
dict molecular binding would reduce the time-to-discovery of new treatments, help eliminate toxic
molecules early in development, and guide medicinal chemistry efforts [1, 2].
In this paper, we introduce a new predictive architecture, AtomNet, to help address these challenges.
AtomNet is novel in two regards: AtomNet is the first deep convolutional neural network for molec-
ular binding affinity prediction. It is also the first deep learning system that incorporates structural
information about the target to make its predictions.
Deep convolutional neural networks (DCNN) are currently the best performing predictive models
for speech and vision [3, 4, 5, 6]. DCNN is a class of deep neural network that constrains its model
architecture to leverage the spatial and temporal structure of its domain. For example, a low-level
image feature, such as an edge, can be described within a small spatially-proximate patch of pixels.
Such a feature detector can share evidence across the entire receptive field by “tying the weights”
of the detector neurons, as the recognition of the edge does not depend on where it is found within
1
arXiv:1510.02855v1[cs.LG]10Oct2015](https://image.slidesharecdn.com/digitaltherapeutics-180401151009/75/slide-75-2048.jpg)
![AtomNet: A Deep Convolutional Neural Network for
Bioactivity Prediction in Structure-based Drug
Discovery
Izhar Wallach
Atomwise, Inc.
izhar@atomwise.com
Michael Dzamba
Atomwise, Inc.
misko@atomwise.com
Abraham Heifets
Atomwise, Inc.
abe@atomwise.com
Abstract
Deep convolutional neural networks comprise a subclass of deep neural networks
(DNN) with a constrained architecture that leverages the spatial and temporal
structure of the domain they model. Convolutional networks achieve the best pre-
dictive performance in areas such as speech and image recognition by hierarchi-
cally composing simple local features into complex models. Although DNNs have
been used in drug discovery for QSAR and ligand-based bioactivity predictions,
none of these models have benefited from this powerful convolutional architec-
ture. This paper introduces AtomNet, the first structure-based, deep convolutional
neural network designed to predict the bioactivity of small molecules for drug dis-
covery applications. We demonstrate how to apply the convolutional concepts of
feature locality and hierarchical composition to the modeling of bioactivity and
chemical interactions. In further contrast to existing DNN techniques, we show
that AtomNet’s application of local convolutional filters to structural target infor-
mation successfully predicts new active molecules for targets with no previously
known modulators. Finally, we show that AtomNet outperforms previous docking
approaches on a diverse set of benchmarks by a large margin, achieving an AUC
greater than 0.9 on 57.8% of the targets in the DUDE benchmark.
1 Introduction
Fundamentally, biological systems operate through the physical interaction of molecules. The ability
to determine when molecular binding occurs is therefore critical for the discovery of new medicines
and for furthering of our understanding of biology. Unfortunately, despite thirty years of compu-
tational efforts, computer tools remain too inaccurate for routine binding prediction, and physical
experiments remain the state of the art for binding determination. The ability to accurately pre-
dict molecular binding would reduce the time-to-discovery of new treatments, help eliminate toxic
molecules early in development, and guide medicinal chemistry efforts [1, 2].
In this paper, we introduce a new predictive architecture, AtomNet, to help address these challenges.
AtomNet is novel in two regards: AtomNet is the first deep convolutional neural network for molec-
ular binding affinity prediction. It is also the first deep learning system that incorporates structural
information about the target to make its predictions.
Deep convolutional neural networks (DCNN) are currently the best performing predictive models
for speech and vision [3, 4, 5, 6]. DCNN is a class of deep neural network that constrains its model
architecture to leverage the spatial and temporal structure of its domain. For example, a low-level
image feature, such as an edge, can be described within a small spatially-proximate patch of pixels.
Such a feature detector can share evidence across the entire receptive field by “tying the weights”
of the detector neurons, as the recognition of the edge does not depend on where it is found within
1
arXiv:1510.02855v1[cs.LG]10Oct2015
Smina 123 35 5 0 0
Table 3: The number of targets on which AtomNet and Smina exceed given adjusted-logAUC thresh-
olds. For example, on the CHEMBL-20 PMD set, AtomNet achieves an adjusted-logAUC of 0.3
or better for 27 targets (out of 50 possible targets). ChEMBL-20 PMD contains 50 targets, DUDE-
30 contains 30 targets, DUDE-102 contains 102 targets, and ChEMBL-20 inactives contains 149
targets.
To overcome these limitations we take an indirect approach. Instead of directly visualizing filters
in order to understand their specialization, we apply filters to input data and examine the location
where they maximally fire. Using this technique we were able to map filters to chemical functions.
For example, Figure 5 illustrate the 3D locations at which a particular filter from our first convo-
lutional layer fires. Visual inspection of the locations at which that filter is active reveals that this
filter specializes as a sulfonyl/sulfonamide detector. This demonstrates the ability of the model to
learn complex chemical features from simpler ones. In this case, the filter has inferred a meaningful
spatial arrangement of input atom types without any chemical prior knowledge.
Figure 5: Sulfonyl/sulfonamide detection with autonomously trained convolutional filters.
8
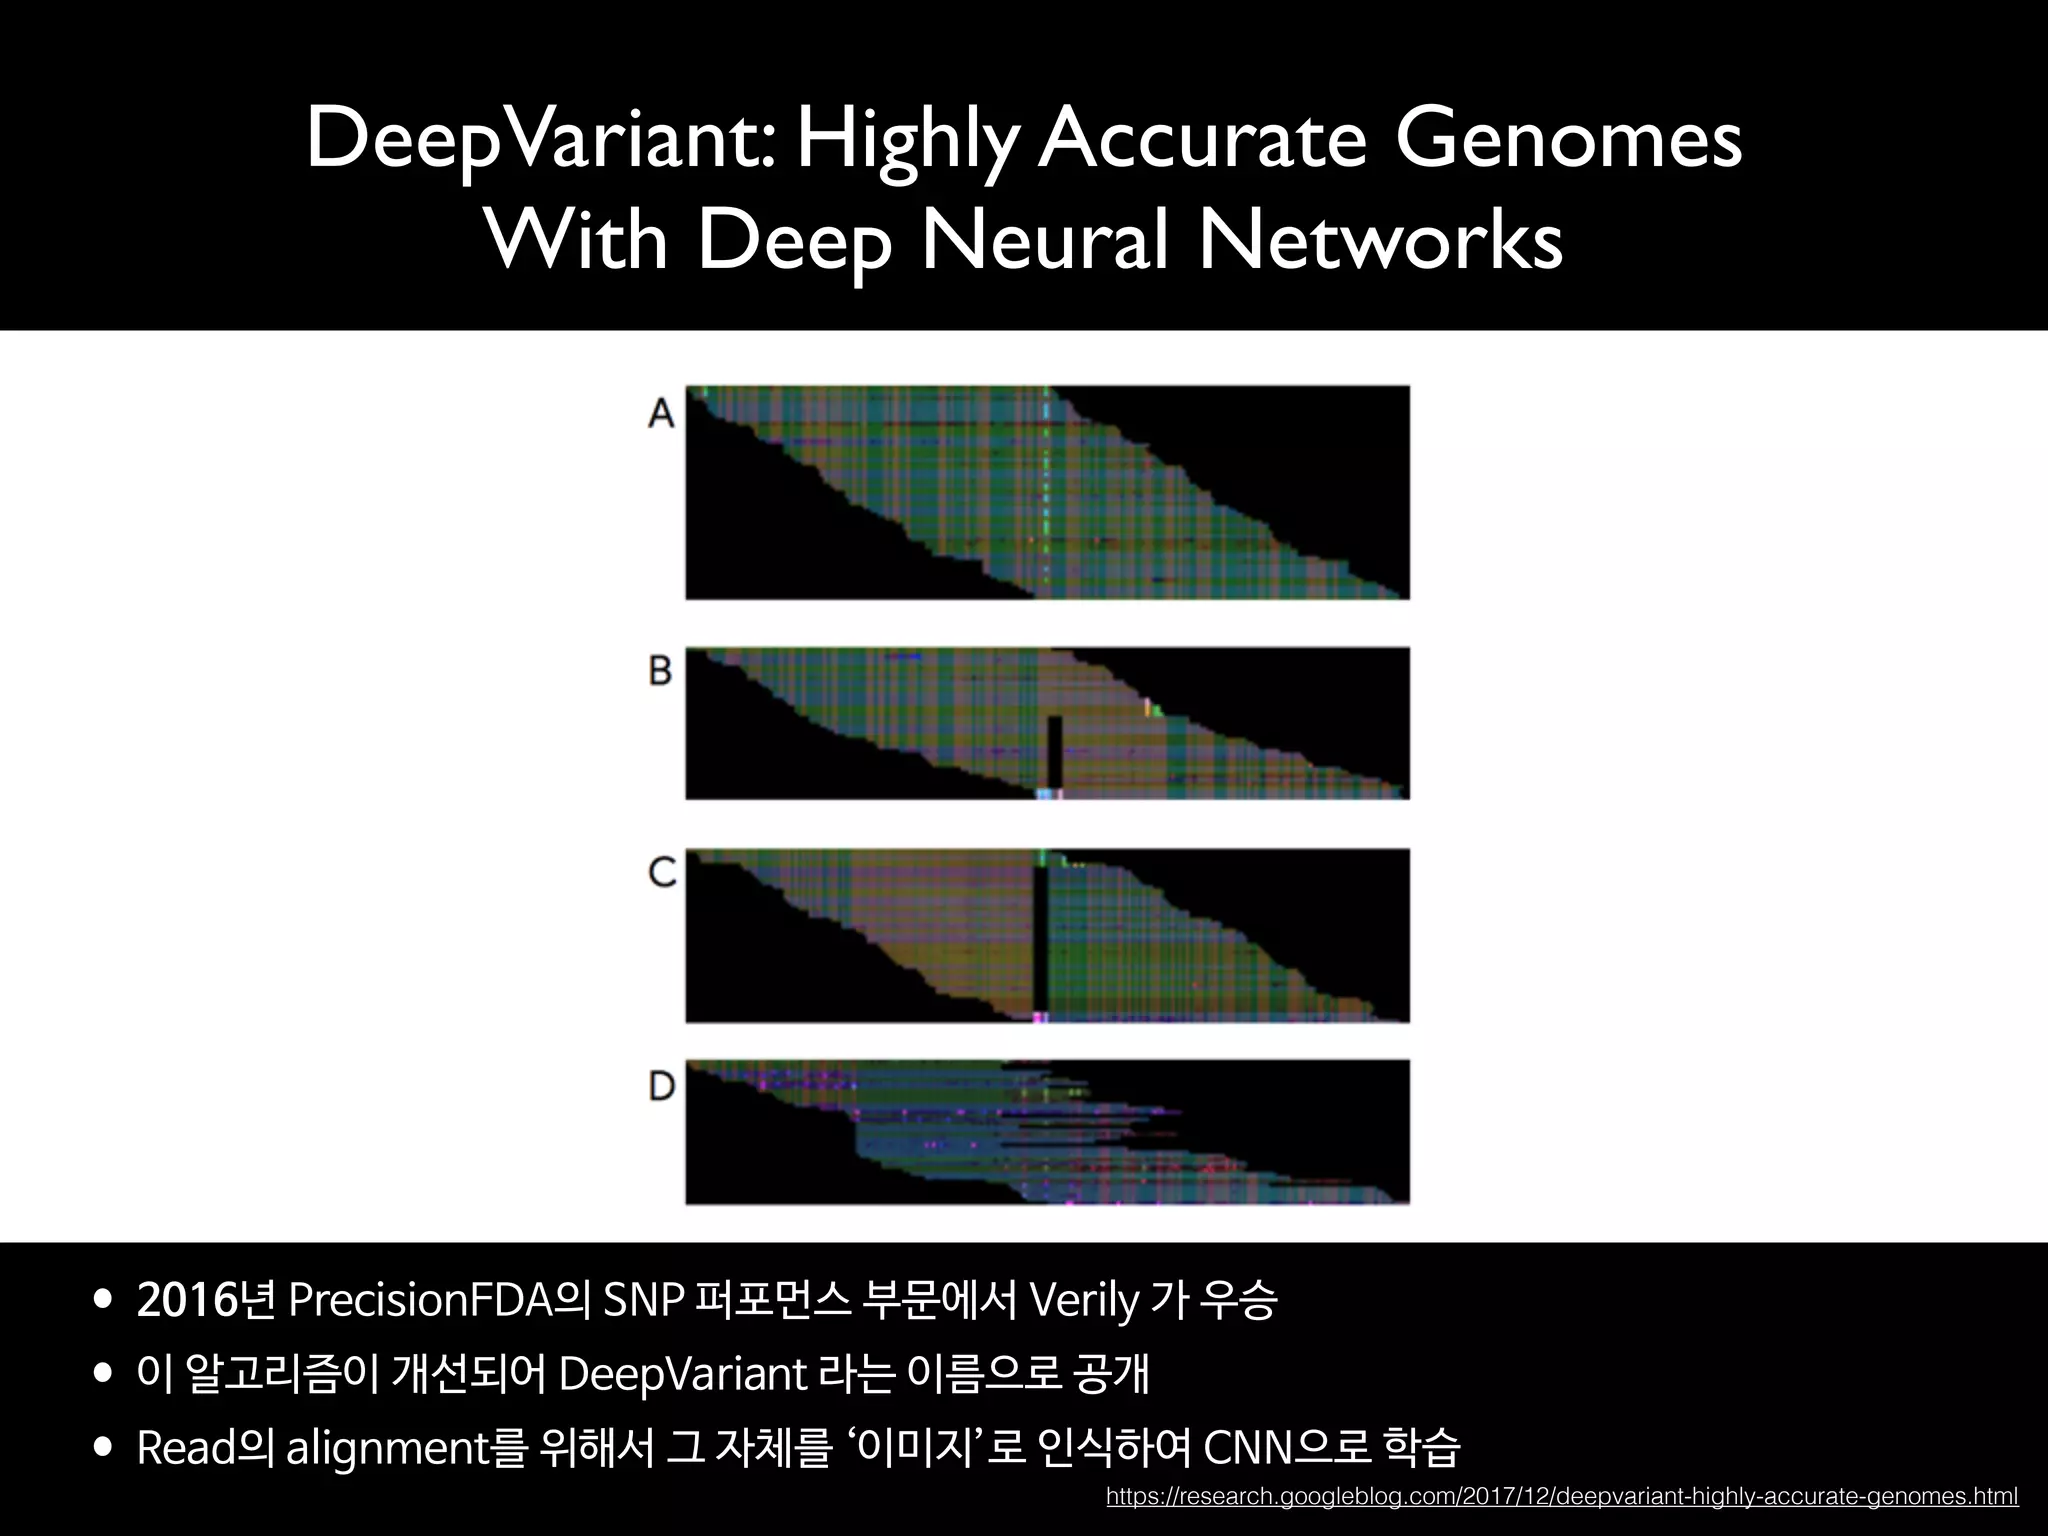
• 이미 알려진 단백질-리간드 3차원 결합 구조를 딥러닝(CNN)으로 학습
• 화학 결합 등에 대한 계산 없이도, 단백질-리간드 결합 여부를 계산
• 기존의 구조기반 예측 등 대비, 딥러닝으로 더 정확히 예측하였음](https://image.slidesharecdn.com/digitaltherapeutics-180401151009/75/slide-76-2048.jpg)
![AtomNet: A Deep Convolutional Neural Network for
Bioactivity Prediction in Structure-based Drug
Discovery
Izhar Wallach
Atomwise, Inc.
izhar@atomwise.com
Michael Dzamba
Atomwise, Inc.
misko@atomwise.com
Abraham Heifets
Atomwise, Inc.
abe@atomwise.com
Abstract
Deep convolutional neural networks comprise a subclass of deep neural networks
(DNN) with a constrained architecture that leverages the spatial and temporal
structure of the domain they model. Convolutional networks achieve the best pre-
dictive performance in areas such as speech and image recognition by hierarchi-
cally composing simple local features into complex models. Although DNNs have
been used in drug discovery for QSAR and ligand-based bioactivity predictions,
none of these models have benefited from this powerful convolutional architec-
ture. This paper introduces AtomNet, the first structure-based, deep convolutional
neural network designed to predict the bioactivity of small molecules for drug dis-
covery applications. We demonstrate how to apply the convolutional concepts of
feature locality and hierarchical composition to the modeling of bioactivity and
chemical interactions. In further contrast to existing DNN techniques, we show
that AtomNet’s application of local convolutional filters to structural target infor-
mation successfully predicts new active molecules for targets with no previously
known modulators. Finally, we show that AtomNet outperforms previous docking
approaches on a diverse set of benchmarks by a large margin, achieving an AUC
greater than 0.9 on 57.8% of the targets in the DUDE benchmark.
1 Introduction
Fundamentally, biological systems operate through the physical interaction of molecules. The ability
to determine when molecular binding occurs is therefore critical for the discovery of new medicines
and for furthering of our understanding of biology. Unfortunately, despite thirty years of compu-
tational efforts, computer tools remain too inaccurate for routine binding prediction, and physical
experiments remain the state of the art for binding determination. The ability to accurately pre-
dict molecular binding would reduce the time-to-discovery of new treatments, help eliminate toxic
molecules early in development, and guide medicinal chemistry efforts [1, 2].
In this paper, we introduce a new predictive architecture, AtomNet, to help address these challenges.
AtomNet is novel in two regards: AtomNet is the first deep convolutional neural network for molec-
ular binding affinity prediction. It is also the first deep learning system that incorporates structural
information about the target to make its predictions.
Deep convolutional neural networks (DCNN) are currently the best performing predictive models
for speech and vision [3, 4, 5, 6]. DCNN is a class of deep neural network that constrains its model
architecture to leverage the spatial and temporal structure of its domain. For example, a low-level
image feature, such as an edge, can be described within a small spatially-proximate patch of pixels.
Such a feature detector can share evidence across the entire receptive field by “tying the weights”
of the detector neurons, as the recognition of the edge does not depend on where it is found within
1
arXiv:1510.02855v1[cs.LG]10Oct2015
• 이미 알려진 단백질-리간드 3차원 결합 구조를 딥러닝(CNN)으로 학습
• 화학 결합 등에 대한 계산 없이도, 단백질-리간드 결합 여부를 계산
• 기존의 구조기반 예측 등 대비, 딥러닝으로 더 정확히 예측하였음](https://image.slidesharecdn.com/digitaltherapeutics-180401151009/75/slide-77-2048.jpg)


![RESEARCH ARTICLE
A pilot study to determine the feasibility of
enhancing cognitive abilities in children with
sensory processing dysfunction
Joaquin A. Anguera1,2☯
*, Anne N. Brandes-Aitken1☯
, Ashley D. Antovich1
, Camarin
E. Rolle1
, Shivani S. Desai1
, Elysa J. Marco1,2,3
1 Department of Neurology, University of California, San Francisco, United States of America, 2 Department
of Psychiatry, University of California, San Francisco, United States of America, 3 Department of Pediatrics,
University of California, San Francisco, United States of America
☯ These authors contributed equally to this work.
* joaquin.anguera@ucsf.edu
Abstract
Children with Sensory Processing Dysfunction (SPD) experience incoming information in
atypical, distracting ways. Qualitative challenges with attention have been reported in these
children, but such difficulties have not been quantified using either behavioral or functional
neuroimaging methods. Furthermore, the efficacy of evidence-based cognitive control inter-
ventions aimed at enhancing attention in this group has not been tested. Here we present
work aimed at characterizing and enhancing attentional abilities for children with SPD. A
sample of 38 SPD and 25 typically developing children were tested on behavioral, neural,
and parental measures of attention before and after a 4-week iPad-based at-home cognitive
remediation program. At baseline, 54% of children with SPD met or exceeded criteria on a
parent report measure for inattention/hyperactivity. Significant deficits involving sustained
attention, selective attention and goal management were observed only in the subset of
SPD children with parent-reported inattention. This subset of children also showed reduced
midline frontal theta activity, an electroencephalographic measure of attention. Following
the cognitive intervention, only the SPD children with inattention/hyperactivity showed both
improvements in midline frontal theta activity and on a parental report of inattention. Notably,
33% of these individuals no longer met the clinical cut-off for inattention, with the parent-
reported improvements persisting for 9 months. These findings support the benefit of a
targeted attention intervention for a subset of children with SPD, while simultaneously
highlighting the importance of having a multifaceted assessment for individuals with neuro-
developmental conditions to optimally personalize treatment.
Introduction
Five percent of all children suffer from Sensory Processing Dysfunction (SPD)[1], with these
individuals exhibiting exaggerated aversive, withdrawal, or seeking behaviors associated with
sensory inputs [2]. These sensory processing differences can have significant and lifelong con-
sequences for learning and social abilities, and are often shared by children who meet
PLOS ONE | https://doi.org/10.1371/journal.pone.0172616 April 5, 2017 1 / 19
a1111111111
a1111111111
a1111111111
a1111111111
a1111111111
OPEN ACCESS
Citation: Anguera JA, Brandes-Aitken AN, Antovich
AD, Rolle CE, Desai SS, Marco EJ (2017) A pilot
study to determine the feasibility of enhancing
cognitive abilities in children with sensory
processing dysfunction. PLoS ONE 12(4):
e0172616. https://doi.org/10.1371/journal.
pone.0172616
Editor: Jacobus P. van Wouwe, TNO,
NETHERLANDS
Received: October 5, 2016
Accepted: February 1, 2017
Published: April 5, 2017
Copyright: © 2017 Anguera et al. This is an open
access article distributed under the terms of the
Creative Commons Attribution License, which
permits unrestricted use, distribution, and
reproduction in any medium, provided the original
author and source are credited.
Data Availability Statement: All relevant data are
within the paper and its Supporting Information
files.
Funding: This work was supported by the
Mickelson-Brody Family Foundation, the Wallace
Research Foundation, the James Gates Family
Foundation, the Kawaja-Holcombe Family
Foundation (EJM), and the SNAP 2015 Crowd
funding effort.
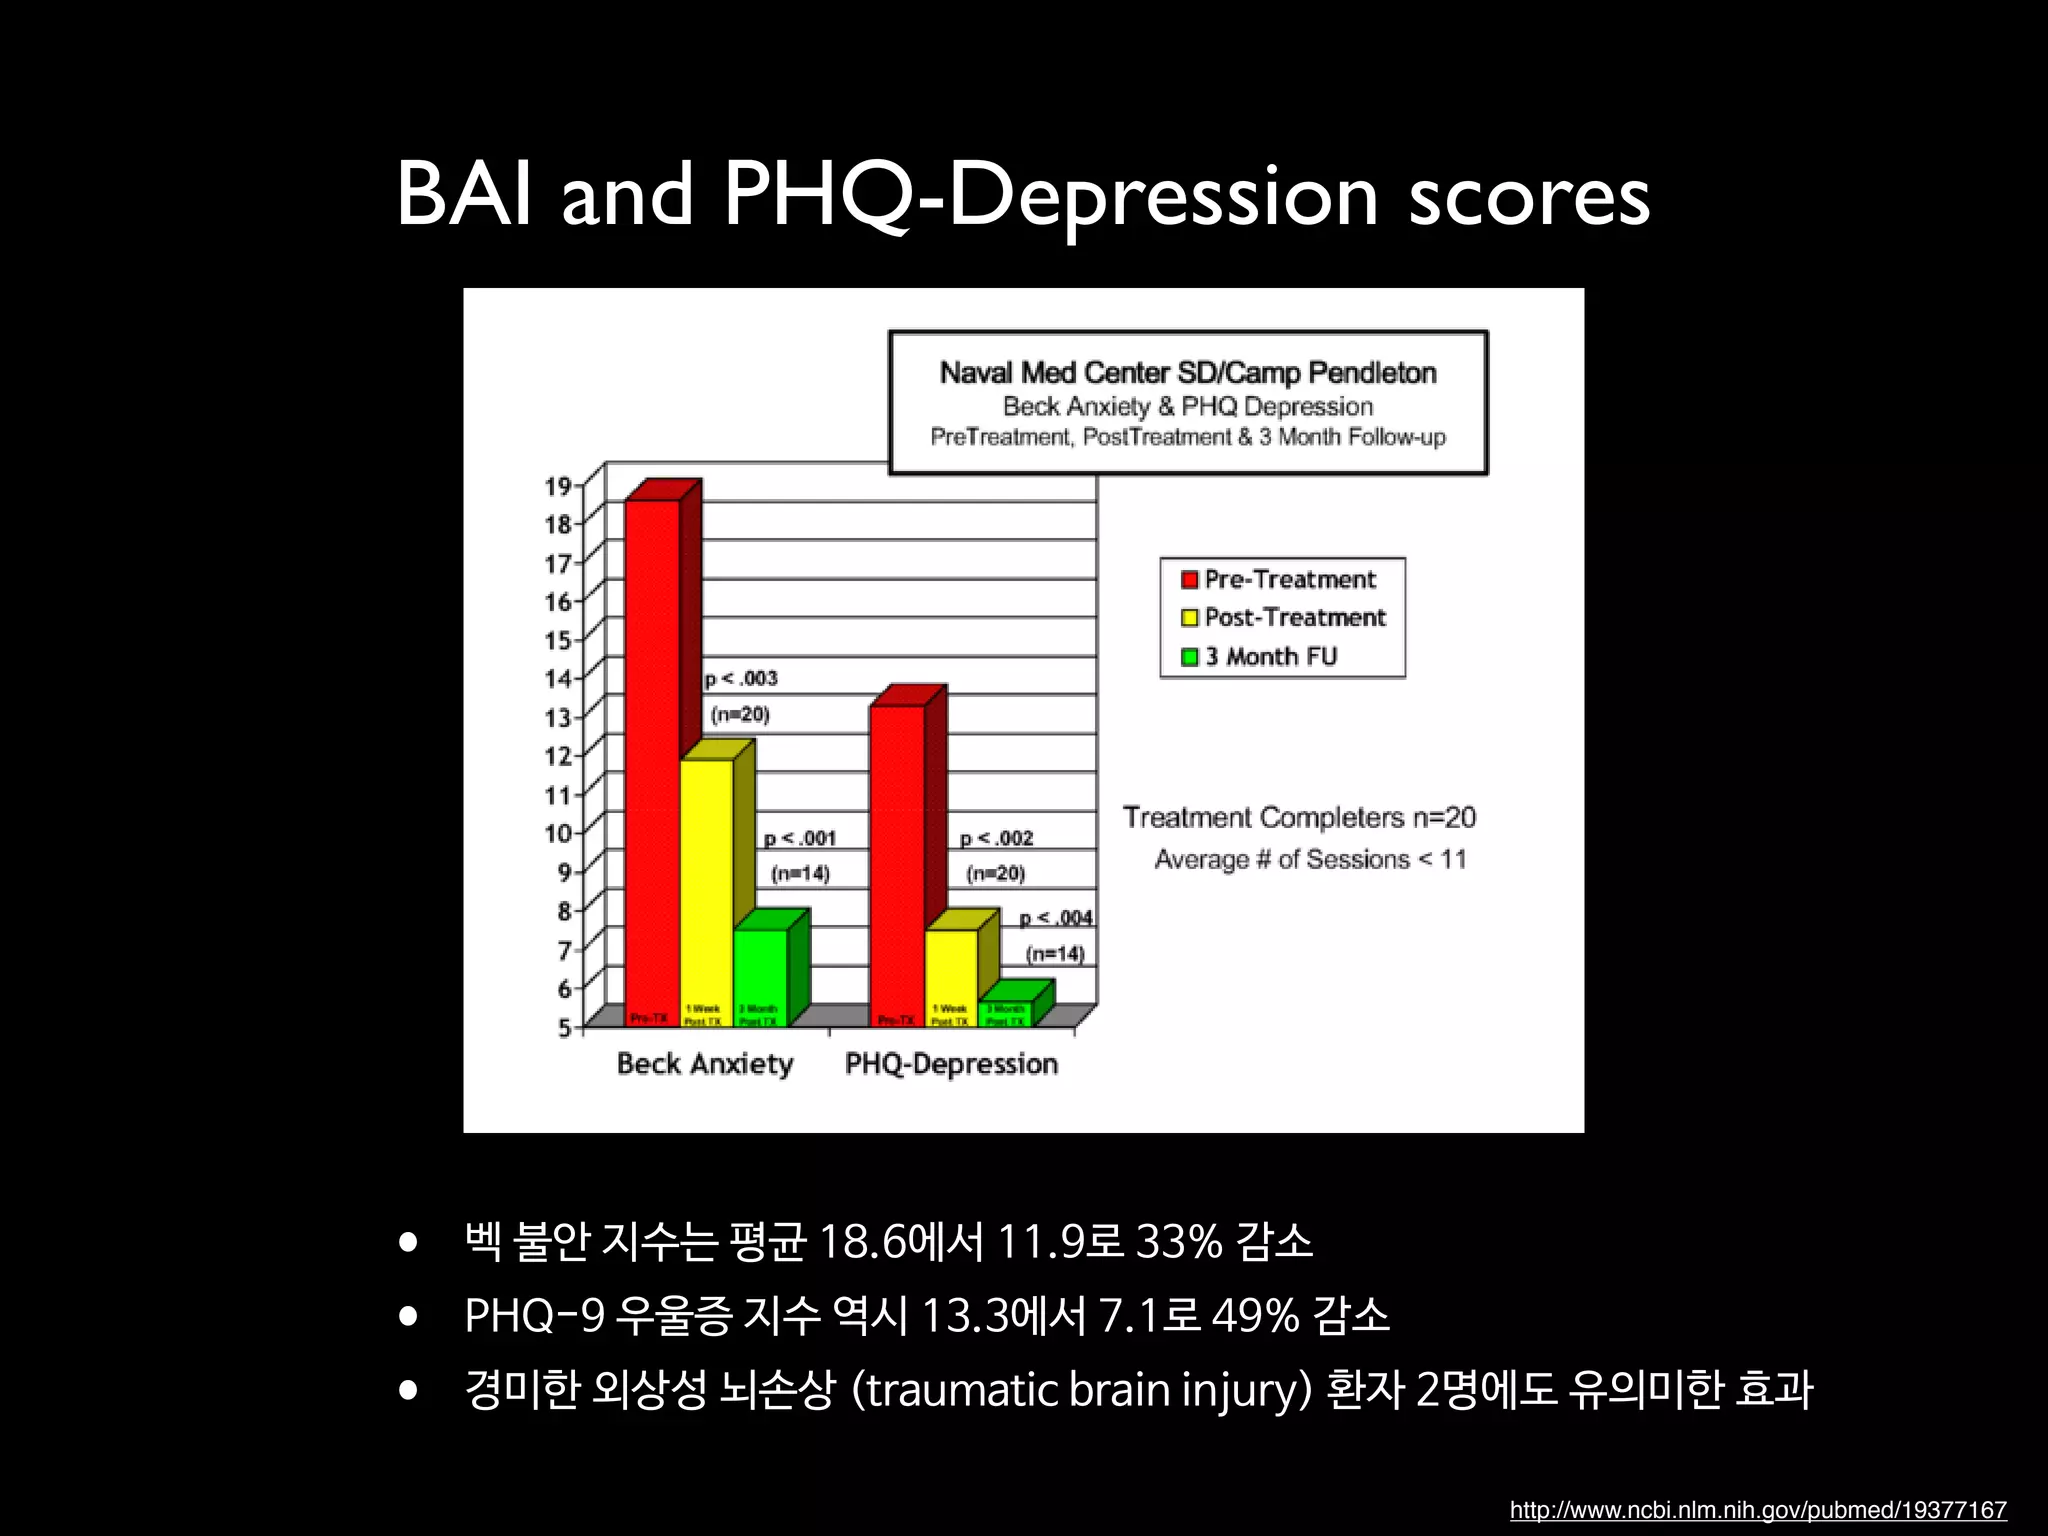
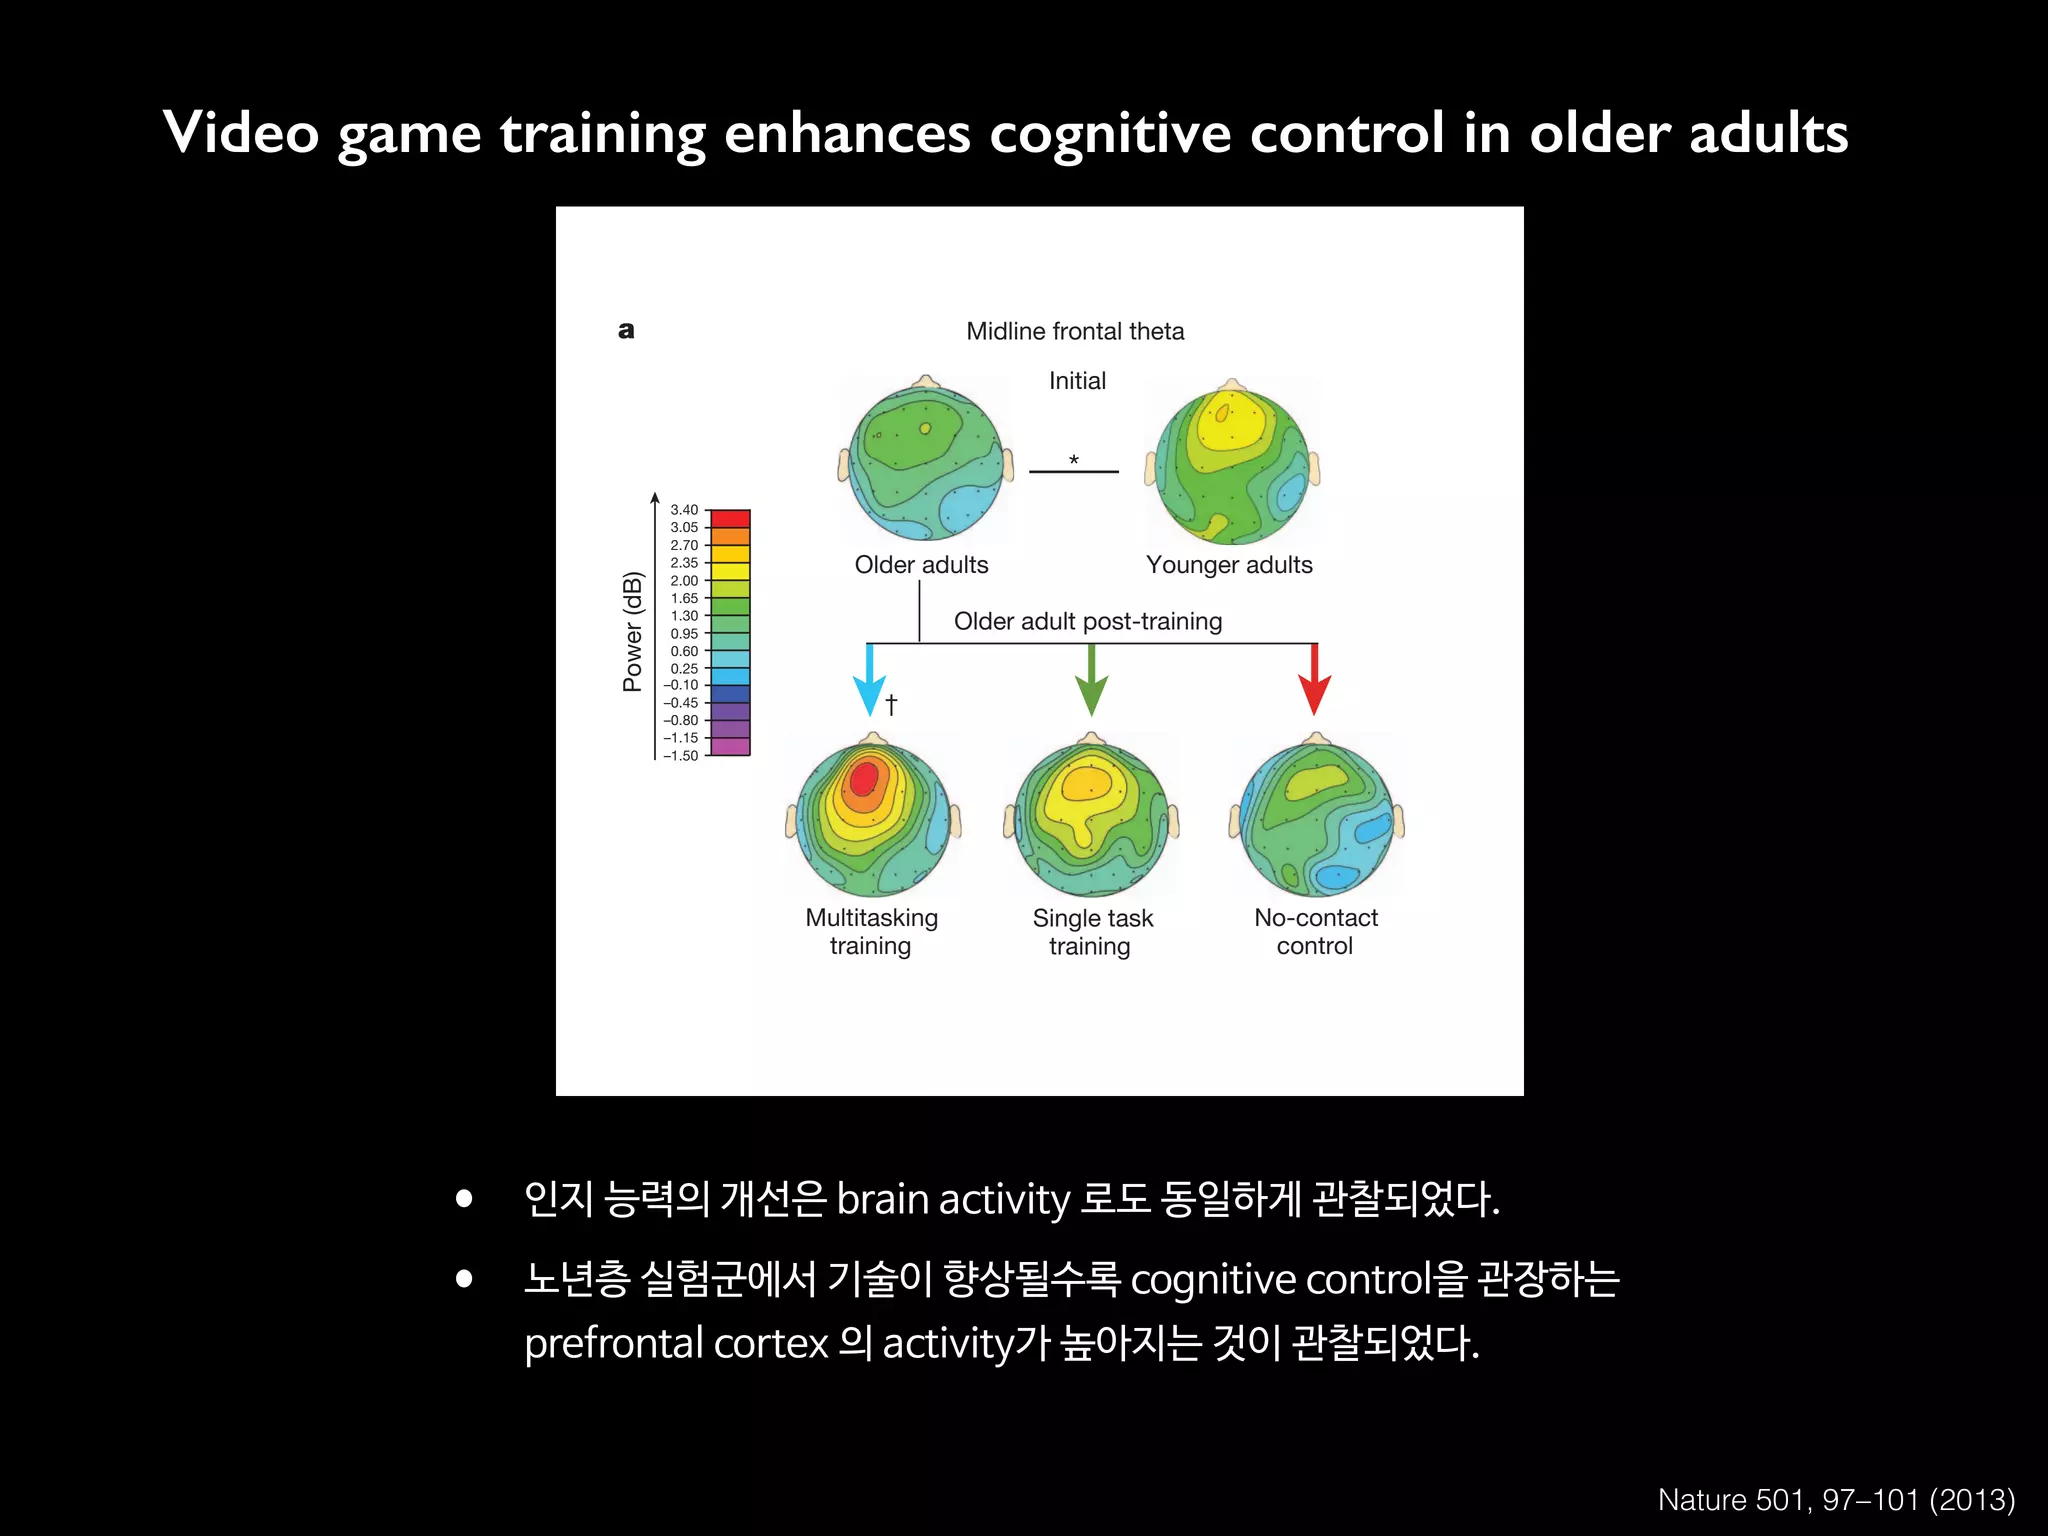
•감각처리장애(SPD)를 가진 소아 환자 중 ADHD를 가진 20명에 대해서 실험
•4주 동안 (주당 5일, 25분)Project EVO 게임을 하게 한 결과,
•20명 중 7명이 큰 개선을 보여서 더 이상 ADHD의 범주에 들지 않게 됨
•사용 후 적어도 9개월 동안 효과가 지속되었음
Fig 4. Transfer effect on behavioral and parent report measures. Pre and post (A) response time (B) and resp
revealing within group change. Error bars indicate standard error of the mean. Within group main effects of session
= p .05, ** =.p .01. Sun symbols indicate statistically significant instances where SPD+IA post-training performa
TDC group prior to training. (C) Vanderbilt parent report inattention change bar plot (calculated by pre-post margina
significant group x session interaction. Error bars indicate standard error of the mean. All group x session interactio
stars (* = p .05, ** =.p .01) on bar graph.
https://doi.org/10.1371/journal.pone.0172616.g004
PLOS ONE | https://doi.org/10.1371/journal.pone.0172616 April 5, 2017](https://image.slidesharecdn.com/digitaltherapeutics-180401151009/75/slide-220-2048.jpg)


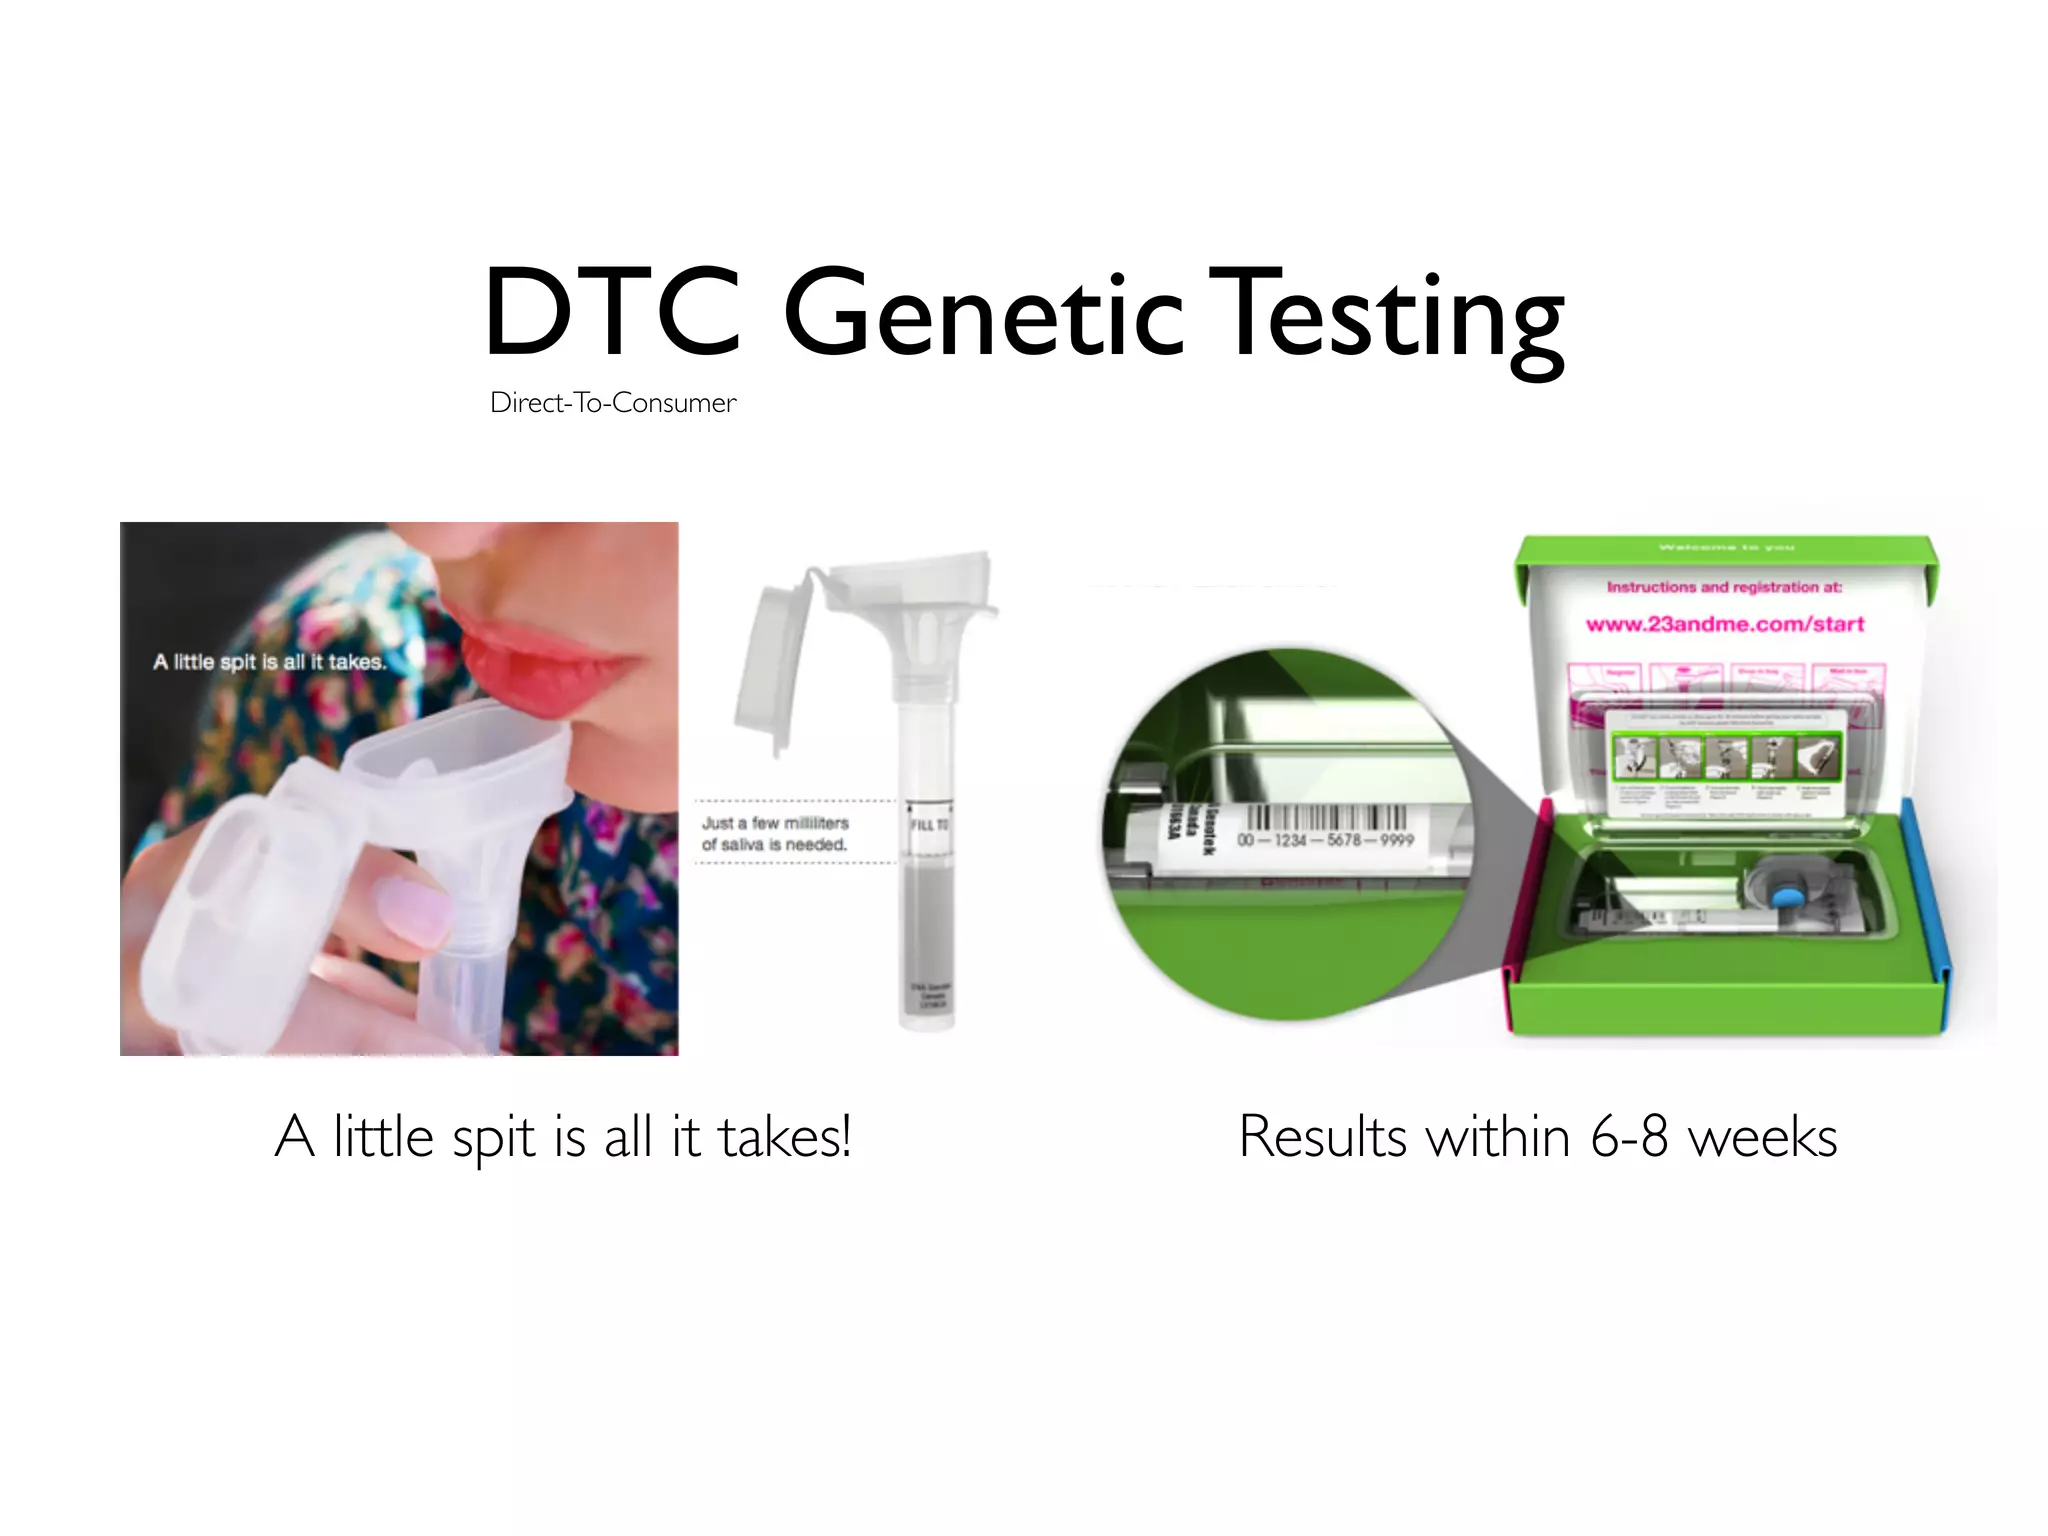
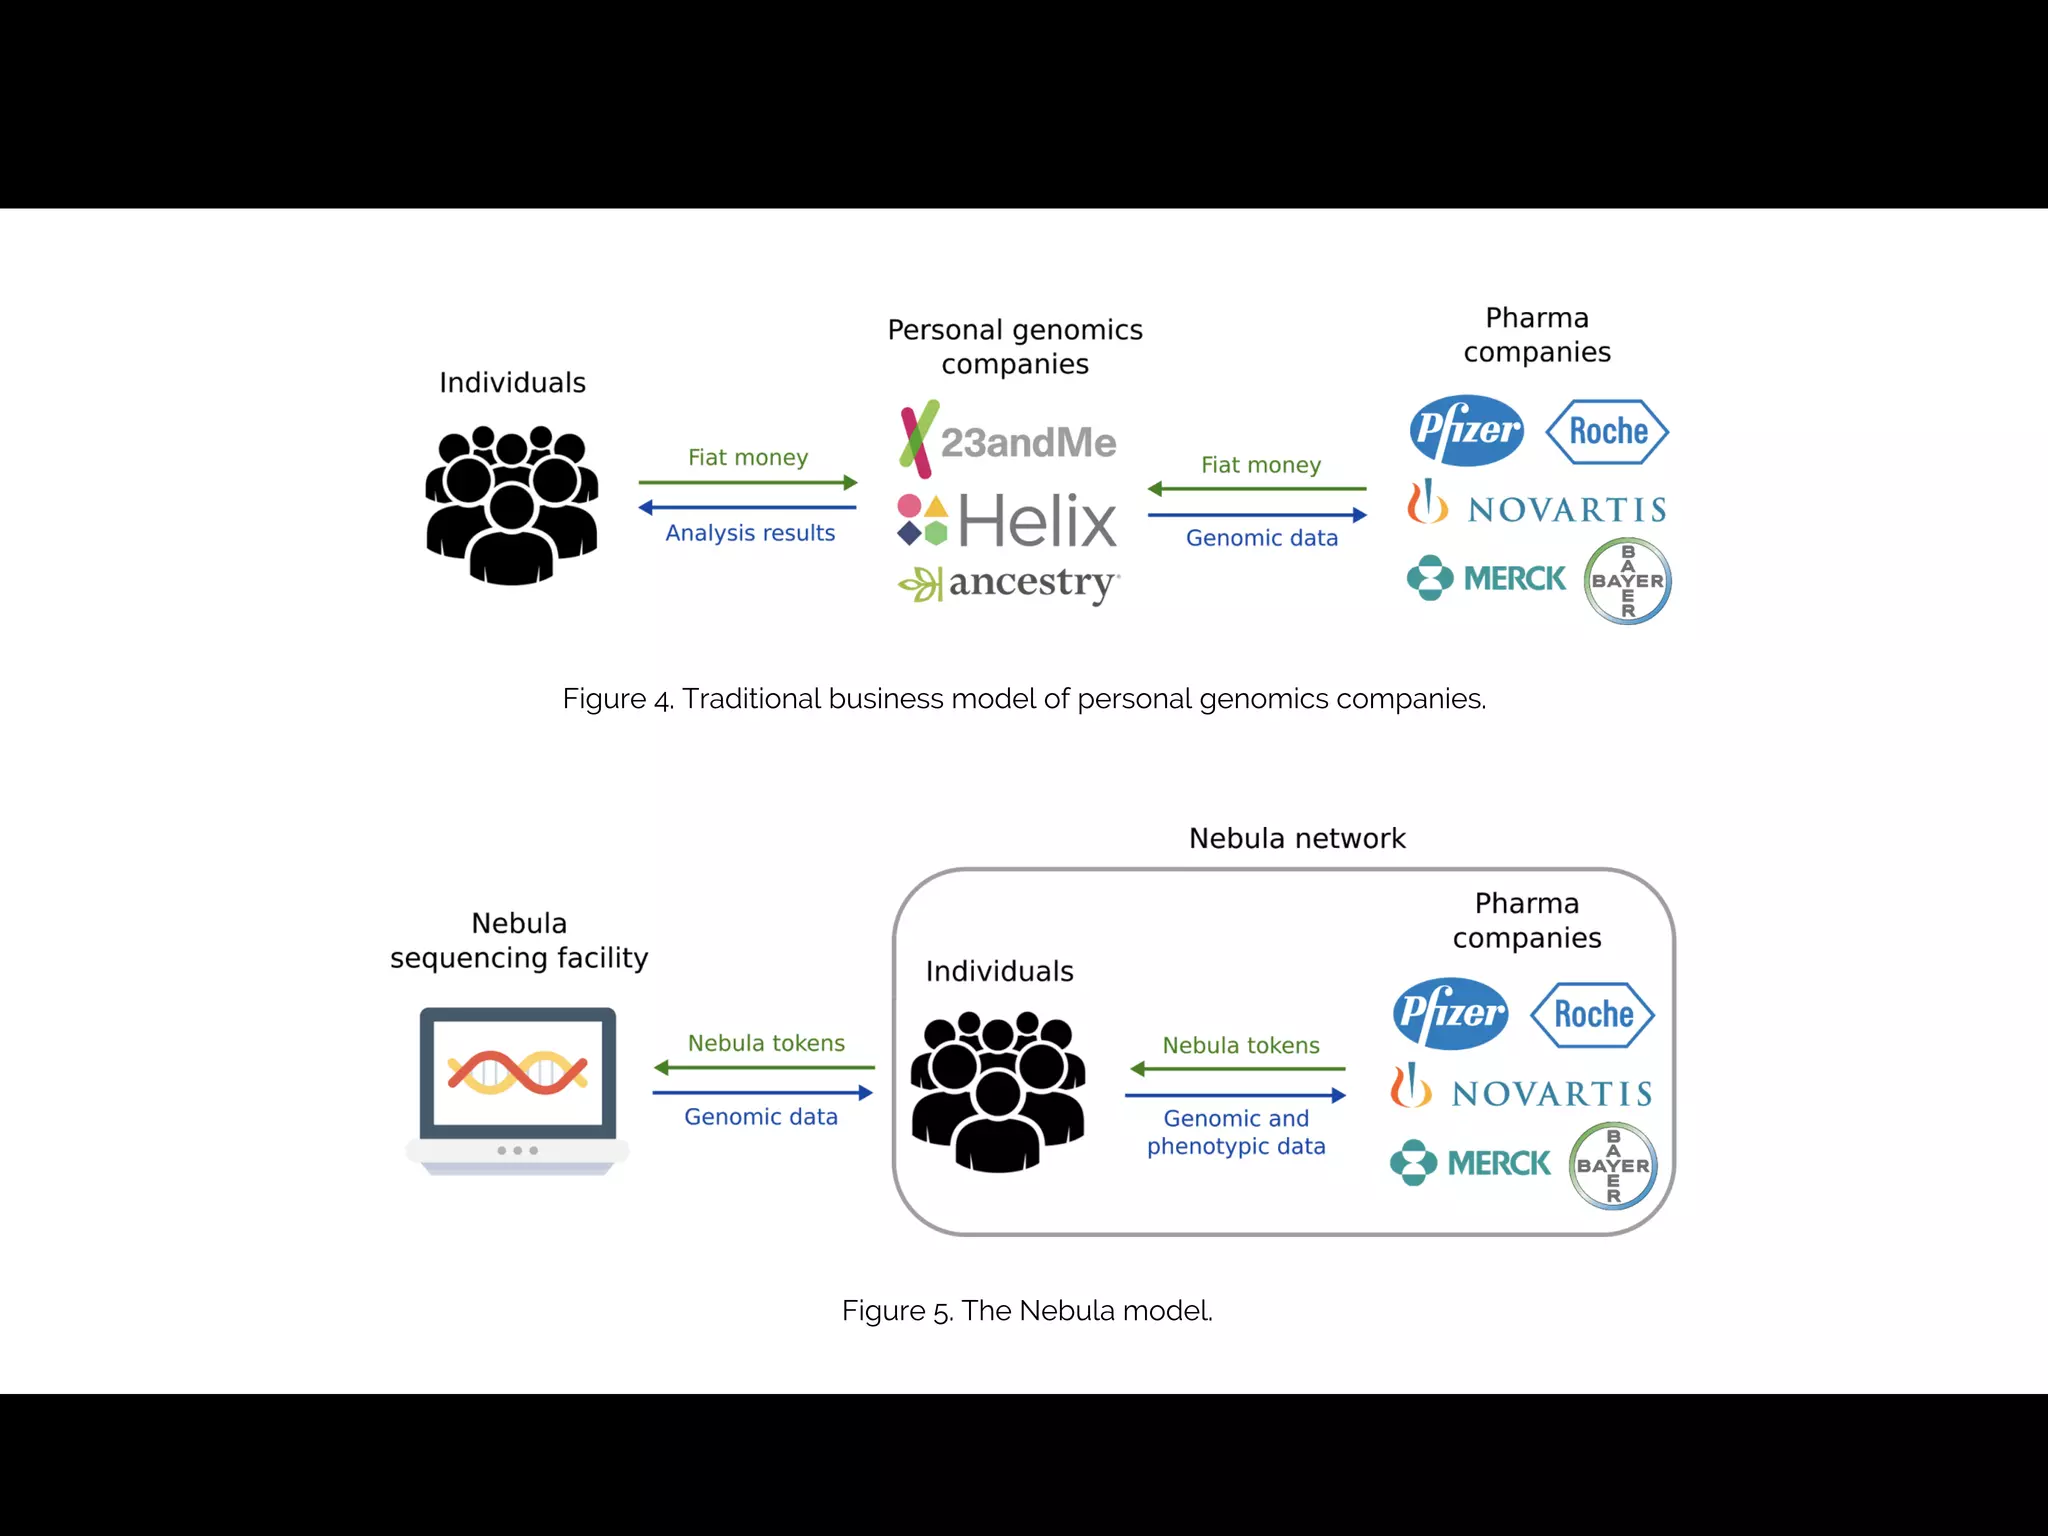
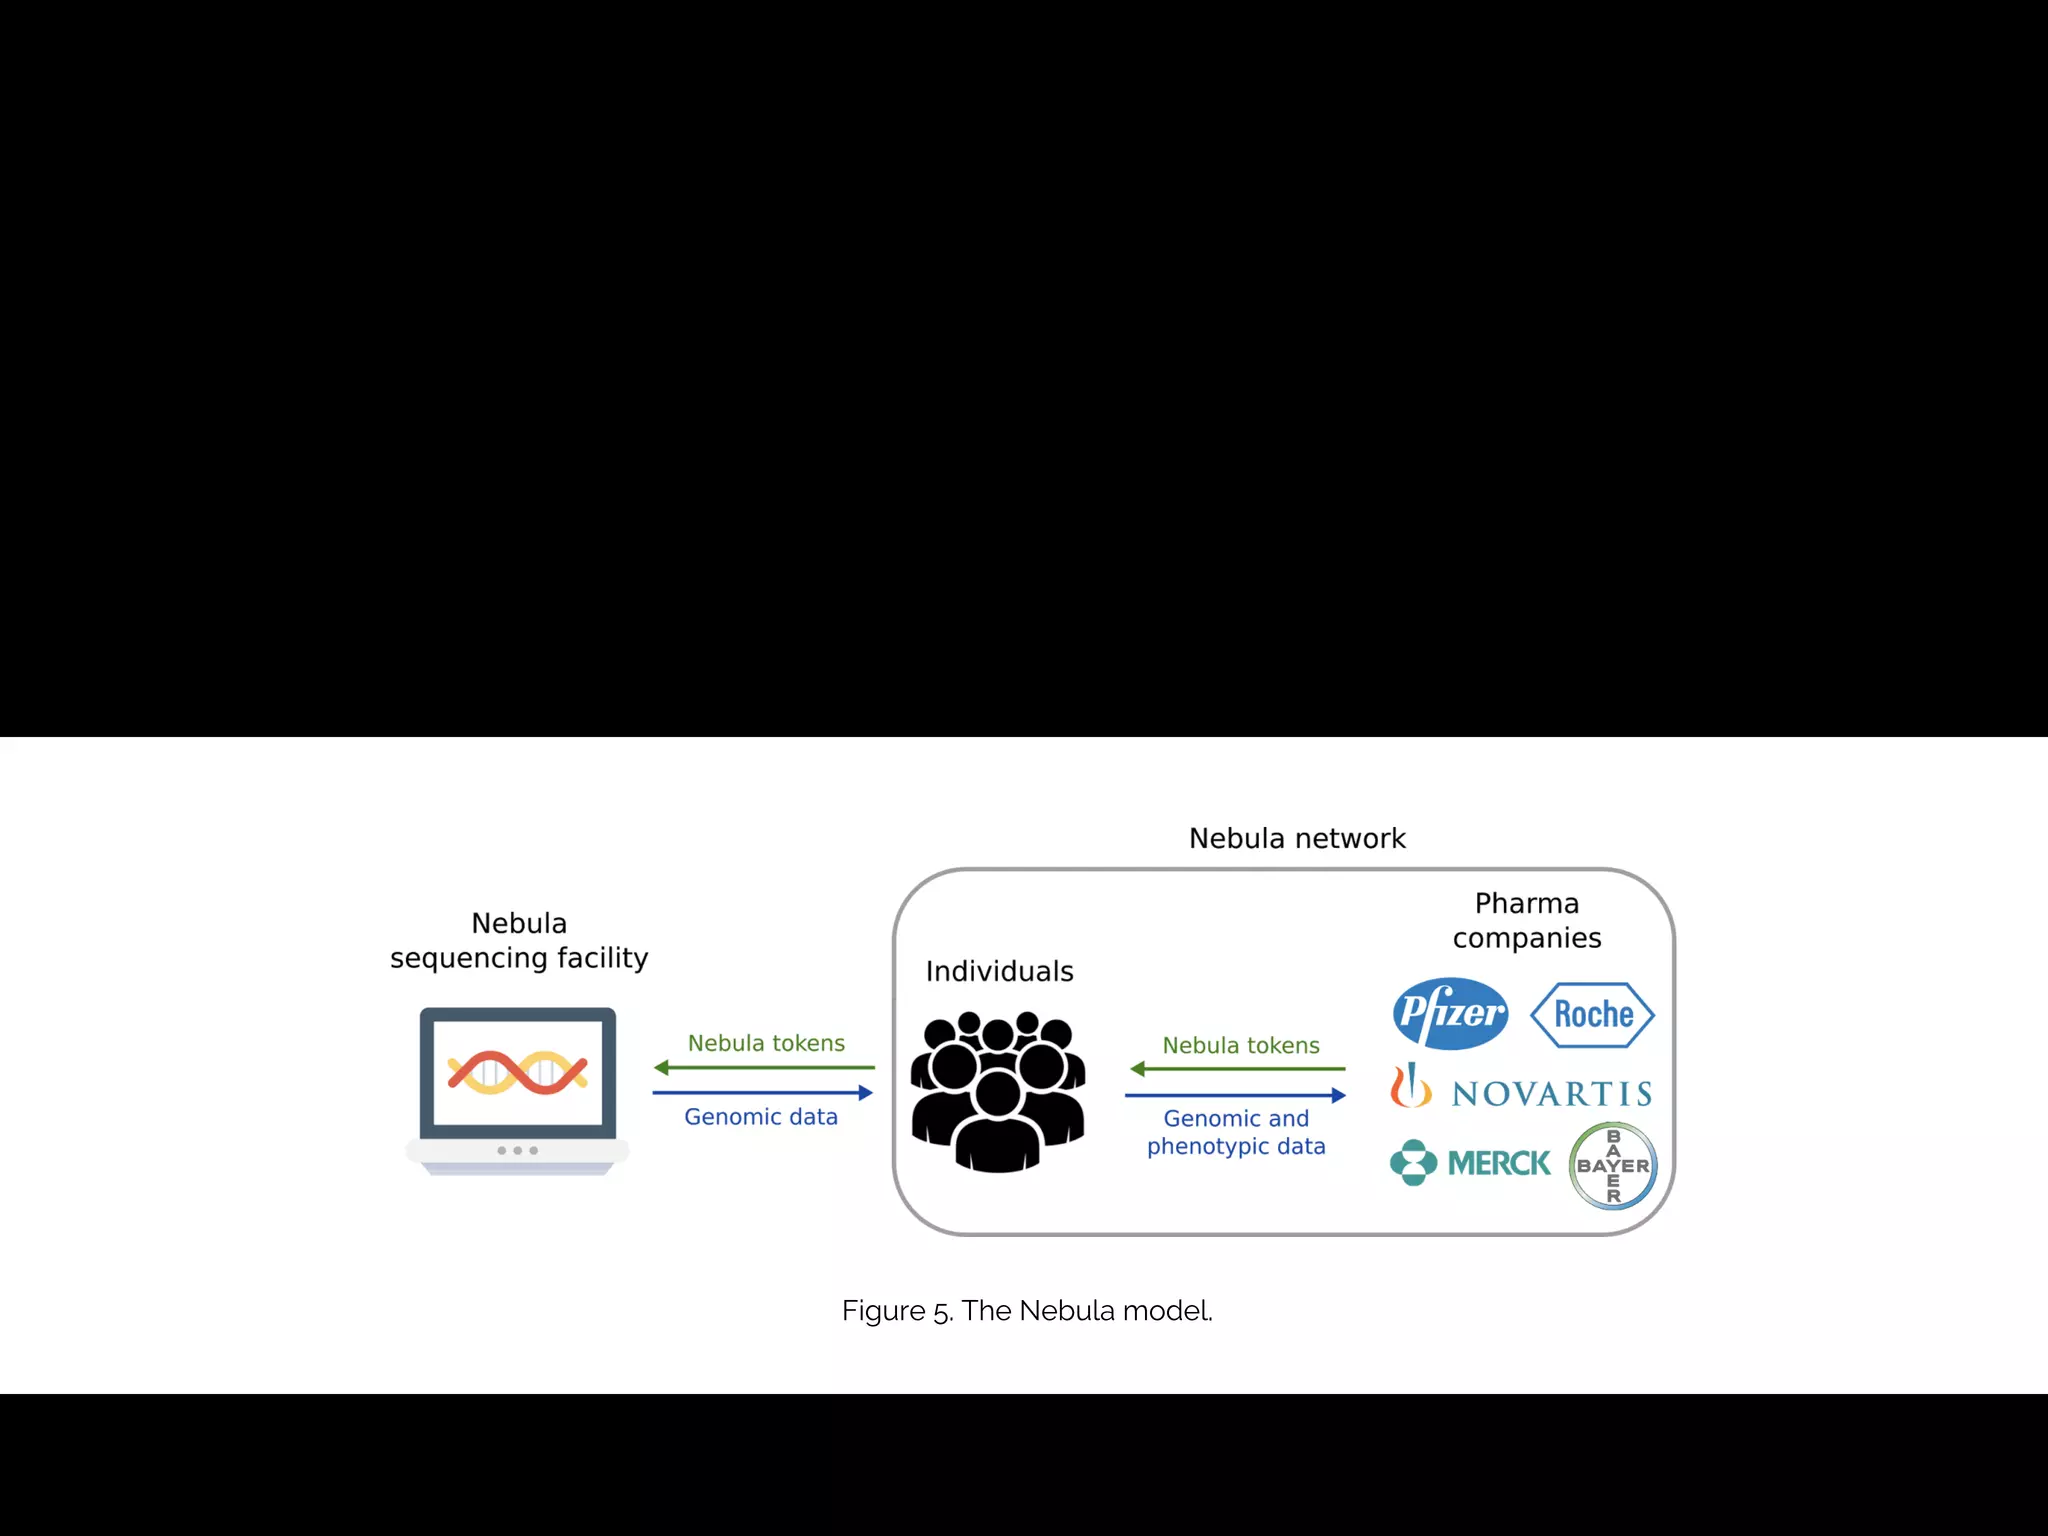
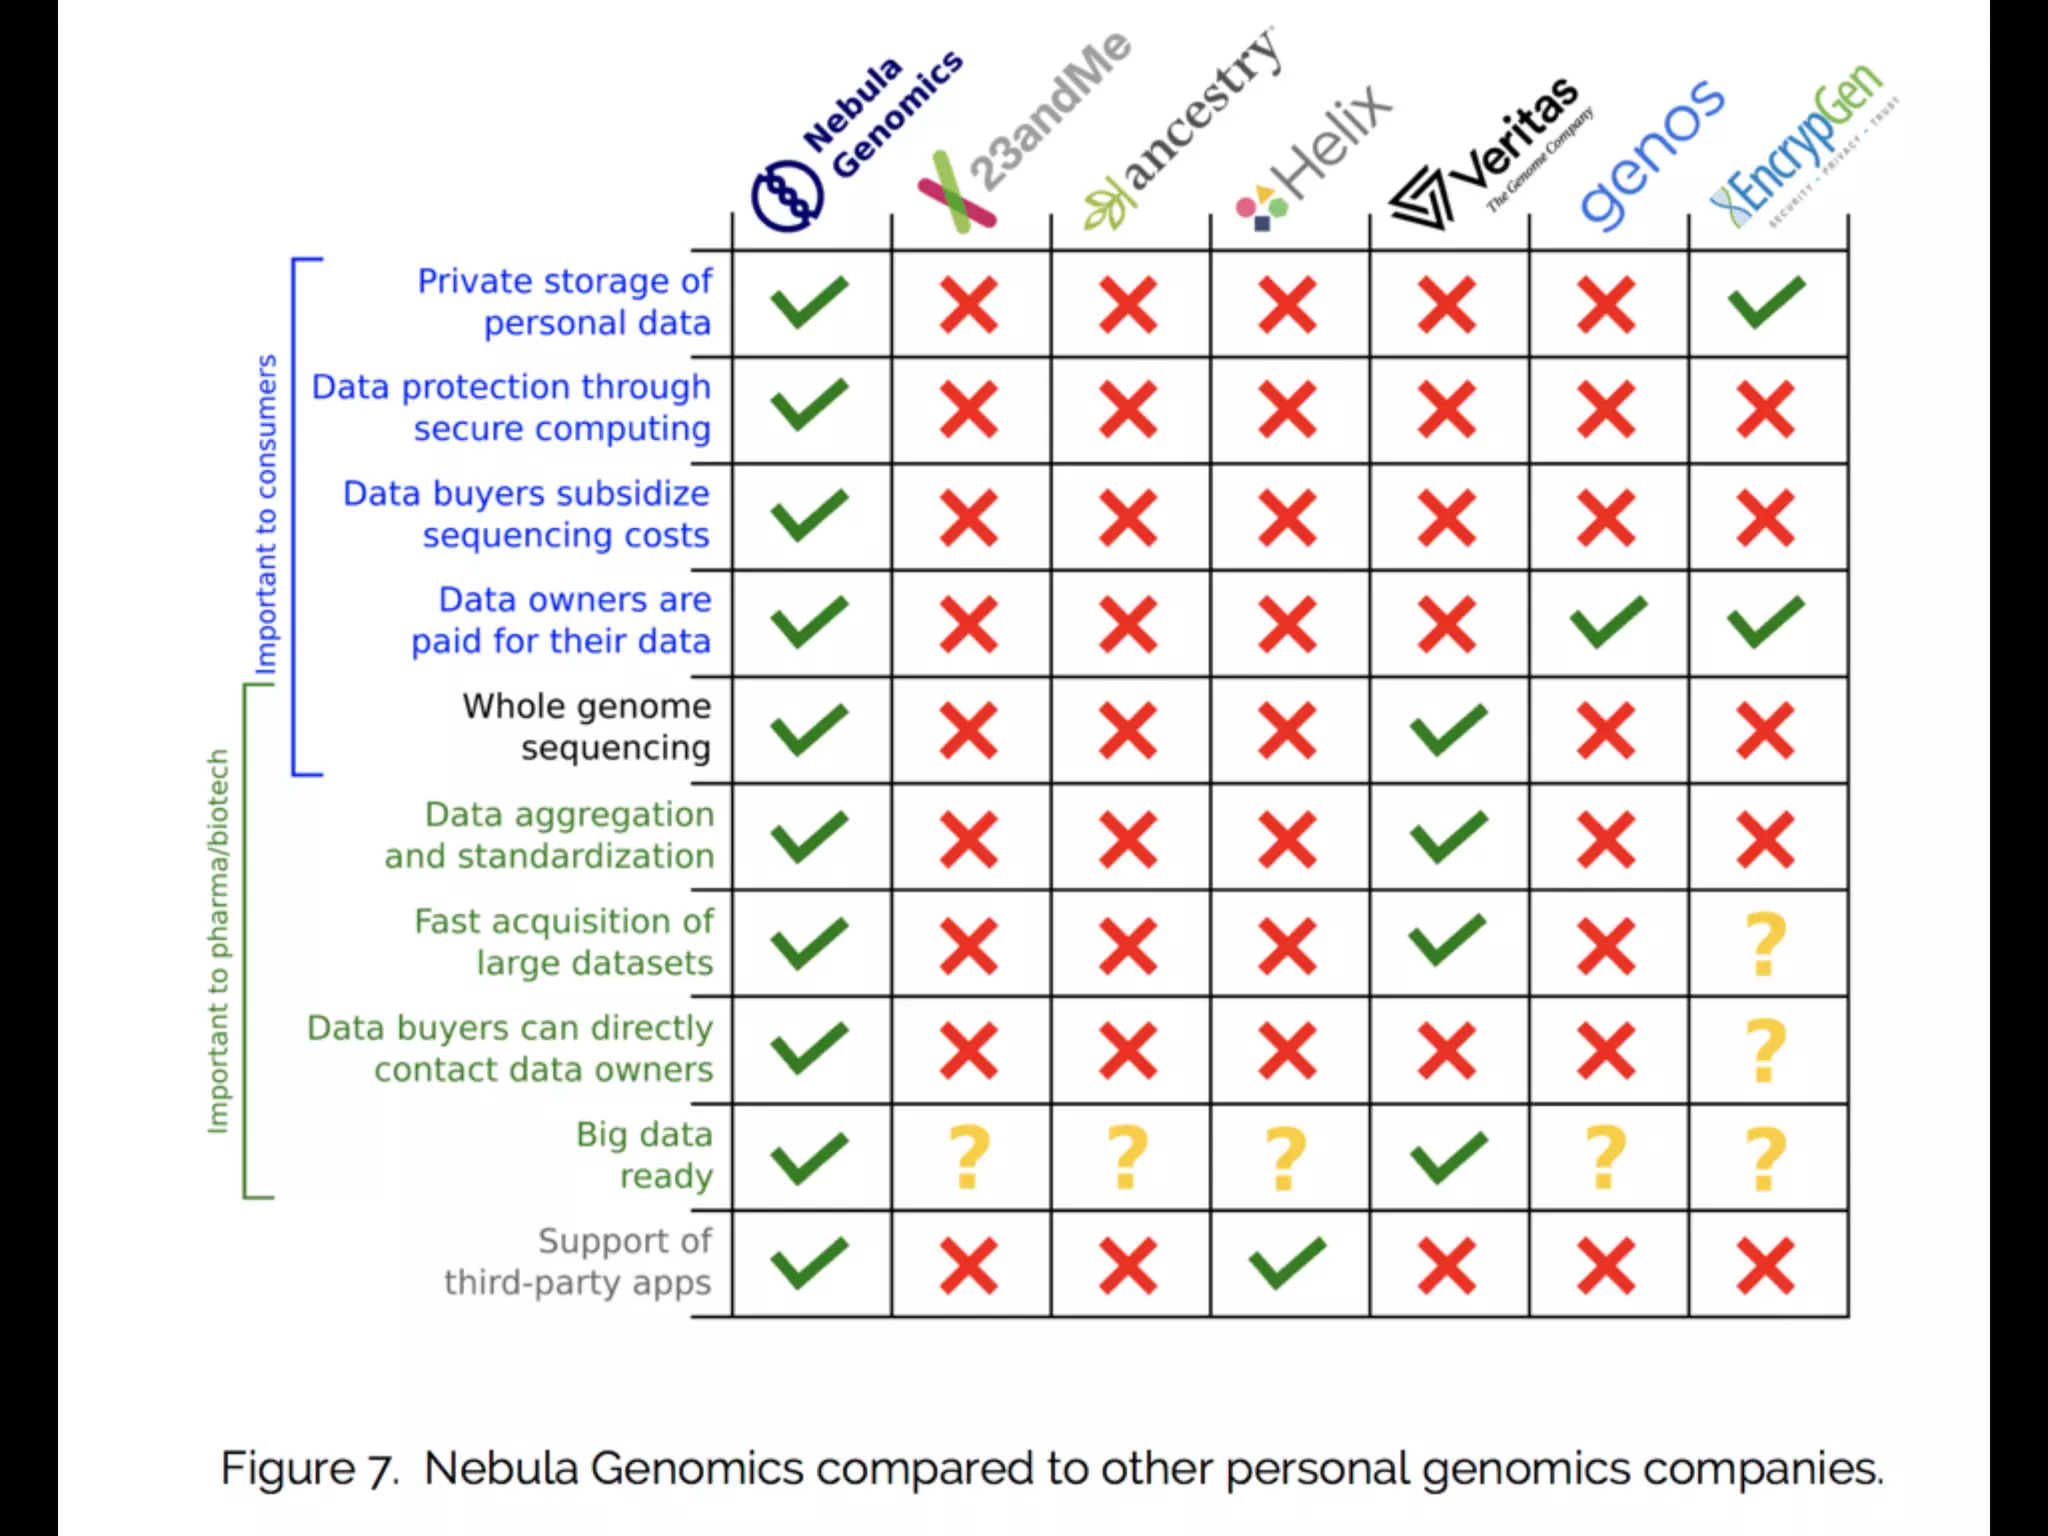
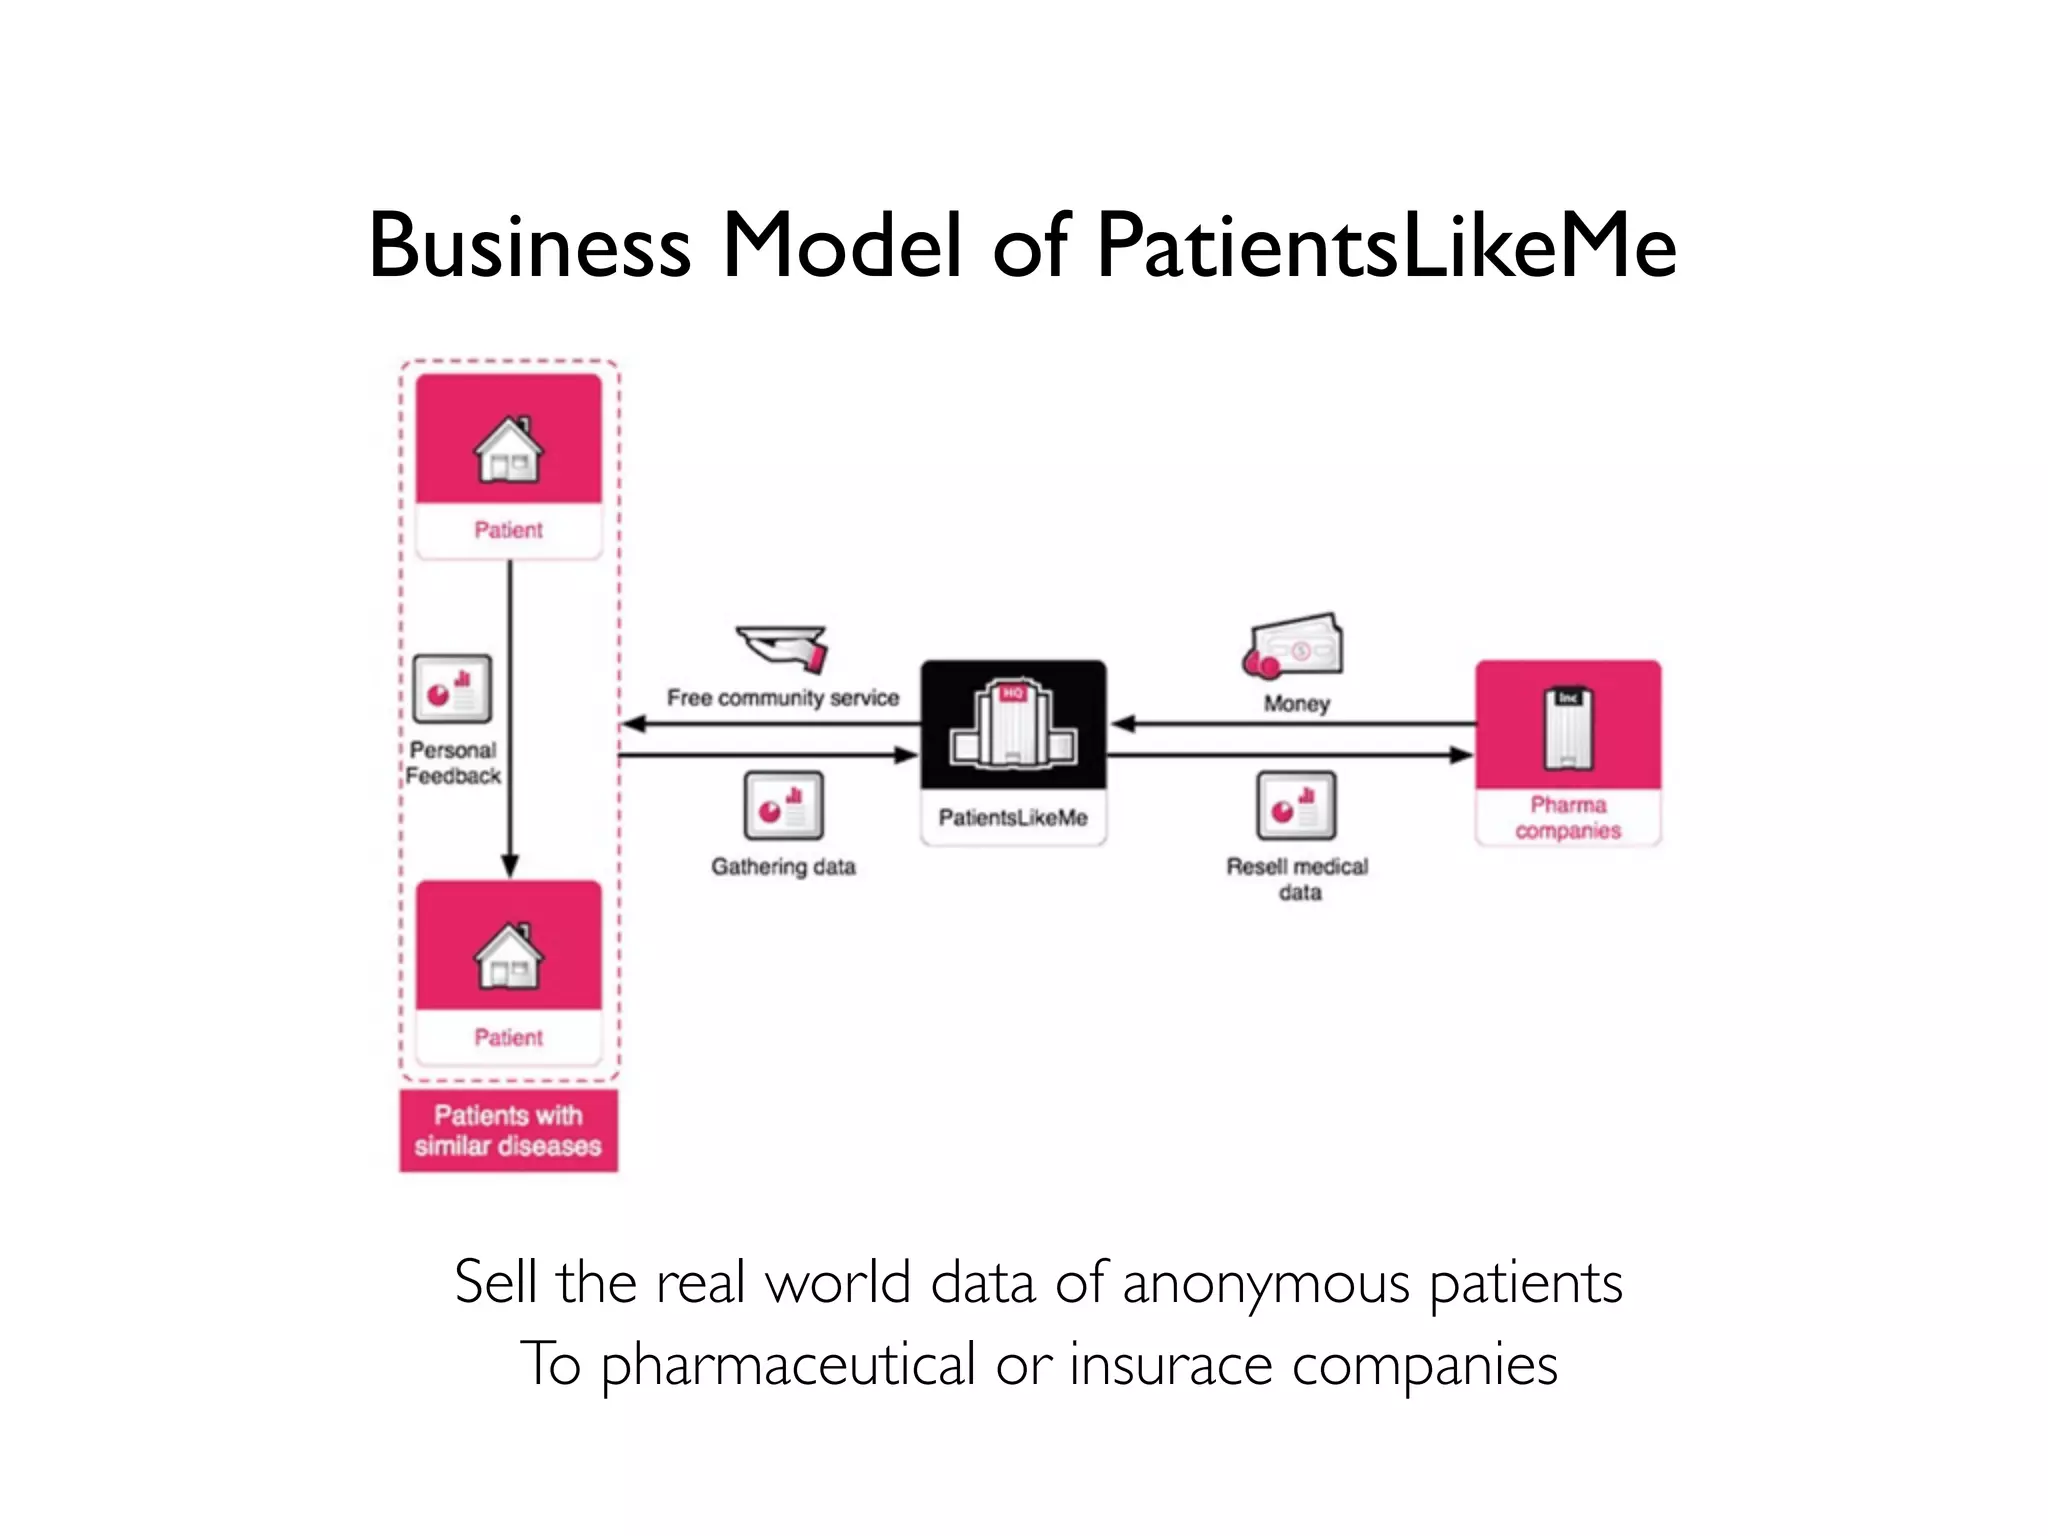
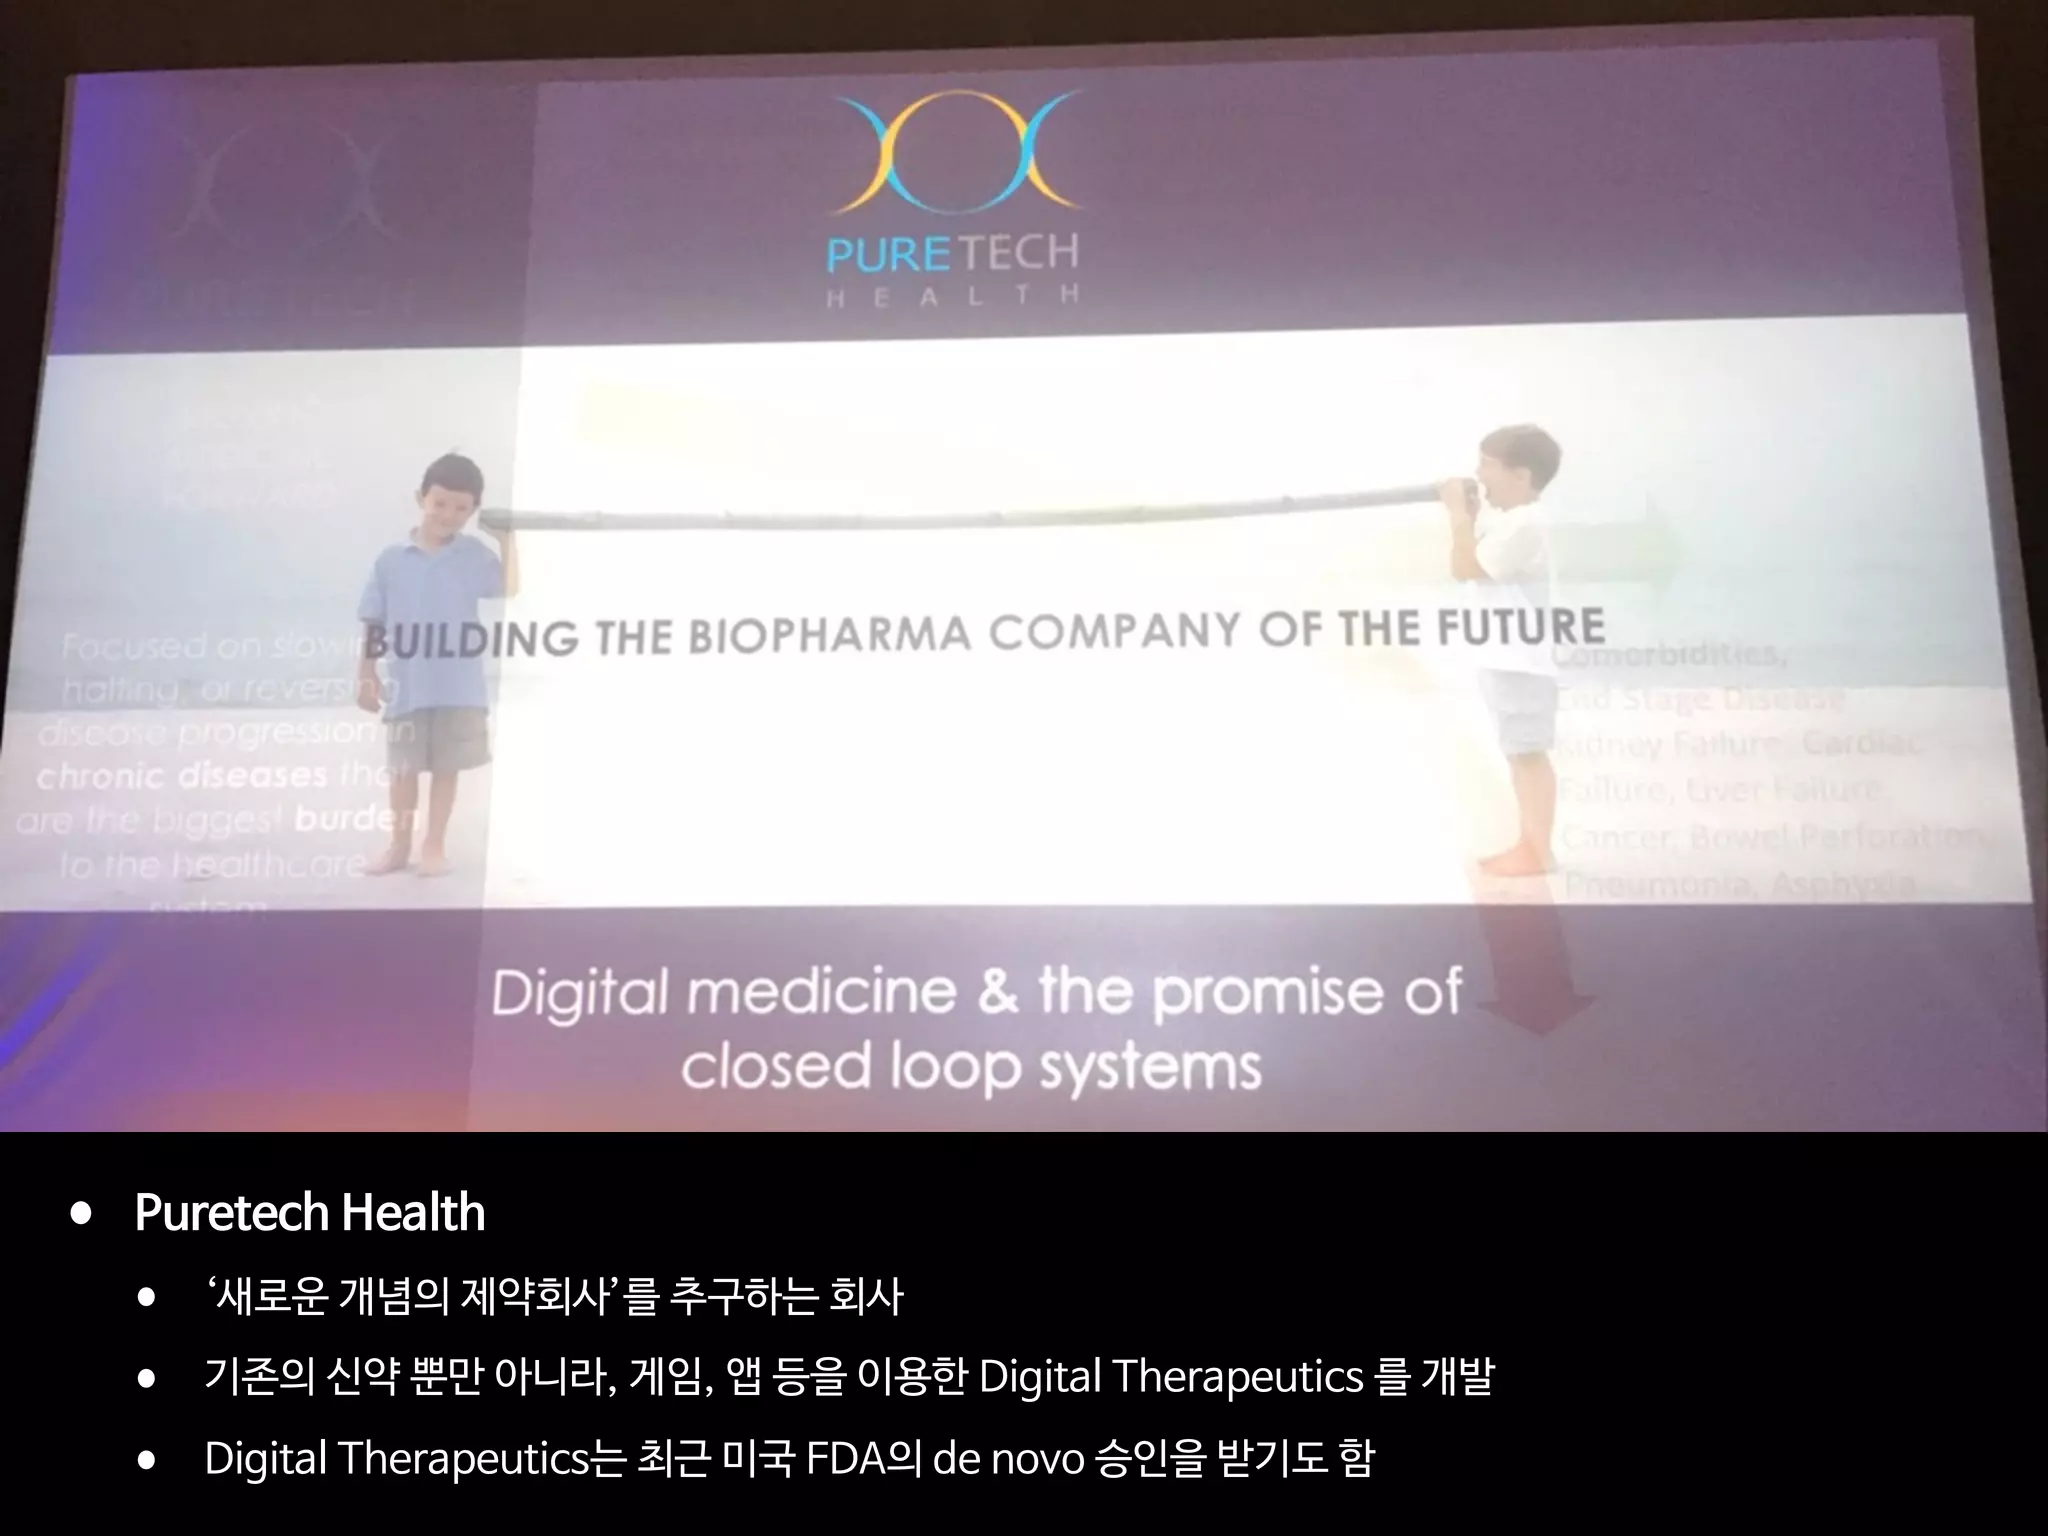
- The traditional business model of personal genomics companies sees individuals pay to sequence their genomes and receive analysis results, while the companies keep the genomic data and sell it to pharmaceutical companies. However, this model has limitations in addressing high sequencing costs for individuals, lack of individual control over their data, and lack of incentives. - The proposed Nebula model uses blockchain technology to connect individuals directly with data buyers, eliminating personal genomics companies as middlemen. This is intended to reduce sequencing costs for individuals, give them control over their genomic data and how it is used, and provide incentives. - The model aims to satisfy both individuals, by addressing the above issues, and data buyers' needs around data availability, acquisition, and


![[KNAPS] 포스트 코로나 시대, 제약 산업과 디지털 헬스케어](https://cdn.slidesharecdn.com/ss_thumbnails/knaps-210128022335-thumbnail.jpg?width=640&height=640&fit=bounds)


![[365mc] 디지털 헬스케어: 의료의 미래](https://cdn.slidesharecdn.com/ss_thumbnails/365mc-200317140059-thumbnail.jpg?width=640&height=640&fit=bounds)


![[C&C] 의료의 미래 디지털 헬스케어](https://cdn.slidesharecdn.com/ss_thumbnails/cc-200616080105-thumbnail.jpg?width=640&height=640&fit=bounds)


![[ASGO 2019] Artificial Intelligence in Medicine](https://cdn.slidesharecdn.com/ss_thumbnails/asgo2019medicalai191010-191010155811-thumbnail.jpg?width=640&height=640&fit=bounds)
![[대한병리학회] 의료 인공지능 101: 병리를 중심으로](https://cdn.slidesharecdn.com/ss_thumbnails/pathology-201106004112-thumbnail.jpg?width=640&height=640&fit=bounds)


