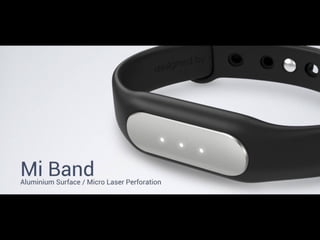
Professor Yoon Sup Choi discusses digital health and the future of healthcare centered around changes in the pharmaceutical industry. He notes that three key steps in implementing digital medicine are: 1) measuring data through devices like smartphones, wearables, and genetic analysis; 2) collecting the data; and 3) gaining insights from the data using artificial intelligence. Choi also provides an overview of the digital health industry landscape and increasing investment in digital health startups from pharmaceutical companies and other investors.
8. •2017년은 역대 디지털 헬스케어 스타트업 펀딩 중 최대의 해.
•투자횟수와 개별 투자의 규모도 역대 최고 수준을 기록
•$100m 을 넘는 mega deal 도 8건이 있었으며,
•이에 따라 기업가치 $1b이 넘는 유니콘 기업들이 상당수 생겨남.
https://rockhealth.com/reports/2017-year-end-funding-report-the-end-of-the-beginning-of-digital-health/
12. •최근 3년 동안 Merck, J&J, GSK 등의 제약사들의 디지털 헬스케어 분야 투자 급증
•2015-2016년 총 22건의 deal (=2010-2014년의 5년간 투자 건수와 동일)
•Merck 가 가장 활발: 2009년부터 Global Health Innovation Fund 를 통해 24건 투자 ($5-7M)
•GSK 의 경우 2014년부터 6건 (via VC arm, SR One): including Propeller Health
13.
14. 헬스케어넓은 의미의 건강 관리에는 해당되지만,
디지털 기술이 적용되지 않고, 전문 의료 영역도 아닌 것
예) 운동, 영양, 수면
디지털 헬스케어
건강 관리 중에 디지털 기술이 사용되는 것
예) 사물인터넷, 인공지능, 3D 프린터, VR/AR
모바일 헬스케어
디지털 헬스케어 중
모바일 기술이 사용되는 것
예) 스마트폰, 사물인터넷, SNS
개인 유전정보분석
예) 암유전체, 질병위험도,
보인자, 약물 민감도
예) 웰니스, 조상 분석
헬스케어 관련 분야 구성도(ver 0.3)
의료
질병 예방, 치료, 처방, 관리
등 전문 의료 영역
원격의료
원격진료
15. What is most important factor in digital medicine?
16. “Data! Data! Data!” he cried.“I can’t
make bricks without clay!”
- Sherlock Holmes,“The Adventure of the Copper Beeches”
17.
18. 새로운 데이터가
새로운 방식으로
새로운 주체에 의해
측정, 저장, 통합, 분석된다.
데이터의 종류
데이터의 질적/양적 측면
웨어러블 기기
스마트폰
유전 정보 분석
인공지능
SNS
사용자/환자
대중
19. Three Steps to Implement Digital Medicine
• Step 1. Measure the Data
• Step 2. Collect the Data
• Step 3. Insight from the Data
20. Digital Healthcare Industry Landscape
Data Measurement Data Integration Data Interpretation Treatment
Smartphone Gadget/Apps
DNA
Artificial Intelligence
2nd Opinion
Wearables / IoT
(ver. 3)
EMR/EHR 3D Printer
Counseling
Data Platform
Accelerator/early-VC
Telemedicine
Device
On Demand (O2O)
VR
Digital Healthcare Institute
Diretor, Yoon Sup Choi, Ph.D.
yoonsup.choi@gmail.com
21. Data Measurement Data Integration Data Interpretation Treatment
Smartphone Gadget/Apps
DNA
Artificial Intelligence
2nd Opinion
Device
On Demand (O2O)
Wearables / IoT
Digital Healthcare Institute
Diretor, Yoon Sup Choi, Ph.D.
yoonsup.choi@gmail.com
EMR/EHR 3D Printer
Counseling
Data Platform
Accelerator/early-VC
VR
Telemedicine
Digital Healthcare Industry Landscape (ver. 3)
47. BeyondVerbal
• 기계가 사람의 감정을 이해한다면?
• 헬스케어 분야에서도 응용도 높음: 슬픔/우울함/피로 등의 감정 파악
• 일부 보험 회사에서는 가입자의 우울증 여부 파악을 위해 이미 사용 중
• Aetna 는 2012년 부터 고객의 우울증 여부를 전화 목소리 분석으로 파악
• 기존의 방식에 비해 우울증 환자 6배 파악
• 사생활 침해 여부 존재
50. Digital Phenotype:
Your smartphone knows if you are depressed
J Med Internet Res. 2015 Jul 15;17(7):e175.
The correlation analysis between the features and the PHQ-9 scores revealed that 6 of the 10
features were significantly correlated to the scores:
• strong correlation: circadian movement, normalized entropy, location variance
• correlation: phone usage features, usage duration and usage frequency
51.
52. • 아이폰의 센서로 측정한 자신의 의료/건강 데이터를 플랫폼에 공유 가능
• 가속도계, 마이크, 자이로스코프, GPS 센서 등을 이용
• 걸음, 운동량, 기억력, 목소리 떨림 등등
• 기존의 의학연구의 문제를 해결: 충분한 의료 데이터의 확보
• 연구 참여자 등록에 물리적, 시간적 장벽을 제거 (1번/3개월 ➞ 1번/1초)
• 대중의 의료 연구 참여 장려: 연구 참여자의 수 증가
• 발표 후 24시간 내에 수만명의 연구 참여자들이 지원
• 사용자 본인의 동의 하에 진행
Research Kit
58. Autism and Beyond EpiWatchMole Mapper
measuring facial expressions of young
patients having autism
measuring morphological changes
of moles
measuring behavioral data
of epilepsy patients
59. •스탠퍼드의 심혈관 질환 연구 앱, myHeart
• 발표 하루만에 11,000 명의 참가자가 등록
• 스탠퍼드의 해당 연구 책임자 앨런 영,
“기존의 방식으로는 11,000명 참가자는
미국 전역의 50개 병원에서 1년간 모집해야 한다”
60. •파킨슨 병 연구 앱, mPower
• 발표 하루만에 5,589 명의 참가자가 등록
• 기존에 6000만불을 들여 5년 동안 모집한
환자의 수는 단 800명
65. Fig 1. What can consumer wearables do? Heart rate can be measured with an oximeter built into a ring [3], muscle activity with an electromyographi
sensor embedded into clothing [4], stress with an electodermal sensor incorporated into a wristband [5], and physical activity or sleep patterns via an
accelerometer in a watch [6,7]. In addition, a female’s most fertile period can be identified with detailed body temperature tracking [8], while levels of me
attention can be monitored with a small number of non-gelled electroencephalogram (EEG) electrodes [9]. Levels of social interaction (also known to a
PLOS Medicine 2016
66. PwC Health Research Institute Health wearables: Early days2
insurers—offering incentives for
use may gain traction. HRI’s survey
Source: HRI/CIS Wearables consumer survey 2014
21%
of US
consumers
currently
own a
wearable
technology
product
2%
wear it a few
times a month
2%
no longer
use it
7%
wear it a few
times a week
10%
wear it
everyday
Figure 2: Wearables are not mainstream – yet
Just one in five US consumers say they own a wearable device.
Intelligence Series sought to better
understand American consumers’
attitudes toward wearables through
done with the data.
PwC, Health wearables: early days, 2014
67. PwC | The Wearable Life | 3
device (up from 21% in 2014). And 36% own more than one.
We didn’t even ask this question in our previous survey since
it wasn’t relevant at the time. That’s how far we’ve come.
millennials are far more likely to own wearables than older
adults. Adoption of wearables declines with age.
Of note in our survey findings, however: Consumers aged
35 to 49 are more likely to own smart watches.
Across the board for gender, age, and ethnicity, fitness
wearable technology is most popular.
Fitness band
Smart clothing
Smart video/
photo device
(e.g. GoPro)
Smart watch
Smart
glasses*
45%
14%
27%
15%
12%
Base: Respondents who currently own at least one device (pre-quota sample, n=700); Q10A/B/C/D/E. Please tell us your relationship with the following wearable
technology products. *Includes VR/AR glasses
Fitness runs away with it
% respondents who own type of wearable device
PwC,The Wearable Life 2.0, 2016
• 49% own at least one wearable device (up from 21% in2014)
• 36% own more than one device.
72. •Fitbit이 임상연구에 활용되는 것은 크게 두 가지 경우
•Fitbit 자체가 intervention이 되어서 활동량이나 치료 효과를 증진시킬 수 있는지 여부
•연구 참여자의 활동량을 모니터링 하기 위한 수단
•1. Fitbit으로 환자의 활동량을 증가시키기 위한 연구들
•Fitbit이 소아 비만 환자의 활동량을 증가시키는지 여부를 연구
•Fitbit이 위소매절제술을 받은 환자들의 활동량을 증가시키는지 여부
•Fitbit이 젊은 낭성 섬유증 (cystic fibrosis) 환자의 활동량을 증가시키는지 여부
•Fitbit이 암 환자의 신체 활동량을 증가시키기 위한 동기부여가 되는지 여부
•2. Fitbit으로 임상 연구에 참여하는 환자의 활동량을 모니터링
•항암 치료를 받은 환자들의 건강과 예후를 평가하는데 fitbit을 사용
•현금이 자녀/부모의 활동량을 증가시키는지 파악하기 위해 fitbit을 사용
•Brain tumor 환자의 삶의 질 측정을 위해 다른 survey 결과와 함께 fitbit을 사용
•말초동맥 질환(Peripheral Artery Disease) 환자의 활동량을 평가하기 위해
73. •체중 감량이 유방암 재발에 미치는 영향을 연구
•유방암 환자들 중 20%는 재발, 대부분이 전이성 유방암
•과체중은 유방암의 위험을 높인다고 알려져 왔으며,
•비만은 초기 유방암 환자의 예후를 좋지 않게 만드는 것도 알려짐
•하지만, 체중 감량과 유방암 재발 위험도의 상관관계 연구는 아직 없음
•3,200 명의 과체중, 초기 비만 유방암 환자들이 2년간 참여
•결과에 따라 전세계 유방암 환자의 표준 치료에 체중 감량이 포함될 가능성
•Fitbit 이 체중 감량 프로그램에 대한 지원
•Fitbit Charge HR: 운동량, 칼로리 소모, 심박수 측정
•Fitbit Aria Wi-Fi Smart Scale: 스마트 체중계
•FitStar: 개인 맞춤형 동영상 운동 코칭 서비스
2016. 4. 27.
82. (“FREE VERTICAL MOMENTS AND TRANSVERSE FORCES IN HUMAN WALKING AND
THEIR ROLE IN RELATION TO ARM-SWING”,
YU LI*, WEIJIE WANG, ROBIN H. CROMPTON AND MICHAEL M. GUNTHER)
(“SYNTHESIS OF NATURAL ARM SWING MOTION IN HUMAN BIPEDAL WALKING”,
JAEHEUNG PARK)
︎
Right Arm
Left Foot
Left Arm
Right Foot
“보행 시 팔의 움직임은 몸의 역학적 균형을 맞추기 위한 자동적인 행동
으로, 반대쪽 발의 움직임을 관찰할 수 있는 지표”
보행 종류에 따른 신체 운동 궤도의 변화
발의 모양 팔의 스윙 궤도
일반 보행
팔자 걸음
구부린 걸음
직토 워크에서 수집하는 데이터
종류 설명 비고
충격량 발에 전해지는 충격량 분석 Impact Score
보행 주기 보행의 주기 분석 Interval Score
보폭 단위 보행 시의 거리 Stride(향후 보행 분석 고도화용)
팔의 3차원 궤도 걸음에 따른 팔의 움직임 궤도 팔의 Accel,Gyro Data 취합
보행 자세 상기 자료를 분석한 보행 자세 분류 총 8가지 종류로 구분
비대칭 지수 신체 부위별(어깨, 허리, 골반) 비대칭 점수 제공 1주일 1회 반대쪽 손 착용을 통한 데이터 취득 필요
걸음걸이 템플릿 보행시 발생하는 특이점들을 추출하여 개인별 템플릿 저장 생체 인증 기능용
with the courtesy of ZIKTO, Inc
104. IEEE Trans Biomed Eng. 2014 Jul
An Ingestible Sensor
for Measuring Medication Adherence
d again on
imal was
ysis were
s detected,
risk of
ed with a
his can be
s during
can be
on, placed
filling, or
an edible
monstrated
cases, the
nts of the
ve release
ity, visual
a suitable
The 0.9% of devices that went undetected represent
contributions from all components of the system. For the
sensor, the most likely contribution is due to physiological
corner cases, where a combination of stomach environment
and receiver-sensor orientation may result in a small
proportion of devices (no greater than 0.9%) being missed.
Table IV- Exposure and performance in clinical trials
412 subjects
20,993 ingestions
Maximum daily ingestion: 34
Maximum use days: 90 days
99.1% Detection accuracy
100% Correct identification
0% False positives
No SAEs / UADEs related to system
Trials were conducted in the following patient populations. The number of
patients in each study is indicated in parentheses: Healthy Volunteers (296),
Cardiovascular disease (53), Tuberculosis (30), Psychiatry (28).
SAE = Serious Adverse Event; UADE = Unanticipated Adverse Device
Effect)
Exposure and performance in clinical trials
105. Jan 12, 2015
Clinical trial researchers using Oracle’s
software will now be able to track
patients’ medication adherence with
Proteus’s technology.
- Measuring participant adherence to
drug protocols
- Identifying the optimum dosing
regimen for recommended use
106. Sep 10, 2015
Proteus and Otsuka have submitted a sensor-embedded version
of the antidepressant Abilify for FDA approval.
128. Inherited Conditions
혈색소증은 유전적 원인으로 철에 대한 체내 대사에 이상이 생겨 음식을
통해 섭취한 철이 너무 많이 흡수되는 질환입니다. 너무 많이 흡수된 철
은 우리 몸의 여러 장기, 특히 간, 심장 및 췌장에 과다하게 축적되며 이
들 장기를 손상시킴으로써 간질환, 심장질환 및 악성종양을 유발합니다.
129. Traits
음주 후 얼굴이 붉어지는가
쓴 맛을 감지할 수 있나
귀지 유형
눈 색깔
곱슬머리 여부
유당 분해 능력
말라리아 저항성
대머리가 될 가능성
근육 퍼포먼스
혈액형
노로바이러스 저항성
HIV 저항성
흡연 중독 가능성
134. https://www.23andme.com/slideshow/research/
고객의 자발적인 참여에 의한 유전학 연구
깍지를 끼면 어느 쪽 엄지가 위로 오는가?
아침형 인간? 저녁형 인간?
빛에 노출되었을 때 재채기를 하는가?
근육의 퍼포먼스
쓴 맛 인식 능력
음주 후 얼굴이 붉어지나?
유당 분해 효소 결핍?
고객의 81%가 10개 이상의 질문에 자발적 답변
매주 1 million 개의 data point 축적
The More Data, The Higher Accuracy!
136. Human genomes are being sequenced at an ever-increasing rate. The 1000 Genomes Project has
aggregated hundreds of genomes; The Cancer Genome Atlas (TGCA) has gathered several thousand; and
the Exome Aggregation Consortium (ExAC) has sequenced more than 60,000 exomes. Dotted lines show
three possible future growth curves.
DNA SEQUENCING SOARS
2001 2005 2010 2015 2020 2025
100
103
106
109
Human Genome Project
Cumulativenumberofhumangenomes
1000 Genomes
TCGA
ExAC
Current amount
1st personal genome
Recorded growth
Projection
Double every 7 months (historical growth rate)
Double every 12 months (Illumina estimate)
Double every 18 months (Moore's law)
Michael Einsetein, Nature, 2015
137. more rapid and accurate approaches to infectious diseases. The driver mutations and key biologic unde
Sequencing Applications in Medicine
from Prewomb to Tomb
Cell. 2014 Mar 27; 157(1): 241–253.
140. ers, Jared B Hawkins & John S Brownstein
phenotypes captured to enhance health and wellness will extend to human interactions with
st Richard
pt of the
hat pheno-
biological
sis or tissue
effects that
or outside
m.Dawkins
phenotypes
can modify
difications
onsofone’s
ended phe-
cites damn
thebeaver’s
ncreasingly
there is an
heory—the
aspects of
ehowdiag-
Jan. 2013
0.000
0.002
0.004
Density
0.006
July 2013 Jan. 2014 July 2014
User 1
User 2
User 3
User 4
User 5
User 6
User 7
Date
Figure 1 Timeline of insomnia-related tweets from representative individuals. Density distributions
(probability density functions) are shown for seven individual users over a two-year period. Density on
the y axis highlights periods of relative activity for each user. A representative tweet from each user is
Your twitter knows if you cannot sleep
Timeline of insomnia-related tweets from representative individuals.
Nat. Biotech. 2015
141. Reece & Danforth, “Instagram photos reveal predictive markers of depression” (2016)
higher Hue (bluer)
lower Saturation (grayer)
lower Brightness (darker)
인스타그램으로 당신이 우울한지 알 수 있을까?
142. Rao (MVR) (24) .
Results
Both Alldata and Prediagnosis models were decisively superior to a null model
. Alldata predictors were significant with 99% probability.57.5;(KAll = 1 K 49.8) Pre = 1 7
Prediagnosis and Alldata confidence levels were largely identical, with two exceptions:
Prediagnosis Brightness decreased to 90% confidence, and Prediagnosis posting frequency
dropped to 30% confidence, suggesting a null predictive value in the latter case.
Increased hue, along with decreased brightness and saturation, predicted depression. This
means that photos posted by depressed individuals tended to be bluer, darker, and grayer (see
Fig. 2). The more comments Instagram posts received, the more likely they were posted by
depressed participants, but the opposite was true for likes received. In the Alldata model, higher
posting frequency was also associated with depression. Depressed participants were more likely
to post photos with faces, but had a lower average face count per photograph than healthy
participants. Finally, depressed participants were less likely to apply Instagram filters to their
posted photos.
Fig. 2. Magnitude and direction of regression coefficients in Alldata (N=24,713) and Prediagnosis (N=18,513)
models. Xaxis values represent the adjustment in odds of an observation belonging to depressed individuals, per
Reece & Danforth, “Instagram photos reveal predictive markers of depression” (2016)
Fig. 1. Comparison of HSV values. Right photograph has higher Hue (bluer), lower Saturation (grayer), and lower
Brightness (darker) than left photograph. Instagram photos posted by depressed individuals had HSV values
shifted towards those in the right photograph, compared with photos posted by healthy individuals.
Units of observation
In determining the best time span for this analysis, we encountered a difficult question:
When and for how long does depression occur? A diagnosis of depression does not indicate the
persistence of a depressive state for every moment of every day, and to conduct analysis using an
individual’s entire posting history as a single unit of observation is therefore rather specious. At
the other extreme, to take each individual photograph as units of observation runs the risk of
being too granular. DeChoudhury et al. (5) looked at all of a given user’s posts in a single day,
and aggregated those data into perperson, perday units of observation. We adopted this
precedent of “userdays” as a unit of analysis . 5
Statistical framework
We used Bayesian logistic regression with uninformative priors to determine the strength
of individual predictors. Two separate models were trained. The Alldata model used all
collected data to address Hypothesis 1. The Prediagnosis model used all data collected from
higher Hue (bluer)
lower Saturation (grayer)
lower Brightness (darker)
Digital Phenotype:
Your Instagram knows if you are depressed
143. Digital Phenotype:
Your Instagram knows if you are depressed
Reece & Danforth, “Instagram photos reveal predictive markers of depression” (2016)
. In particular, depressedχ2 07.84, p .17e 64;( All = 9 = 9 − 1 13.80, p .87e 44)χ2Pre = 8 = 2 − 1
participants were less likely than healthy participants to use any filters at all. When depressed
participants did employ filters, they most disproportionately favored the “Inkwell” filter, which
converts color photographs to blackandwhite images. Conversely, healthy participants most
disproportionately favored the Valencia filter, which lightens the tint of photos. Examples of
filtered photographs are provided in SI Appendix VIII.
Fig. 3. Instagram filter usage among depressed and healthy participants. Bars indicate difference between observed
and expected usage frequencies, based on a Chisquared analysis of independence. Blue bars indicate
disproportionate use of a filter by depressed compared to healthy participants, orange bars indicate the reverse.
144. Digital Phenotype:
Your Instagram knows if you are depressed
Reece & Danforth, “Instagram photos reveal predictive markers of depression” (2016)
VIII. Instagram filter examples
Fig. S8. Examples of Inkwell and Valencia Instagram filters. Inkwell converts
color photos to blackandwhite, Valencia lightens tint. Depressed participants
most favored Inkwell compared to healthy participants, Healthy participants
146. ‘Facebook for Patients’, PatientsLikeMe.com
Stephen Heywood
Benjamin Heywood
James Heywood
Jeff Cole
• In 2004, three MIT engineers established the service for their own brother
who was suffered from ALS.
• Until 2011, only patients of 22 chronic disease, including ALS, HIV, Parkinson’s.
149. Users can find and friends with patients like them,
based on disease, stage, age, sex ...
Finding Patients Like Me!
150. Patines can keep their medical journals in the ‘Wall’,
recording conditions, treatments, symptoms…
(They don’t have to lie, because it’s totally anonymous)
151. Medications he/she took
‘Real World’ Feedback from the Patients
• How long he/she took the medication
• Purpose for which he/she took the medication
• Dose of the medication
• Efficacy / side-effect of the medication
153. X 10,000
personal journal personal journal personal journal
personal journal personal journal
Big Medical Data
154. Business Model of PatientsLikeMe
Sell the real world data of anonymous patients
To pharmaceutical or insurace companies
157. “FDA will assess the platform’s feasibility as a way
to generate adverse event reports, which the FDA
uses to regulate drugs after their release into the
market.”
2015.6.15
161. The main side effect reported by PatientsLikeMe users on selective
serotonin reuptake inhibitor (SSRI) Lexapro (escitalopram) was
“Decreased sex drive (libido),” at 24% (n = 149),
whereas the clinical trial data on Lexapro report 3% (n = 715)
Nat Biotech 2009 Brownstein et al.
http://www.nature.com/nbt/journal/v27/n10/full/nbt1009-888.html#close
162.
163. Step1. Measure the Data
• With your smartphone
• With wearable devices (connected to smartphone)
• Personal genome analysis
• Social Media
... without even going to the hospital!
170. Epic MyChart Epic EHR
Dexcom CGM
Patients/User
Devices
EHR Hospital
Whitings
+
Apple Watch
Apps
HealthKit
171.
172. • 애플 HealthKit 가 미국의 23개 선도병원 중에, 14개의 병원과 협력
• 경쟁 플랫폼 Google Fit, S-Health 보다 현저히 빠른 움직임
• Beth Israel Deaconess 의 CIO
• “25만명의 환자들 중 상당수가 웨어러블로 각종 데이터 생산 중.
이 모든 디바이스에 인터페이스를 우리 병원은 제공할 수 없다.
하지만 애플이라면 가능하다.”
2015.2.5
173. • 버릴리(구글)의 베이스라인 프로젝트
• 건강과 질병을 새롭게 정의하기 위한 프로젝트
• 4년 동안 만 명의 개인의 건강 상태를 면밀하게 추적하여 데이터를 축적
• 심박수와 수면패턴 및 유전 정보, 감정 상태, 진료기록, 가족력, 소변/타액/혈액 검사 등
174.
175. NatureAmerica,Inc.,partofSpringerNature.Allrightsreserved.
Intro
a
b
Round 1 Coaching sessions Round 2 Coaching sessions Round 3 Coaching sessions
Month 1 Month 2 Month 3 Month 4 Month 5 Month 6 Month 7 Month 8 Month 9
Clinical labs
Cardiovascular
HDL/LDL cholesterol, triglycerides,
particle profiles, and other markers
Blood sample
Metabolomics
Xenobiotics and metabolism-related
small molecules
Blood sample
Diabetes risk
Fasting glucose, HbA1c, insulin,
and other markers
Blood sample
Inflammation
IL-6, IL-8, and other markers
Blood sample
Nutrition and toxins
Ferritin, vitamin D, glutathione, mercury,
lead, and other markers
Blood sample
Genetics
Whole genome sequence
Blood sample
Proteomics
Inflammation, cardiovascular, liver,
brain, and heart-related proteins
Blood sample
Gut microbiome
16S rRNA sequencing
Stool sample
Quantified self
Daily activity
Activity tracker
Stress
Four-point cortisol
Saliva
Nature Biotechnology 2017
178. •iCarbonX
•중국 BGI의 대표였던 준왕이 창업
•'모든 데이터를 측정'하고 이를 정밀 의료에 활용할 계획
•데이터를 측정할 수 있는 역량을 가진 회사에 투자 및 인수
•SomaLogic, HealthTell, PatientsLikMe
•향후 5년 동안 100만명-1000만 명의 데이터 모을 계획
•이 데이터의 분석은 인공지능으로
189. 600,000 pieces of medical evidence
2 million pages of text from 42 medical journals and clinical trials
69 guidelines, 61,540 clinical trials
IBM Watson on Medicine
Watson learned...
+
1,500 lung cancer cases
physician notes, lab results and clinical research
+
14,700 hours of hands-on training
190.
191.
192.
193.
194. Annals of Oncology (2016) 27 (suppl_9): ix179-ix180. 10.1093/annonc/mdw601
Validation study to assess performance of IBM cognitive
computing system Watson for oncology with Manipal
multidisciplinary tumour board for 1000 consecutive cases:
An Indian experience
• MMDT(Manipal multidisciplinary tumour board) treatment recommendation and
data of 1000 cases of 4 different cancers breast (638), colon (126), rectum (124)
and lung (112) which were treated in last 3 years was collected.
• Of the treatment recommendations given by MMDT, WFO provided
50% in REC, 28% in FC, 17% in NREC
• Nearly 80% of the recommendations were in WFO REC and FC group
• 5% of the treatment provided by MMDT was not available with WFO
• The degree of concordance varied depending on the type of cancer
• WFO-REC was high in Rectum (85%) and least in Lung (17.8%)
• high with TNBC (67.9%); HER2 negative (35%)
• WFO took a median of 40 sec to capture, analyze and give the treatment.
(vs MMDT took the median time of 15 min)
195. WFO in ASCO 2017
• Early experience with IBM WFO cognitive computing system for lung
and colorectal cancer treatment (마니팔 병원)
• 지난 3년간: lung cancer(112), colon cancer(126), rectum cancer(124)
• lung cancer: localized 88.9%, meta 97.9%
• colon cancer: localized 85.5%, meta 76.6%
• rectum cancer: localized 96.8%, meta 80.6%
Performance of WFO in India
2017 ASCO annual Meeting, J Clin Oncol 35, 2017 (suppl; abstr 8527)
196. San Antonio Breast Cancer Symposium—December 6-10, 2016
Concordance WFO (@T2) and MMDT (@T1* v. T2**)
(N= 638 Breast Cancer Cases)
Time Point
/Concordance
REC REC + FC
n % n %
T1* 296 46 463 73
T2** 381 60 574 90
This presentation is the intellectual property of the author/presenter.Contact somusp@yahoo.com for permission to reprint and/or distribute.26
* T1 Time of original treatment decision by MMDT in the past (last 1-3 years)
** T2 Time (2016) of WFO’s treatment advice and of MMDT’s treatment decision upon blinded re-review of non-concordant
cases
197. 잠정적 결론
•왓슨 포 온콜로지와 의사의 일치율:
•암종별로 다르다.
•같은 암종에서도 병기별로 다르다.
•같은 암종에 대해서도 병원별/국가별로 다르다.
•시간이 흐름에 따라 달라질 가능성이 있다.
198. 원칙이 필요하다
•어떤 환자의 경우, 왓슨에게 의견을 물을 것인가?
•왓슨을 (암종별로) 얼마나 신뢰할 것인가?
•왓슨의 의견을 환자에게 공개할 것인가?
•왓슨과 의료진의 판단이 다른 경우 어떻게 할 것인가?
•왓슨에게 보험 급여를 매길 수 있는가?
이러한 기준에 따라 의료의 질/치료효과가 달라질 수 있으나,
현재 개별 병원이 개별적인 기준으로 활용하게 됨
199. Empowering the Oncology Community for Cancer Care
Genomics
Oncology
Clinical
Trial
Matching
Watson Health’s oncology clients span more than 35 hospital systems
“Empowering the Oncology Community
for Cancer Care”
Andrew Norden, KOTRA Conference, March 2017, “The Future of Health is Cognitive”
201. •총 16주간 HOG( Highlands Oncology Group)의 폐암과 유방암 환자 2,620명을 대상
•90명의 환자를 3개의 노바티스 유방암 임상 프로토콜에 따라 선별
•임상 시험 코디네이터: 1시간 50분
•Watson CTM: 24분 (78% 시간 단축)
•Watson CTM은 임상 시험 기준에 해당되지 않는 환자 94%를 자동으로 스크리닝
202. Watson Genomics Overview
20
Watson Genomics Content
• 20+ Content Sources Including:
• Medical Articles (23Million)
• Drug Information
• Clinical Trial Information
• Genomic Information
Case Sequenced
VCF / MAF, Log2, Dge
Encryption
Molecular Profile
Analysis
Pathway Analysis
Drug Analysis
Service Analysis, Reports, & Visualizations
204. DeepFace: Closing the Gap to Human-Level
Performance in FaceVerification
Taigman,Y. et al. (2014). DeepFace: Closing the Gap to Human-Level Performance in FaceVerification, CVPR’14.
Figure 2. Outline of the DeepFace architecture. A front-end of a single convolution-pooling-convolution filtering on the rectified input, followed by three
locally-connected layers and two fully-connected layers. Colors illustrate feature maps produced at each layer. The net includes more than 120 million
parameters, where more than 95% come from the local and fully connected layers.
very few parameters. These layers merely expand the input
into a set of simple local features.
The subsequent layers (L4, L5 and L6) are instead lo-
cally connected [13, 16], like a convolutional layer they ap-
ply a filter bank, but every location in the feature map learns
a different set of filters. Since different regions of an aligned
image have different local statistics, the spatial stationarity
The goal of training is to maximize the probability of
the correct class (face id). We achieve this by minimiz-
ing the cross-entropy loss for each training sample. If k
is the index of the true label for a given input, the loss is:
L = log pk. The loss is minimized over the parameters
by computing the gradient of L w.r.t. the parameters and
Human: 95% vs. DeepFace in Facebook: 97.35%
Recognition Accuracy for Labeled Faces in the Wild (LFW) dataset (13,233 images, 5,749 people)
205. FaceNet:A Unified Embedding for Face
Recognition and Clustering
Schroff, F. et al. (2015). FaceNet:A Unified Embedding for Face Recognition and Clustering
Human: 95% vs. FaceNet of Google: 99.63%
Recognition Accuracy for Labeled Faces in the Wild (LFW) dataset (13,233 images, 5,749 people)
False accept
False reject
s. This shows all pairs of images that were
on LFW. Only eight of the 13 errors shown
he other four are mislabeled in LFW.
on Youtube Faces DB
ge similarity of all pairs of the first one
our face detector detects in each video.
False accept
False reject
Figure 6. LFW errors. This shows all pairs of images that were
incorrectly classified on LFW. Only eight of the 13 errors shown
here are actual errors the other four are mislabeled in LFW.
5.7. Performance on Youtube Faces DB
We use the average similarity of all pairs of the first one
hundred frames that our face detector detects in each video.
This gives us a classification accuracy of 95.12%±0.39.
Using the first one thousand frames results in 95.18%.
Compared to [17] 91.4% who also evaluate one hundred
frames per video we reduce the error rate by almost half.
DeepId2+ [15] achieved 93.2% and our method reduces this
error by 30%, comparable to our improvement on LFW.
5.8. Face Clustering
Our compact embedding lends itself to be used in order
to cluster a users personal photos into groups of people with
the same identity. The constraints in assignment imposed
by clustering faces, compared to the pure verification task,
lead to truly amazing results. Figure 7 shows one cluster in
a users personal photo collection, generated using agglom-
erative clustering. It is a clear showcase of the incredible
invariance to occlusion, lighting, pose and even age.
Figure 7. Face Clustering. Shown is an exemplar cluster for one
user. All these images in the users personal photo collection were
clustered together.
6. Summary
We provide a method to directly learn an embedding into
an Euclidean space for face verification. This sets it apart
from other methods [15, 17] who use the CNN bottleneck
layer, or require additional post-processing such as concate-
nation of multiple models and PCA, as well as SVM clas-
sification. Our end-to-end training both simplifies the setup
and shows that directly optimizing a loss relevant to the task
at hand improves performance.
Another strength of our model is that it only requires
False accept
False reject
Figure 6. LFW errors. This shows all pairs of images that were
incorrectly classified on LFW. Only eight of the 13 errors shown
here are actual errors the other four are mislabeled in LFW.
5.7. Performance on Youtube Faces DB
We use the average similarity of all pairs of the first one
hundred frames that our face detector detects in each video.
This gives us a classification accuracy of 95.12%±0.39.
Using the first one thousand frames results in 95.18%.
Compared to [17] 91.4% who also evaluate one hundred
frames per video we reduce the error rate by almost half.
DeepId2+ [15] achieved 93.2% and our method reduces this
error by 30%, comparable to our improvement on LFW.
5.8. Face Clustering
Our compact embedding lends itself to be used in order
to cluster a users personal photos into groups of people with
the same identity. The constraints in assignment imposed
by clustering faces, compared to the pure verification task,
Figure 7. Face Clustering. Shown is an exemplar cluster for one
user. All these images in the users personal photo collection were
clustered together.
6. Summary
We provide a method to directly learn an embedding into
an Euclidean space for face verification. This sets it apart
from other methods [15, 17] who use the CNN bottleneck
layer, or require additional post-processing such as concate-
nation of multiple models and PCA, as well as SVM clas-
206. Targeting Ultimate Accuracy: Face
Recognition via Deep Embedding
Jingtuo Liu (2015) Targeting Ultimate Accuracy: Face Recognition via Deep Embedding
Human: 95% vs.Baidu: 99.77%
Recognition Accuracy for Labeled Faces in the Wild (LFW) dataset (13,233 images, 5,749 people)
3
Although several algorithms have achieved nearly perfect
accuracy in the 6000-pair verification task, a more practical
can achieve 95.8% identification rate, relatively reducing the
error rate by about 77%.
TABLE 3. COMPARISONS WITH OTHER METHODS ON SEVERAL EVALUATION TASKS
Score = -0.060 (pair #113) Score = -0.022 (pair #202) Score = -0.034 (pair #656)
Score = -0.031 (pair #1230) Score = -0.073 (pair #1862) Score = -0.091(pair #2499)
Score = -0.024 (pair #2551) Score = -0.036 (pair #2552) Score = -0.089 (pair #2610)
Method
Performance on tasks
Pair-wise
Accuracy(%)
Rank-1(%)
DIR(%) @
FAR =1%
Verification(%
)@ FAR=0.1%
Open-set
Identification(%
)@ Rank =
1,FAR = 0.1%
IDL Ensemble
Model
99.77 98.03 95.8 99.41 92.09
IDL Single Model 99.68 97.60 94.12 99.11 89.08
FaceNet[12] 99.63 NA NA NA NA
DeepID3[9] 99.53 96.00 81.40 NA NA
Face++[2] 99.50 NA NA NA NA
Facebook[15] 98.37 82.5 61.9 NA NA
Learning from
Scratch[4]
97.73 NA NA 80.26 28.90
HighDimLBP[10] 95.17 NA NA
41.66(reported
in [4])
18.07(reported
in [4])
• 6,000쌍의 얼굴 사진 중에 바이두의 인공지능은 불과 14쌍만을 잘못 판단
• 알고 보니 이 14쌍 중의 5쌍의 사진은 오히려 정답에 오류가 있었고,
실제로는 인공지능이 정확 (red box)
207. Show and Tell:
A Neural Image Caption Generator
Vinyals, O. et al. (2015). Show and Tell:A Neural Image Caption Generator, arXiv:1411.4555
v
om
Samy Bengio
Google
bengio@google.com
Dumitru Erhan
Google
dumitru@google.com
s a
cts
his
re-
m-
ed
he
de-
nts
A group of people
shopping at an
outdoor market.
!
There are many
vegetables at the
fruit stand.
Vision!
Deep CNN
Language !
Generating!
RNN
Figure 1. NIC, our model, is based end-to-end on a neural net-
work consisting of a vision CNN followed by a language gener-
208. Show and Tell:
A Neural Image Caption Generator
Vinyals, O. et al. (2015). Show and Tell:A Neural Image Caption Generator, arXiv:1411.4555
Figure 5. A selection of evaluation results, grouped by human rating.
211. Business Area
Medical Image Analysis
VUNOnet and our machine learning technology will help doctors and hospitals manage
medical scans and images intelligently to make diagnosis faster and more accurately.
Original Image Automatic Segmentation EmphysemaNormal ReticularOpacity
Our system finds DILDs at the highest accuracy * DILDs: Diffuse Interstitial Lung Disease
Digital Radiologist
Collaboration with Prof. Joon Beom Seo (Asan Medical Center)
Analysed 1200 patients for 3 months
213. 당뇨성 망막병증
• 당뇨병의 대표적 합병증: 당뇨병력이 30년 이상 환자 90% 발병
• 안과 전문의들이 안저(안구의 안쪽)를 사진으로 찍어서 판독
• 망막 내 미세혈관 생성, 출혈, 삼출물 정도를 파악하여 진단
214. • EyePACS-1 과 Messidor-2 의 AUC = 0.991, 0.990
• 7-8명의 안과 전문의와 sensitivity, specificity 가 동일한 수준
• F-score: 0.95 (vs. 인간 의사는 0.91)
Additional sensitivity analyses were conducted for sev-
eralsubcategories:(1)detectingmoderateorworsediabeticreti-
effects of data set size on algorithm performance were exam-
ined and shown to plateau at around 60 000 images (or ap-
Figure 2. Validation Set Performance for Referable Diabetic Retinopathy
100
80
60
40
20
0
0
70
80
85
95
90
75
0 5 10 15 20 25 30
100806040
Sensitivity,%
1 – Specificity, %
20
EyePACS-1: AUC, 99.1%; 95% CI, 98.8%-99.3%A
100
High-sensitivity operating point
High-specificity operating point
100
80
60
40
20
0
0
70
80
85
95
90
75
0 5 10 15 20 25 30
100806040
Sensitivity,%
1 – Specificity, %
20
Messidor-2: AUC, 99.0%; 95% CI, 98.6%-99.5%B
100
High-specificity operating point
High-sensitivity operating point
Performance of the algorithm (black curve) and ophthalmologists (colored
circles) for the presence of referable diabetic retinopathy (moderate or worse
diabetic retinopathy or referable diabetic macular edema) on A, EyePACS-1
(8788 fully gradable images) and B, Messidor-2 (1745 fully gradable images).
The black diamonds on the graph correspond to the sensitivity and specificity of
the algorithm at the high-sensitivity and high-specificity operating points.
In A, for the high-sensitivity operating point, specificity was 93.4% (95% CI,
92.8%-94.0%) and sensitivity was 97.5% (95% CI, 95.8%-98.7%); for the
high-specificity operating point, specificity was 98.1% (95% CI, 97.8%-98.5%)
and sensitivity was 90.3% (95% CI, 87.5%-92.7%). In B, for the high-sensitivity
operating point, specificity was 93.9% (95% CI, 92.4%-95.3%) and sensitivity
was 96.1% (95% CI, 92.4%-98.3%); for the high-specificity operating point,
specificity was 98.5% (95% CI, 97.7%-99.1%) and sensitivity was 87.0% (95%
CI, 81.1%-91.0%). There were 8 ophthalmologists who graded EyePACS-1 and 7
ophthalmologists who graded Messidor-2. AUC indicates area under the
receiver operating characteristic curve.
Research Original Investigation Accuracy of a Deep Learning Algorithm for Detection of Diabetic Retinopathy
Results
221. WSJ, 2017 June
• 다국적 제약사는 인공지능 기술을 신약 개발에 활용하기 위해 다양한 시도
• 최근 인공지능에서는 과거의 virtual screening, docking 등과는 다른 방식을 이용
222.
223. AtomNet: A Deep Convolutional Neural Network for
Bioactivity Prediction in Structure-based Drug
Discovery
Izhar Wallach
Atomwise, Inc.
izhar@atomwise.com
Michael Dzamba
Atomwise, Inc.
misko@atomwise.com
Abraham Heifets
Atomwise, Inc.
abe@atomwise.com
Abstract
Deep convolutional neural networks comprise a subclass of deep neural networks
(DNN) with a constrained architecture that leverages the spatial and temporal
structure of the domain they model. Convolutional networks achieve the best pre-
dictive performance in areas such as speech and image recognition by hierarchi-
cally composing simple local features into complex models. Although DNNs have
been used in drug discovery for QSAR and ligand-based bioactivity predictions,
none of these models have benefited from this powerful convolutional architec-
ture. This paper introduces AtomNet, the first structure-based, deep convolutional
neural network designed to predict the bioactivity of small molecules for drug dis-
covery applications. We demonstrate how to apply the convolutional concepts of
feature locality and hierarchical composition to the modeling of bioactivity and
chemical interactions. In further contrast to existing DNN techniques, we show
that AtomNet’s application of local convolutional filters to structural target infor-
mation successfully predicts new active molecules for targets with no previously
known modulators. Finally, we show that AtomNet outperforms previous docking
approaches on a diverse set of benchmarks by a large margin, achieving an AUC
greater than 0.9 on 57.8% of the targets in the DUDE benchmark.
1 Introduction
Fundamentally, biological systems operate through the physical interaction of molecules. The ability
to determine when molecular binding occurs is therefore critical for the discovery of new medicines
and for furthering of our understanding of biology. Unfortunately, despite thirty years of compu-
tational efforts, computer tools remain too inaccurate for routine binding prediction, and physical
experiments remain the state of the art for binding determination. The ability to accurately pre-
dict molecular binding would reduce the time-to-discovery of new treatments, help eliminate toxic
molecules early in development, and guide medicinal chemistry efforts [1, 2].
In this paper, we introduce a new predictive architecture, AtomNet, to help address these challenges.
AtomNet is novel in two regards: AtomNet is the first deep convolutional neural network for molec-
ular binding affinity prediction. It is also the first deep learning system that incorporates structural
information about the target to make its predictions.
Deep convolutional neural networks (DCNN) are currently the best performing predictive models
for speech and vision [3, 4, 5, 6]. DCNN is a class of deep neural network that constrains its model
architecture to leverage the spatial and temporal structure of its domain. For example, a low-level
image feature, such as an edge, can be described within a small spatially-proximate patch of pixels.
Such a feature detector can share evidence across the entire receptive field by “tying the weights”
of the detector neurons, as the recognition of the edge does not depend on where it is found within
1
arXiv:1510.02855v1[cs.LG]10Oct2015
224. AtomNet: A Deep Convolutional Neural Network for
Bioactivity Prediction in Structure-based Drug
Discovery
Izhar Wallach
Atomwise, Inc.
izhar@atomwise.com
Michael Dzamba
Atomwise, Inc.
misko@atomwise.com
Abraham Heifets
Atomwise, Inc.
abe@atomwise.com
Abstract
Deep convolutional neural networks comprise a subclass of deep neural networks
(DNN) with a constrained architecture that leverages the spatial and temporal
structure of the domain they model. Convolutional networks achieve the best pre-
dictive performance in areas such as speech and image recognition by hierarchi-
cally composing simple local features into complex models. Although DNNs have
been used in drug discovery for QSAR and ligand-based bioactivity predictions,
none of these models have benefited from this powerful convolutional architec-
ture. This paper introduces AtomNet, the first structure-based, deep convolutional
neural network designed to predict the bioactivity of small molecules for drug dis-
covery applications. We demonstrate how to apply the convolutional concepts of
feature locality and hierarchical composition to the modeling of bioactivity and
chemical interactions. In further contrast to existing DNN techniques, we show
that AtomNet’s application of local convolutional filters to structural target infor-
mation successfully predicts new active molecules for targets with no previously
known modulators. Finally, we show that AtomNet outperforms previous docking
approaches on a diverse set of benchmarks by a large margin, achieving an AUC
greater than 0.9 on 57.8% of the targets in the DUDE benchmark.
1 Introduction
Fundamentally, biological systems operate through the physical interaction of molecules. The ability
to determine when molecular binding occurs is therefore critical for the discovery of new medicines
and for furthering of our understanding of biology. Unfortunately, despite thirty years of compu-
tational efforts, computer tools remain too inaccurate for routine binding prediction, and physical
experiments remain the state of the art for binding determination. The ability to accurately pre-
dict molecular binding would reduce the time-to-discovery of new treatments, help eliminate toxic
molecules early in development, and guide medicinal chemistry efforts [1, 2].
In this paper, we introduce a new predictive architecture, AtomNet, to help address these challenges.
AtomNet is novel in two regards: AtomNet is the first deep convolutional neural network for molec-
ular binding affinity prediction. It is also the first deep learning system that incorporates structural
information about the target to make its predictions.
Deep convolutional neural networks (DCNN) are currently the best performing predictive models
for speech and vision [3, 4, 5, 6]. DCNN is a class of deep neural network that constrains its model
architecture to leverage the spatial and temporal structure of its domain. For example, a low-level
image feature, such as an edge, can be described within a small spatially-proximate patch of pixels.
Such a feature detector can share evidence across the entire receptive field by “tying the weights”
of the detector neurons, as the recognition of the edge does not depend on where it is found within
1
arXiv:1510.02855v1[cs.LG]10Oct2015
Smina 123 35 5 0 0
Table 3: The number of targets on which AtomNet and Smina exceed given adjusted-logAUC thresh-
olds. For example, on the CHEMBL-20 PMD set, AtomNet achieves an adjusted-logAUC of 0.3
or better for 27 targets (out of 50 possible targets). ChEMBL-20 PMD contains 50 targets, DUDE-
30 contains 30 targets, DUDE-102 contains 102 targets, and ChEMBL-20 inactives contains 149
targets.
To overcome these limitations we take an indirect approach. Instead of directly visualizing filters
in order to understand their specialization, we apply filters to input data and examine the location
where they maximally fire. Using this technique we were able to map filters to chemical functions.
For example, Figure 5 illustrate the 3D locations at which a particular filter from our first convo-
lutional layer fires. Visual inspection of the locations at which that filter is active reveals that this
filter specializes as a sulfonyl/sulfonamide detector. This demonstrates the ability of the model to
learn complex chemical features from simpler ones. In this case, the filter has inferred a meaningful
spatial arrangement of input atom types without any chemical prior knowledge.
Figure 5: Sulfonyl/sulfonamide detection with autonomously trained convolutional filters.
8
• 이미 알려진 단백질-리간드 3차원 결합 구조를 딥러닝(CNN)으로 학습
• 화학 결합 등에 대한 계산 없이도, 단백질-리간드 결합 여부를 계산
• 기존의 구조기반 예측 등 대비, 딥러닝으로 더 정확히 예측하였음
225. AtomNet: A Deep Convolutional Neural Network for
Bioactivity Prediction in Structure-based Drug
Discovery
Izhar Wallach
Atomwise, Inc.
izhar@atomwise.com
Michael Dzamba
Atomwise, Inc.
misko@atomwise.com
Abraham Heifets
Atomwise, Inc.
abe@atomwise.com
Abstract
Deep convolutional neural networks comprise a subclass of deep neural networks
(DNN) with a constrained architecture that leverages the spatial and temporal
structure of the domain they model. Convolutional networks achieve the best pre-
dictive performance in areas such as speech and image recognition by hierarchi-
cally composing simple local features into complex models. Although DNNs have
been used in drug discovery for QSAR and ligand-based bioactivity predictions,
none of these models have benefited from this powerful convolutional architec-
ture. This paper introduces AtomNet, the first structure-based, deep convolutional
neural network designed to predict the bioactivity of small molecules for drug dis-
covery applications. We demonstrate how to apply the convolutional concepts of
feature locality and hierarchical composition to the modeling of bioactivity and
chemical interactions. In further contrast to existing DNN techniques, we show
that AtomNet’s application of local convolutional filters to structural target infor-
mation successfully predicts new active molecules for targets with no previously
known modulators. Finally, we show that AtomNet outperforms previous docking
approaches on a diverse set of benchmarks by a large margin, achieving an AUC
greater than 0.9 on 57.8% of the targets in the DUDE benchmark.
1 Introduction
Fundamentally, biological systems operate through the physical interaction of molecules. The ability
to determine when molecular binding occurs is therefore critical for the discovery of new medicines
and for furthering of our understanding of biology. Unfortunately, despite thirty years of compu-
tational efforts, computer tools remain too inaccurate for routine binding prediction, and physical
experiments remain the state of the art for binding determination. The ability to accurately pre-
dict molecular binding would reduce the time-to-discovery of new treatments, help eliminate toxic
molecules early in development, and guide medicinal chemistry efforts [1, 2].
In this paper, we introduce a new predictive architecture, AtomNet, to help address these challenges.
AtomNet is novel in two regards: AtomNet is the first deep convolutional neural network for molec-
ular binding affinity prediction. It is also the first deep learning system that incorporates structural
information about the target to make its predictions.
Deep convolutional neural networks (DCNN) are currently the best performing predictive models
for speech and vision [3, 4, 5, 6]. DCNN is a class of deep neural network that constrains its model
architecture to leverage the spatial and temporal structure of its domain. For example, a low-level
image feature, such as an edge, can be described within a small spatially-proximate patch of pixels.
Such a feature detector can share evidence across the entire receptive field by “tying the weights”
of the detector neurons, as the recognition of the edge does not depend on where it is found within
1
arXiv:1510.02855v1[cs.LG]10Oct2015
• 이미 알려진 단백질-리간드 3차원 결합 구조를 딥러닝(CNN)으로 학습
• 화학 결합 등에 대한 계산 없이도, 단백질-리간드 결합 여부를 계산
• 기존의 구조기반 예측 등 대비, 딥러닝으로 더 정확히 예측하였음
230. •Digiceutical = digital + pharmaceutical
•"chemical 과 protein에 이어서 digital drug 이 세번째 종류의 신약이 될 것이다”
•digital drug 은 크게 두 가지 종류
•기존의 약을 아예 대체
•기존 약을 강화(augment)
234. scores at baseline, post treatment and 3-month follow-up are in Fig
group, mean Beck Anxiety Inventory scores significantly decrea
(9.5) to 11.9 (13.6), (t=3.37, df=19, p < .003) and mean PHQ-9
decreased 49% from 13.3 (5.4) to 7.1 (6.7), (t=3.68, df=19, p < 0.00
Figure 4. PTSD Checklist scores across treatment Figure 5. BAI and PH
The average number of sessions for this sample was just under
successful treatment completers had documented mild and mode
injuries, which suggest that this form of exposure can be useful
PTSD Checklist scores across treatment
• 연구 결과 20명의 환자들은 전반적으로 유의미한 개선을 보임
• 환자들 전체의 PCL-M 수치가 평균 54.4에서 35.6으로 감소
• 20명 중 16명은 치료 직후에 더 이상 PTSD 를 가지지 않은 것으로 나타남
• 치료가 끝난지 3개월 후에 환자들의 상태는 유지
http://www.ncbi.nlm.nih.gov/pubmed/19377167
235. reatment and 3-month follow-up are in Figure 4. For this same
iety Inventory scores significantly decreased 33% from 18.6
=3.37, df=19, p < .003) and mean PHQ-9 (depression) scores
3 (5.4) to 7.1 (6.7), (t=3.68, df=19, p < 0.002) (see Figure 5).
ores across treatment Figure 5. BAI and PHQ-Depression scores
r of sessions for this sample was just under 11. Also, two of the
mpleters had documented mild and moderate traumatic brain
that this form of exposure can be usefully applied with this
BAI and PHQ-Depression scores
• 벡 불안 지수는 평균 18.6에서 11.9로 33% 감소
• PHQ-9 우울증 지수 역시 13.3에서 7.1로 49% 감소
• 경미한 외상성 뇌손상 (traumatic brain injury) 환자 2명에도 유의미한 효과
http://www.ncbi.nlm.nih.gov/pubmed/19377167
236.
237. RespeRate
•FDA 승인 받은 유일한 비약물 고혈압 치료법
•sessions of therapeutic breathing 을 통해서 혈압 강하 효과
•15분씩 일주일에 a few times 활용하면 significant blood pressure reduction 증명
•전세계 25만 명 이상 사용
243. Effects of virtual reality-based rehabilitation on distal
upper extremity function and health-related quality of life:
a single-blinded, randomized controlled trial
ments at T2 and 23 completed the follow-up assessments
at T3. During the study, 5 and 8 participants from the SG
and CON groups, respectively, did not complete the inter-
vention programs. The sample sizes at the assessment time
points are presented in Fig. 2. There were no serious ad-
verse events, and only 1 participant from the CON group
dropped out owing to dizziness, which was unrelated to
the intervention. Thus, most of the study withdrawals were
related to uncooperativeness, and the number was higher
than that hypothesized in the study design. At baseline,
dist: F = 4.64, df = 1.38, P = 0.024).
Secondary outcomes
Jebsen–Taylor hand function test
The JTT scores of the SG and CON groups are presented
in Table 2. There were no significant differences in the
JTT-total, JTT-gross, and JTT-fine scores between the 2
groups at T0. The post-hoc test found that there were sig-
nificant improvements in the JTT-total, JTT-gross, and
JTT-fine scores in the SG group during the intervention
Fig. 2 Flowchart of the participants through the study. Abbreviations: SG, Smart Glove; CON, conventional intervention
Shin et al. Journal of NeuroEngineering and Rehabilitation (2016) 13:17
244. Effects of virtual reality-based rehabilitation on distal
upper extremity function and health-related quality of life:
a single-blinded, randomized controlled trial
composite SIS score (F = 5.76, df = 1.0, P = 0.021) and
the overall SIS score (F = 6.408, df = 1.0, P = 0.015).
Moreover, among individual domain scores, the Time ×
standard OT than using amount-matched conventional re-
habilitation, without any adverse events, in stroke survivors.
Additionally, this study noted improvements in the SIS-
Fig. 3 Mean and standard errors for the FM scores in the SG and
CON groups. Abbreviations: FM, Fugl–Meyer assessment, SG, Smart
Glove; CON, conventional intervention
Fig. 4 Mean and standard errors for the JTT scores in the SG and
CON groups. Abbreviations: JTT, Jebsen–Taylor hand function test;
SG, Smart Glove; CON, conventional intervention
Shin et al. Journal of NeuroEngineering and Rehabilitation (2016) 13:17 Page 7 of 10
composite SIS score (F = 5.76, df = 1.0, P = 0.021) and
the overall SIS score (F = 6.408, df = 1.0, P = 0.015).
standard OT than using amount-matched conventional re-
habilitation, without any adverse events, in stroke survivors.
Fig. 3 Mean and standard errors for the FM scores in the SG and
CON groups. Abbreviations: FM, Fugl–Meyer assessment, SG, Smart
Glove; CON, conventional intervention
Fig. 4 Mean and standard errors for the JTT scores in the SG and
CON groups. Abbreviations: JTT, Jebsen–Taylor hand function test;
SG, Smart Glove; CON, conventional intervention
Shin et al. Journal of NeuroEngineering and Rehabilitation (2016) 13:17 Page 7 of 10
Shin et al. Journal of NeuroEngineering and Rehabilitation (2016) 13:17
245.
246.
247. Weight loss efficacy of a novel mobile
Diabetes Prevention Program delivery
platform with human coaching
Andreas Michaelides, Christine Raby, Meghan Wood, Kit Farr, Tatiana Toro-Ramos
To cite: Michaelides A,
Raby C, Wood M, et al.
Weight loss efficacy of a
novel mobile Diabetes
Prevention Program delivery
platform with human
coaching. BMJ Open
Diabetes Research and Care
2016;4:e000264.
doi:10.1136/bmjdrc-2016-
000264
Received 4 May 2016
Revised 19 July 2016
Accepted 11 August 2016
Noom, Inc., New York,
New York, USA
Correspondence to
Dr Andreas Michaelides;
andreas@noom.com
ABSTRACT
Objective: To evaluate the weight loss efficacy of a
novel mobile platform delivering the Diabetes
Prevention Program.
Research Design and Methods: 43 overweight or
obese adult participants with a diagnosis of
prediabetes signed-up to receive a 24-week virtual
Diabetes Prevention Program with human coaching,
through a mobile platform. Weight loss and
engagement were the main outcomes, evaluated by
repeated measures analysis of variance, backward
regression, and mediation regression.
Results: Weight loss at 16 and 24 weeks was
significant, with 56% of starters and 64% of
completers losing over 5% body weight. Mean weight
loss at 24 weeks was 6.58% in starters and 7.5% in
completers. Participants were highly engaged, with
84% of the sample completing 9 lessons or more.
In-app actions related to self-monitoring significantly
predicted weight loss.
Conclusions: Our findings support the effectiveness
of a uniquely mobile prediabetes intervention,
producing weight loss comparable to studies with high
engagement, with potential for scalable population
health management.
INTRODUCTION
Lifestyle interventions,1
including the
National Diabetes Prevention Program
(NDPP) have proven effective in preventing
type 2 diabetes.2 3
Online delivery of an
adapted NDPP has resulted in high levels of
engagement, weight loss, and improvements
in glycated hemoglobin (HbA1c).4 5
Prechronic and chronic care efforts delivered
by other means (text and emails,6
nurse
support,7
DVDs,8
community care9
) have
also been successful in promoting behavior
change, weight loss, and glycemic control.
One study10
adapted the NDPP to deliver
the first part of the curriculum in-person
and the remaining sessions through a mobile
app, and found 6.8% weight loss at
5 months. Mobile health poses a promising
means of delivering prechronic and chronic
care,11 12
and provides a scalable,
convenient, and accessible method to deliver
the NDPP.
The weight loss efficacy of a completely
mobile delivery of a structured NDPP has not
been tested. The main aim of this pilot study
was to evaluate the weight loss efficacy of
Noom’s smartphone-based NDPP-based cur-
ricula with human coaching in a group of
overweight and obese hyperglycemic adults
receiving 16 weeks of core, plus postcore cur-
riculum. In this study, it was hypothesized
that the mobile DPP could produce trans-
formative weight loss over time.
RESEARCH DESIGN AND METHODS
A large Northeast-based insurance company
offered its employees free access to Noom
Health, a mobile-based application that deli-
vers structured curricula with human
coaches. An email or regular mail invitation
with information describing the study was
sent to potential participants based on an
elevated HbA1c status found in their medical
records, reflecting a diagnosis of prediabetes.
Interested participants were assigned to a
virtual Centers for Disease Control and
Prevention (CDC)-recognized NDPP master’s
level coach.
Key messages
▪ To the best of our knowledge, this study is the
first fully mobile translation of the Diabetes
Prevention Program.
▪ A National Diabetes Prevention Program (NDPP)
intervention delivered entirely through a smart-
phone platform showed high engagement and
6-month transformative weight loss, comparable
to the original NDPP and comparable to trad-
itional in-person programmes.
▪ This pilot shows that a novel mobile NDPP inter-
vention has the potential for scalability, and can
address the major barriers facing the widespread
translation of the NDPP into the community
setting, such as a high fixed overhead, fixed
locations, and lower levels of engagement and
weight loss.
BMJ Open Diabetes Research and Care 2016;4:e000264. doi:10.1136/bmjdrc-2016-000264 1
Open Access Research
group.bmj.comon April 27, 2017 - Published byhttp://drc.bmj.com/Downloaded from
•Noom Coach 앱이 체중 감량을 위해서 효과적임을 증명
•완전히 모바일로 이뤄진 최초의 당뇨병 예방 연구
•43명의 전당뇨단계에 있는 과체중이나 비만 환자를 대상
•24주간 Noom Coach의 앱과 모바일 코칭을 제공
•그 결과 64% 의 참가자들이 5-7% 의 체중 감량 효과
•84%에 달하는 사람들이 마지막까지 이 6개월 간의 프로그램에 참여