


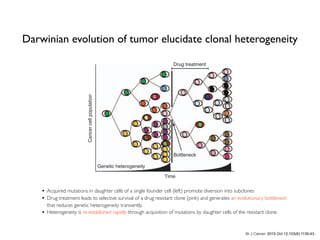


![C A N C E R
Circulating tumor DNA analysis detects minimal
residual disease and predicts recurrence in patients
with stage II colon cancer
Jeanne Tie,1,2,3,4
*†
Yuxuan Wang,5†
Cristian Tomasetti,6,7
Lu Li,6
Simeon Springer,5
Isaac Kinde,8
Natalie Silliman,5
Mark Tacey,9
Hui-Li Wong,1,3,4
Michael Christie,1,3,10
Suzanne Kosmider,2
Iain Skinner,2
Rachel Wong,1,11,12
Malcolm Steel,11
Ben Tran,1,2,3,4
Jayesh Desai,1,3,4
Ian Jones,4,13
Andrew Haydon,14
Theresa Hayes,15
Tim J. Price,16
Robert L. Strausberg,17
Luis A. Diaz Jr.,5
Nickolas Papadopoulos,5
Kenneth W. Kinzler,5
Bert Vogelstein,5
*†
Peter Gibbs1,2,3,4,17
*†
Detection of circulating tumor DNA (ctDNA) after resection of stage II colon cancer may identify patients at the highest
risk of recurrence and help inform adjuvant treatment decisions. We used massively parallel sequencing–based
assays to evaluate the ability of ctDNA to detect minimal residual disease in 1046 plasma samples from a prospective
cohort of 230 patients with resected stage II colon cancer. In patients not treated with adjuvant chemotherapy, ctDNA
was detected postoperatively in 14 of 178 (7.9%) patients, 11 (79%) of whom had recurred at a median follow-up
of 27 months; recurrence occurred in only 16 (9.8 %) of 164 patients with negative ctDNA [hazard ratio (HR), 18;
95% confidence interval (CI), 7.9 to 40; P < 0.001]. In patients treated with chemotherapy, the presence of ctDNA
after completion of chemotherapy was also associated with an inferior recurrence-free survival (HR, 11; 95% CI,
1.8 to 68; P = 0.001). ctDNA detection after stage II colon cancer resection provides direct evidence of residual
disease and identifies patients at very high risk of recurrence.
INTRODUCTION
About 1.3 million cases of colorectal cancer are diagnosed annually
worldwide (1). In patients with stage II colon cancer (~25% of all
colorectal cancer), management after surgical resection remains a
clinical dilemma, with about 80% cured by surgery alone (2). The cur-
rent approach to defining recurrence risk for patients with early-
tus in the tumor defines a low-risk group in which adjuvant chemo-
therapy is not beneficial (6, 7). Most recently, multiple tissue-based
gene signatures have been shown to have prognostic significance,
but again with modest hazard ratios (HRs) of 1.4 to 3.7 (8–11).
In practice, adjuvant chemotherapy is more frequently offered
to high-risk stage II patients, with the justification that high-risk
R E S E A R C H A R T I C L E
http://stm.sciencemag.orgDownloadedfrom
Tie, J., Wang, Y., Tomasetti, C., Li, L., Springer, S. et al. (2016). Sci. Transl. Med. 8, 346ra92.](https://image.slidesharecdn.com/globalhealthcareindustrytrends-thefirsthalfof2017-170510164755/85/2017-41-320.jpg)


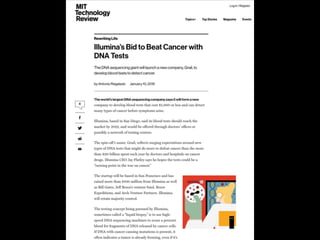


![Copyright 2016 American Medical Association. All rights reserved.
Development and Validation of a Deep Learning Algorithm
for Detection of Diabetic Retinopathy
in Retinal Fundus Photographs
Varun Gulshan, PhD; Lily Peng, MD, PhD; Marc Coram, PhD; Martin C. Stumpe, PhD; Derek Wu, BS; Arunachalam Narayanaswamy, PhD;
Subhashini Venugopalan, MS; Kasumi Widner, MS; Tom Madams, MEng; Jorge Cuadros, OD, PhD; Ramasamy Kim, OD, DNB;
Rajiv Raman, MS, DNB; Philip C. Nelson, BS; Jessica L. Mega, MD, MPH; Dale R. Webster, PhD
IMPORTANCE Deep learning is a family of computational methods that allow an algorithm to
program itself by learning from a large set of examples that demonstrate the desired
behavior, removing the need to specify rules explicitly. Application of these methods to
medical imaging requires further assessment and validation.
OBJECTIVE To apply deep learning to create an algorithm for automated detection of diabetic
retinopathy and diabetic macular edema in retinal fundus photographs.
DESIGN AND SETTING A specific type of neural network optimized for image classification
called a deep convolutional neural network was trained using a retrospective development
data set of 128 175 retinal images, which were graded 3 to 7 times for diabetic retinopathy,
diabetic macular edema, and image gradability by a panel of 54 US licensed ophthalmologists
and ophthalmology senior residents between May and December 2015. The resultant
algorithm was validated in January and February 2016 using 2 separate data sets, both
graded by at least 7 US board-certified ophthalmologists with high intragrader consistency.
EXPOSURE Deep learning–trained algorithm.
MAIN OUTCOMES AND MEASURES The sensitivity and specificity of the algorithm for detecting
referable diabetic retinopathy (RDR), defined as moderate and worse diabetic retinopathy,
referable diabetic macular edema, or both, were generated based on the reference standard
of the majority decision of the ophthalmologist panel. The algorithm was evaluated at 2
operating points selected from the development set, one selected for high specificity and
another for high sensitivity.
RESULTS TheEyePACS-1datasetconsistedof9963imagesfrom4997patients(meanage,54.4
years;62.2%women;prevalenceofRDR,683/8878fullygradableimages[7.8%]);the
Messidor-2datasethad1748imagesfrom874patients(meanage,57.6years;42.6%women;
prevalenceofRDR,254/1745fullygradableimages[14.6%]).FordetectingRDR,thealgorithm
hadanareaunderthereceiveroperatingcurveof0.991(95%CI,0.988-0.993)forEyePACS-1and
0.990(95%CI,0.986-0.995)forMessidor-2.Usingthefirstoperatingcutpointwithhigh
specificity,forEyePACS-1,thesensitivitywas90.3%(95%CI,87.5%-92.7%)andthespecificity
was98.1%(95%CI,97.8%-98.5%).ForMessidor-2,thesensitivitywas87.0%(95%CI,81.1%-
91.0%)andthespecificitywas98.5%(95%CI,97.7%-99.1%).Usingasecondoperatingpoint
withhighsensitivityinthedevelopmentset,forEyePACS-1thesensitivitywas97.5%and
specificitywas93.4%andforMessidor-2thesensitivitywas96.1%andspecificitywas93.9%.
CONCLUSIONS AND RELEVANCE In this evaluation of retinal fundus photographs from adults
with diabetes, an algorithm based on deep machine learning had high sensitivity and
specificity for detecting referable diabetic retinopathy. Further research is necessary to
determine the feasibility of applying this algorithm in the clinical setting and to determine
whether use of the algorithm could lead to improved care and outcomes compared with
current ophthalmologic assessment.
JAMA. doi:10.1001/jama.2016.17216
Published online November 29, 2016.
Editorial
Supplemental content
Author Affiliations: Google Inc,
Mountain View, California (Gulshan,
Peng, Coram, Stumpe, Wu,
Narayanaswamy, Venugopalan,
Widner, Madams, Nelson, Webster);
Department of Computer Science,
University of Texas, Austin
(Venugopalan); EyePACS LLC,
San Jose, California (Cuadros); School
of Optometry, Vision Science
Graduate Group, University of
California, Berkeley (Cuadros);
Aravind Medical Research
Foundation, Aravind Eye Care
System, Madurai, India (Kim); Shri
Bhagwan Mahavir Vitreoretinal
Services, Sankara Nethralaya,
Chennai, Tamil Nadu, India (Raman);
Verily Life Sciences, Mountain View,
California (Mega); Cardiovascular
Division, Department of Medicine,
Brigham and Women’s Hospital and
Harvard Medical School, Boston,
Massachusetts (Mega).
Corresponding Author: Lily Peng,
MD, PhD, Google Research, 1600
Amphitheatre Way, Mountain View,
CA 94043 (lhpeng@google.com).
Research
JAMA | Original Investigation | INNOVATIONS IN HEALTH CARE DELIVERY
(Reprinted) E1
Copyright 2016 American Medical Association. All rights reserved.](https://image.slidesharecdn.com/globalhealthcareindustrytrends-thefirsthalfof2017-170510164755/85/2017-131-320.jpg)


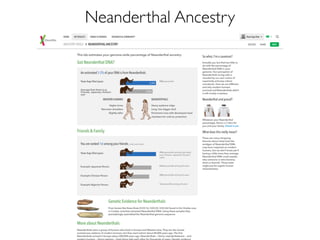
![Assisting Pathologists in Detecting
Cancer with Deep Learning
6
Input & Validation Test
model size FROC @8FP AUC FROC @8FP AUC
40X 98.1 100 99.0 87.3 (83.2, 91.1) 91.1 (87.2, 94.5) 96.7 (92.6, 99.6)
40X-pretrained 99.3 100 100 85.5 (81.0, 89.5) 91.1 (86.8, 94.6) 97.5 (93.8, 99.8)
40X-small 99.3 100 100 86.4 (82.2, 90.4) 92.4 (88.8, 95.7) 97.1 (93.2, 99.8)
ensemble-of-3 - - - 88.5 (84.3, 92.2) 92.4 (88.7, 95.6) 97.7 (93.0, 100)
20X-small 94.7 100 99.6 85.5 (81.0, 89.7) 91.1 (86.9, 94.8) 98.6 (96.7, 100)
10X-small 88.7 97.2 97.7 79.3 (74.2, 84.1) 84.9 (80.0, 89.4) 96.5 (91.9, 99.7)
40X+20X-small 94.9 98.6 99.0 85.9 (81.6, 89.9) 92.9 (89.3, 96.1) 97.0 (93.1, 99.9)
40X+10X-small 93.8 98.6 100 82.2 (77.0, 86.7) 87.6 (83.2, 91.7) 98.6 (96.2, 99.9)
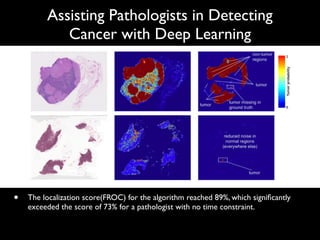
Pathologist [1] - - - 73.3* 73.3* 96.6
Camelyon16 winner [1, 23] - - - 80.7 82.7 99.4
Table 1. Results on Camelyon16 dataset (95% confidence intervals, CI). Bold indicates
results within the CI of the best model. “Small” models contain 300K parameters per
Inception tower instead of 20M. -: not reported. *A pathologist achieved this sensitivity
(with no FP) using 30 hours.
to 10 20% variance), and can confound evaluation of model improvements
by grouping multiple nearby tumors as one. By contrast, our non-maxima sup-
pression approach is relatively insensitive to r between 4 and 6, although less
accurate models benefited from tuning r using the validation set (e.g., 8). Fi-
nally, we achieve 100% FROC on larger tumors (macrometastasis), indicating
that most false negatives are comprised of smaller tumors.
Previous work (e.g., [24, 9]) has shown that pre-training on a di↵erent domain](https://image.slidesharecdn.com/globalhealthcareindustrytrends-thefirsthalfof2017-170510164755/85/2017-154-320.jpg)


Digital Healthcare Partners is a digital health accelerator in Korea that discovers, cultivates, invests in, and connects digital health startups. It provides mentoring, business development support, clinical validation, and investment to early-stage startups. Recent deals include a seed investment in 3billion, a company developing genetic diagnosis services for rare diseases using genome analysis. Global trends in digital health funding in Q1 2017 included large deals in areas like population health, EHR, and e-commerce. The largest deal was Grail's $900M series B for its liquid biopsy cancer diagnostic technology.


![[365mc] 디지털 헬스케어: 의료의 미래](https://cdn.slidesharecdn.com/ss_thumbnails/365mc-200317140059-thumbnail.jpg?width=640&height=640&fit=bounds)


![[KNAPS] 포스트 코로나 시대, 제약 산업과 디지털 헬스케어](https://cdn.slidesharecdn.com/ss_thumbnails/knaps-210128022335-thumbnail.jpg?width=640&height=640&fit=bounds)


![[C&C] 의료의 미래 디지털 헬스케어](https://cdn.slidesharecdn.com/ss_thumbnails/cc-200616080105-thumbnail.jpg?width=640&height=640&fit=bounds)


![[대한병리학회] 의료 인공지능 101: 병리를 중심으로](https://cdn.slidesharecdn.com/ss_thumbnails/pathology-201106004112-thumbnail.jpg?width=640&height=640&fit=bounds)
![[ASGO 2019] Artificial Intelligence in Medicine](https://cdn.slidesharecdn.com/ss_thumbnails/asgo2019medicalai191010-191010155811-thumbnail.jpg?width=640&height=640&fit=bounds)


