


![EDITORIAL OPEN
Digital medicine, on its way to being just plain medicine
npj Digital Medicine (2018)1:20175 ; doi:10.1038/
s41746-017-0005-1
There are already nearly 30,000 peer-reviewed English-language
scientific journals, producing an estimated 2.5 million articles a year.1
So why another, and why one focused specifically on digital
medicine?
To answer that question, we need to begin by defining what
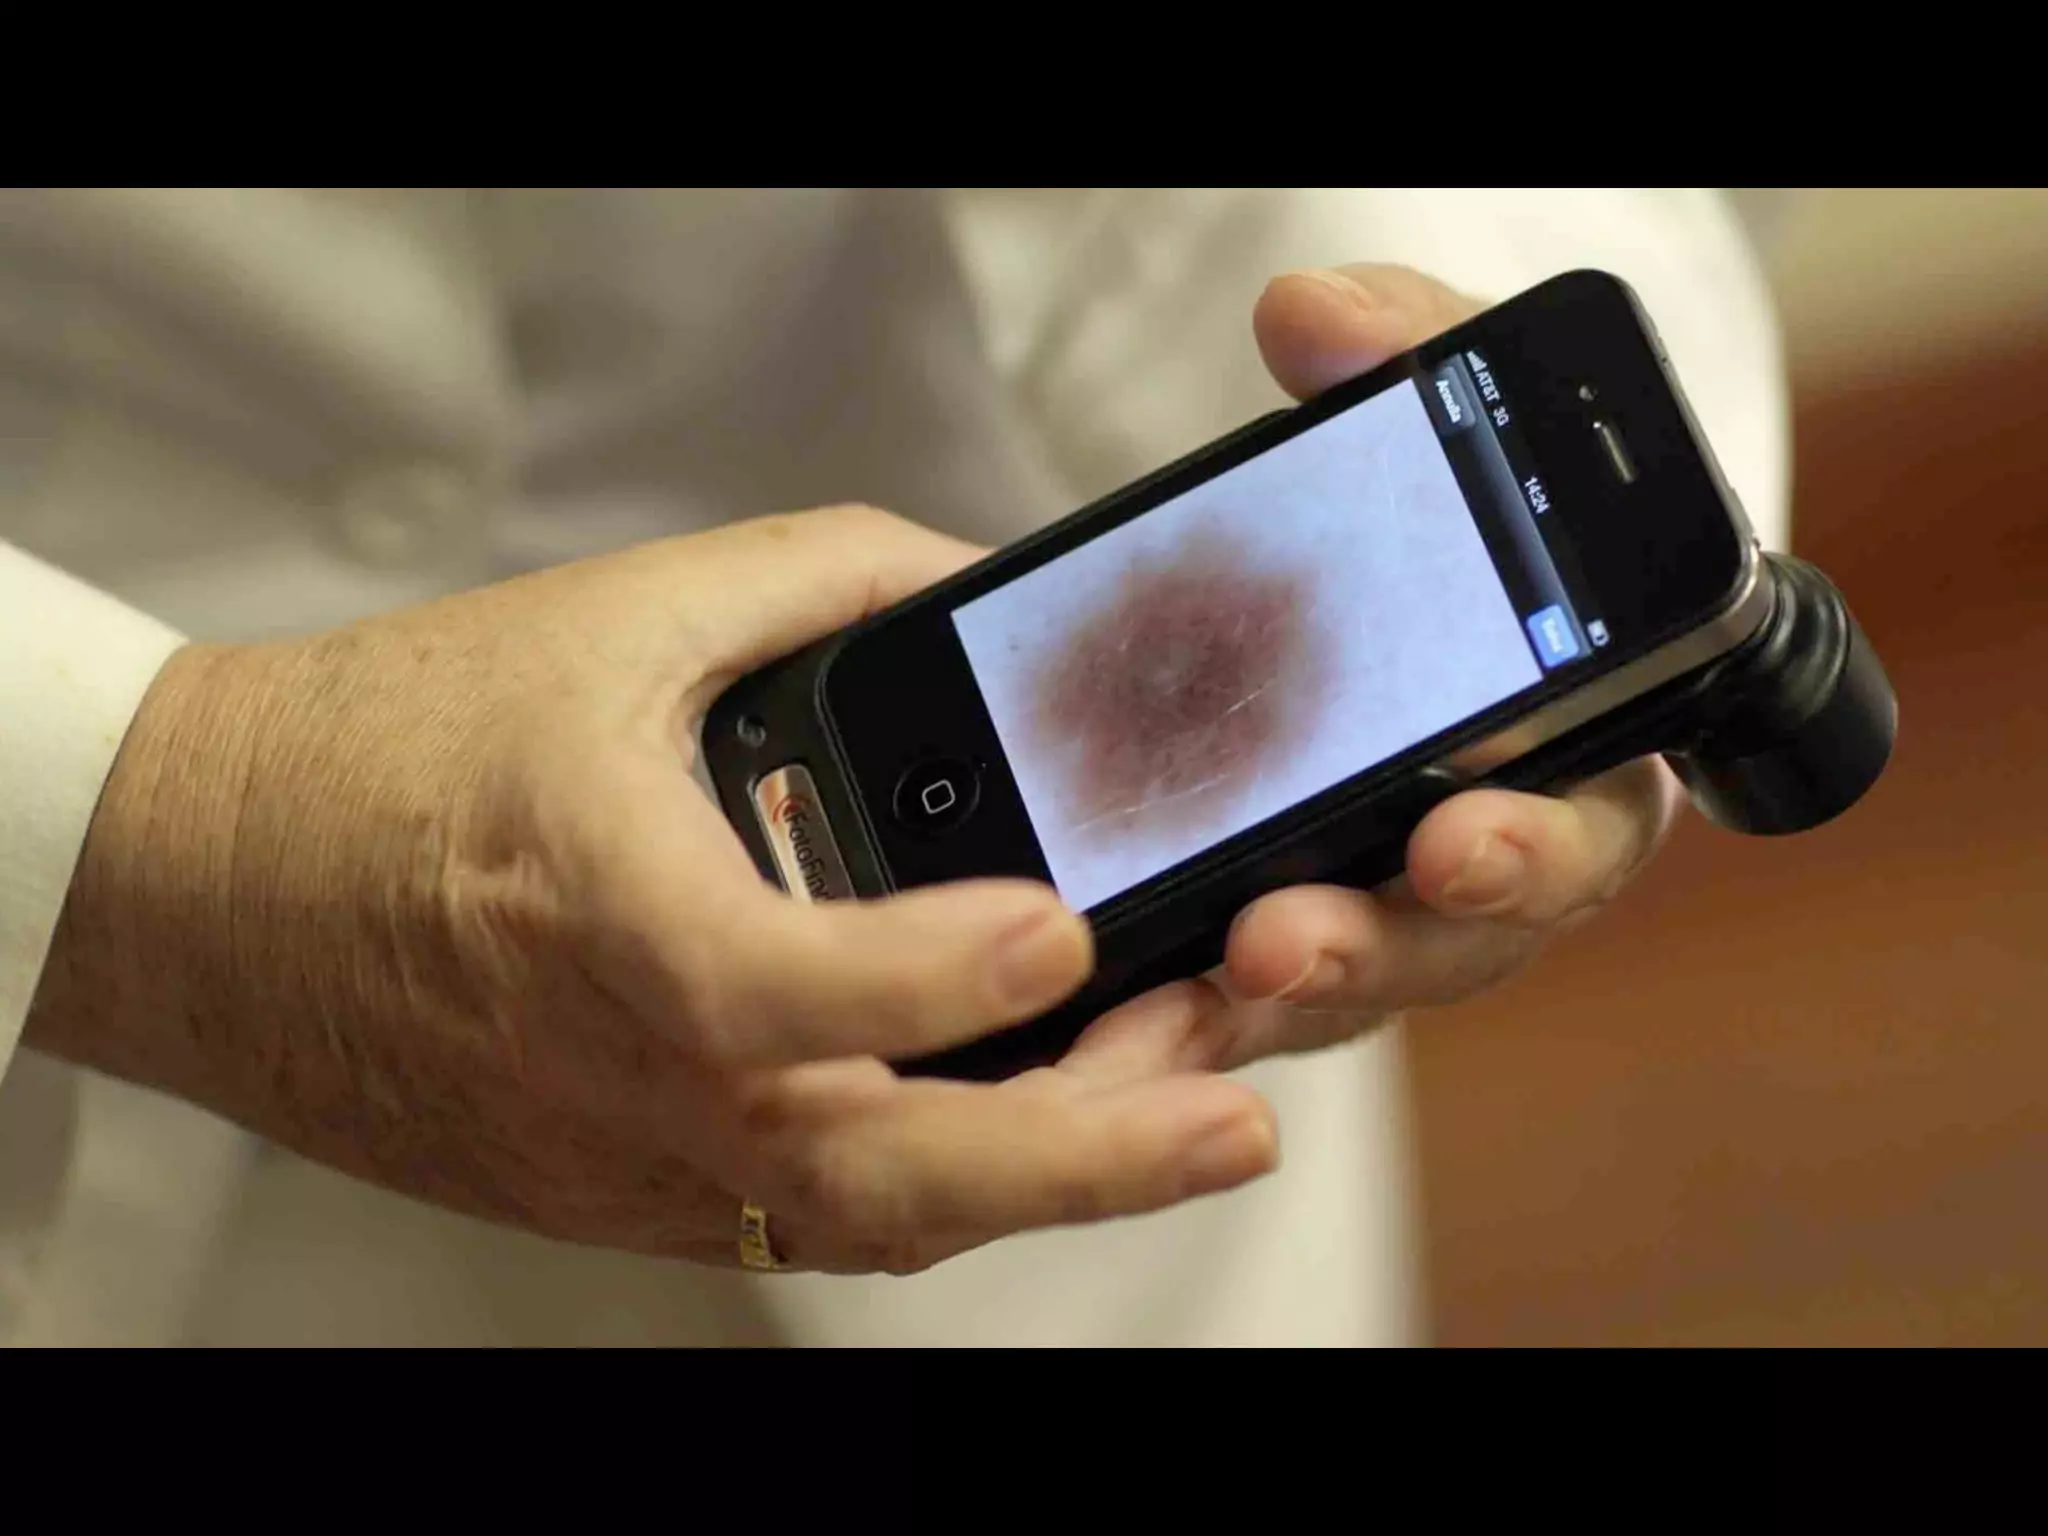
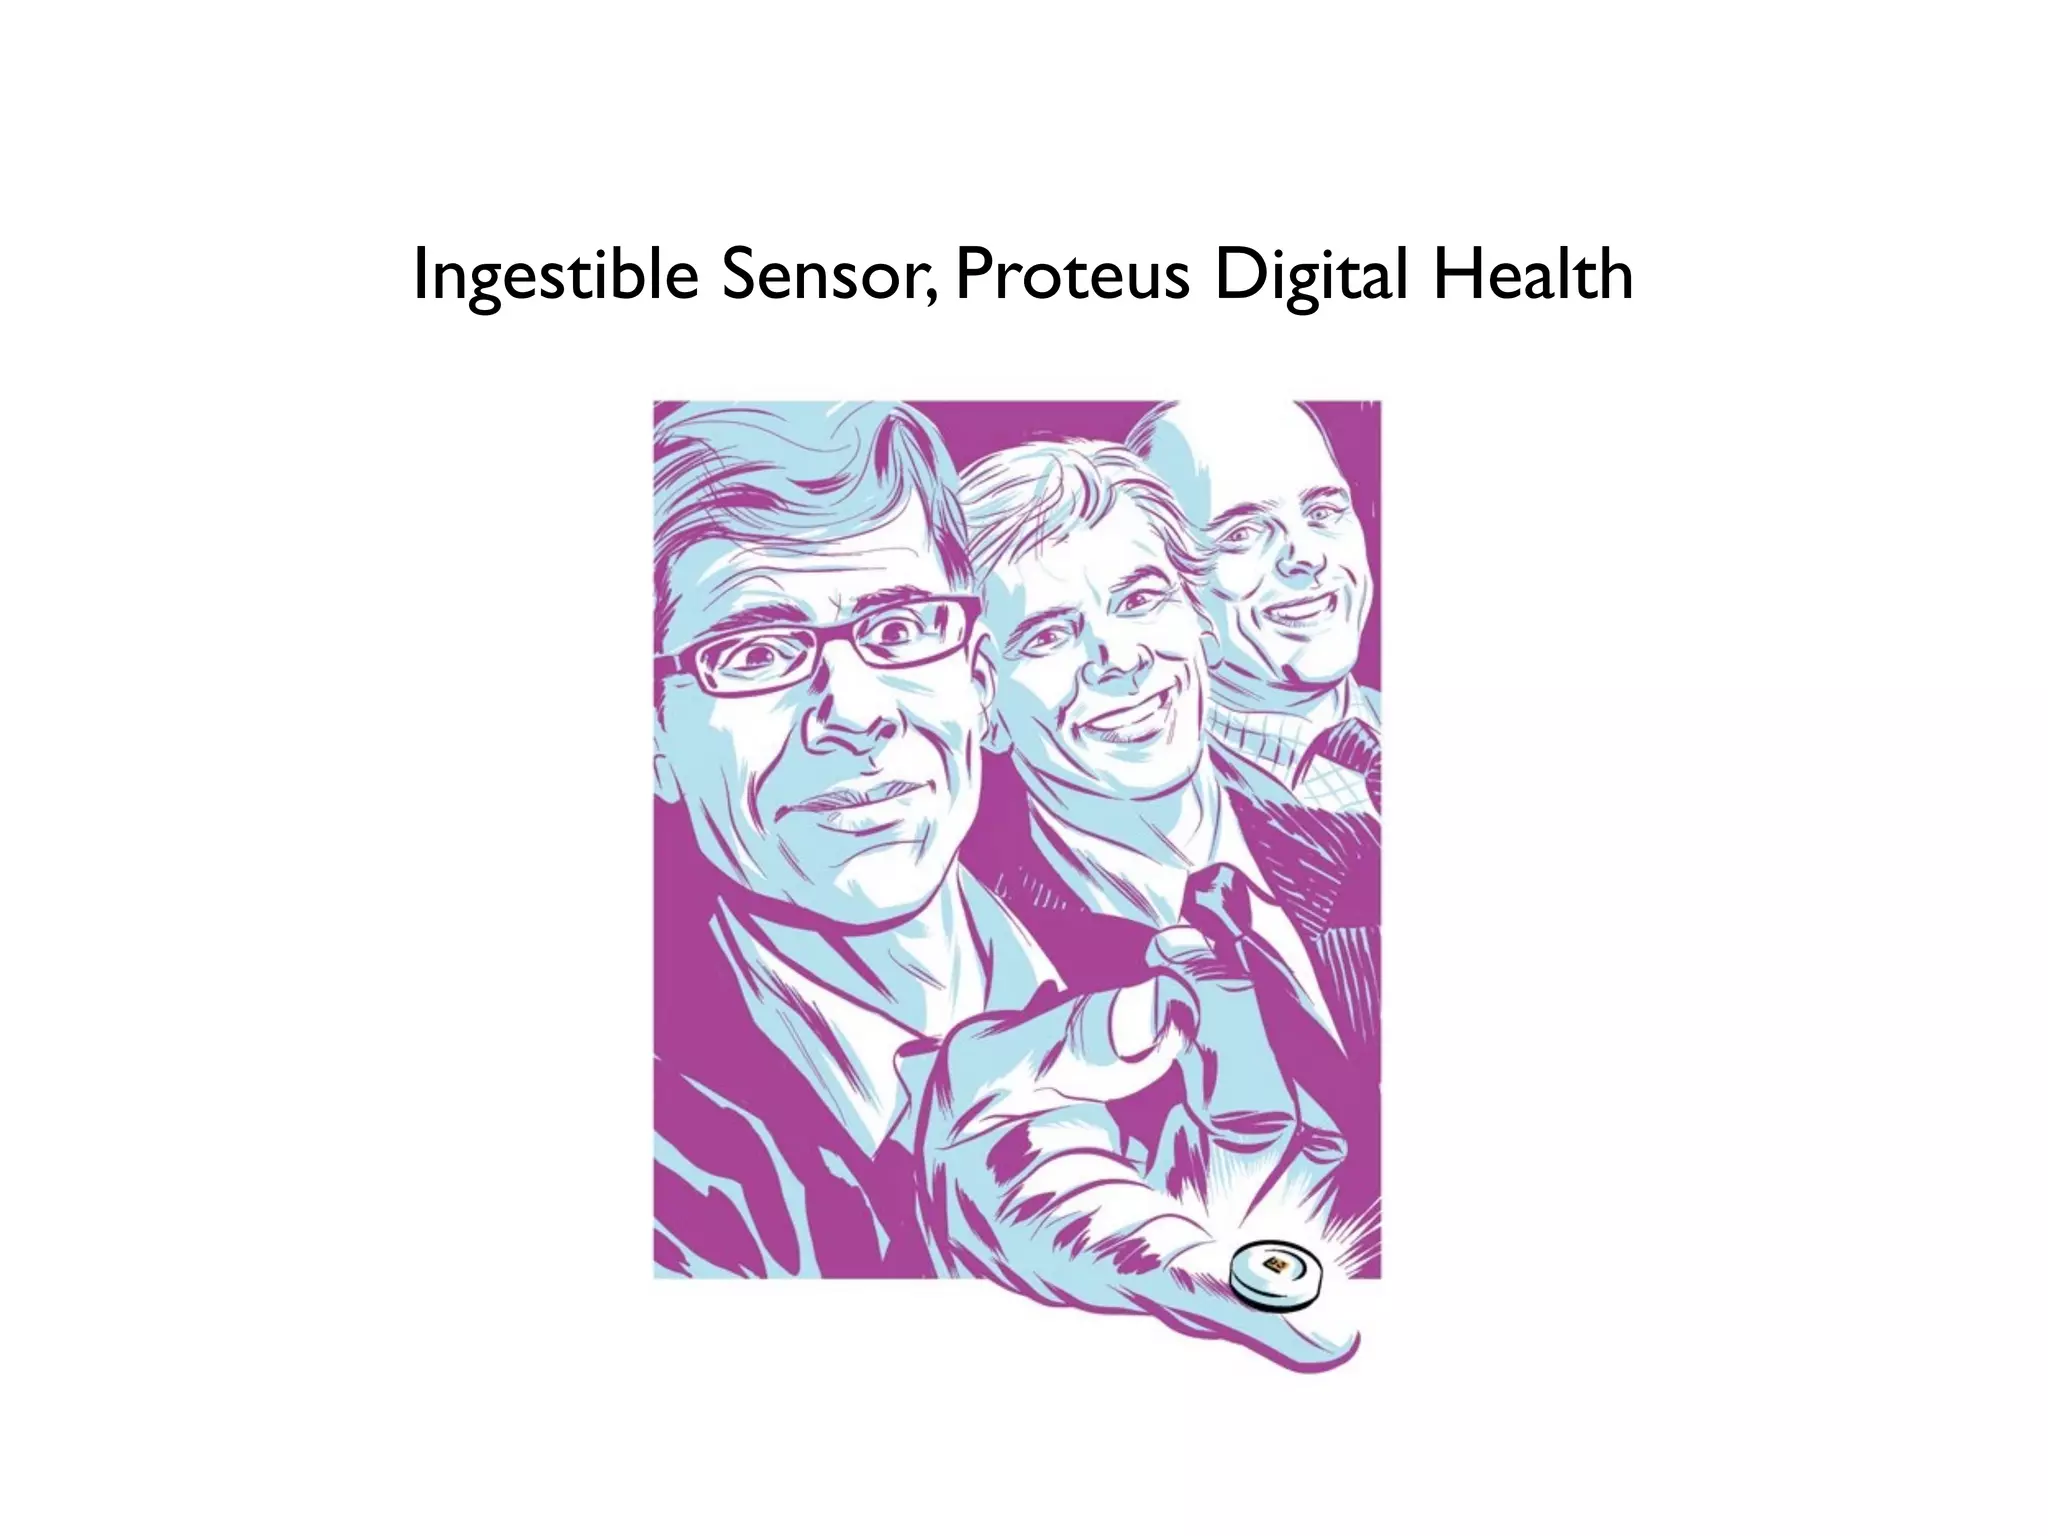
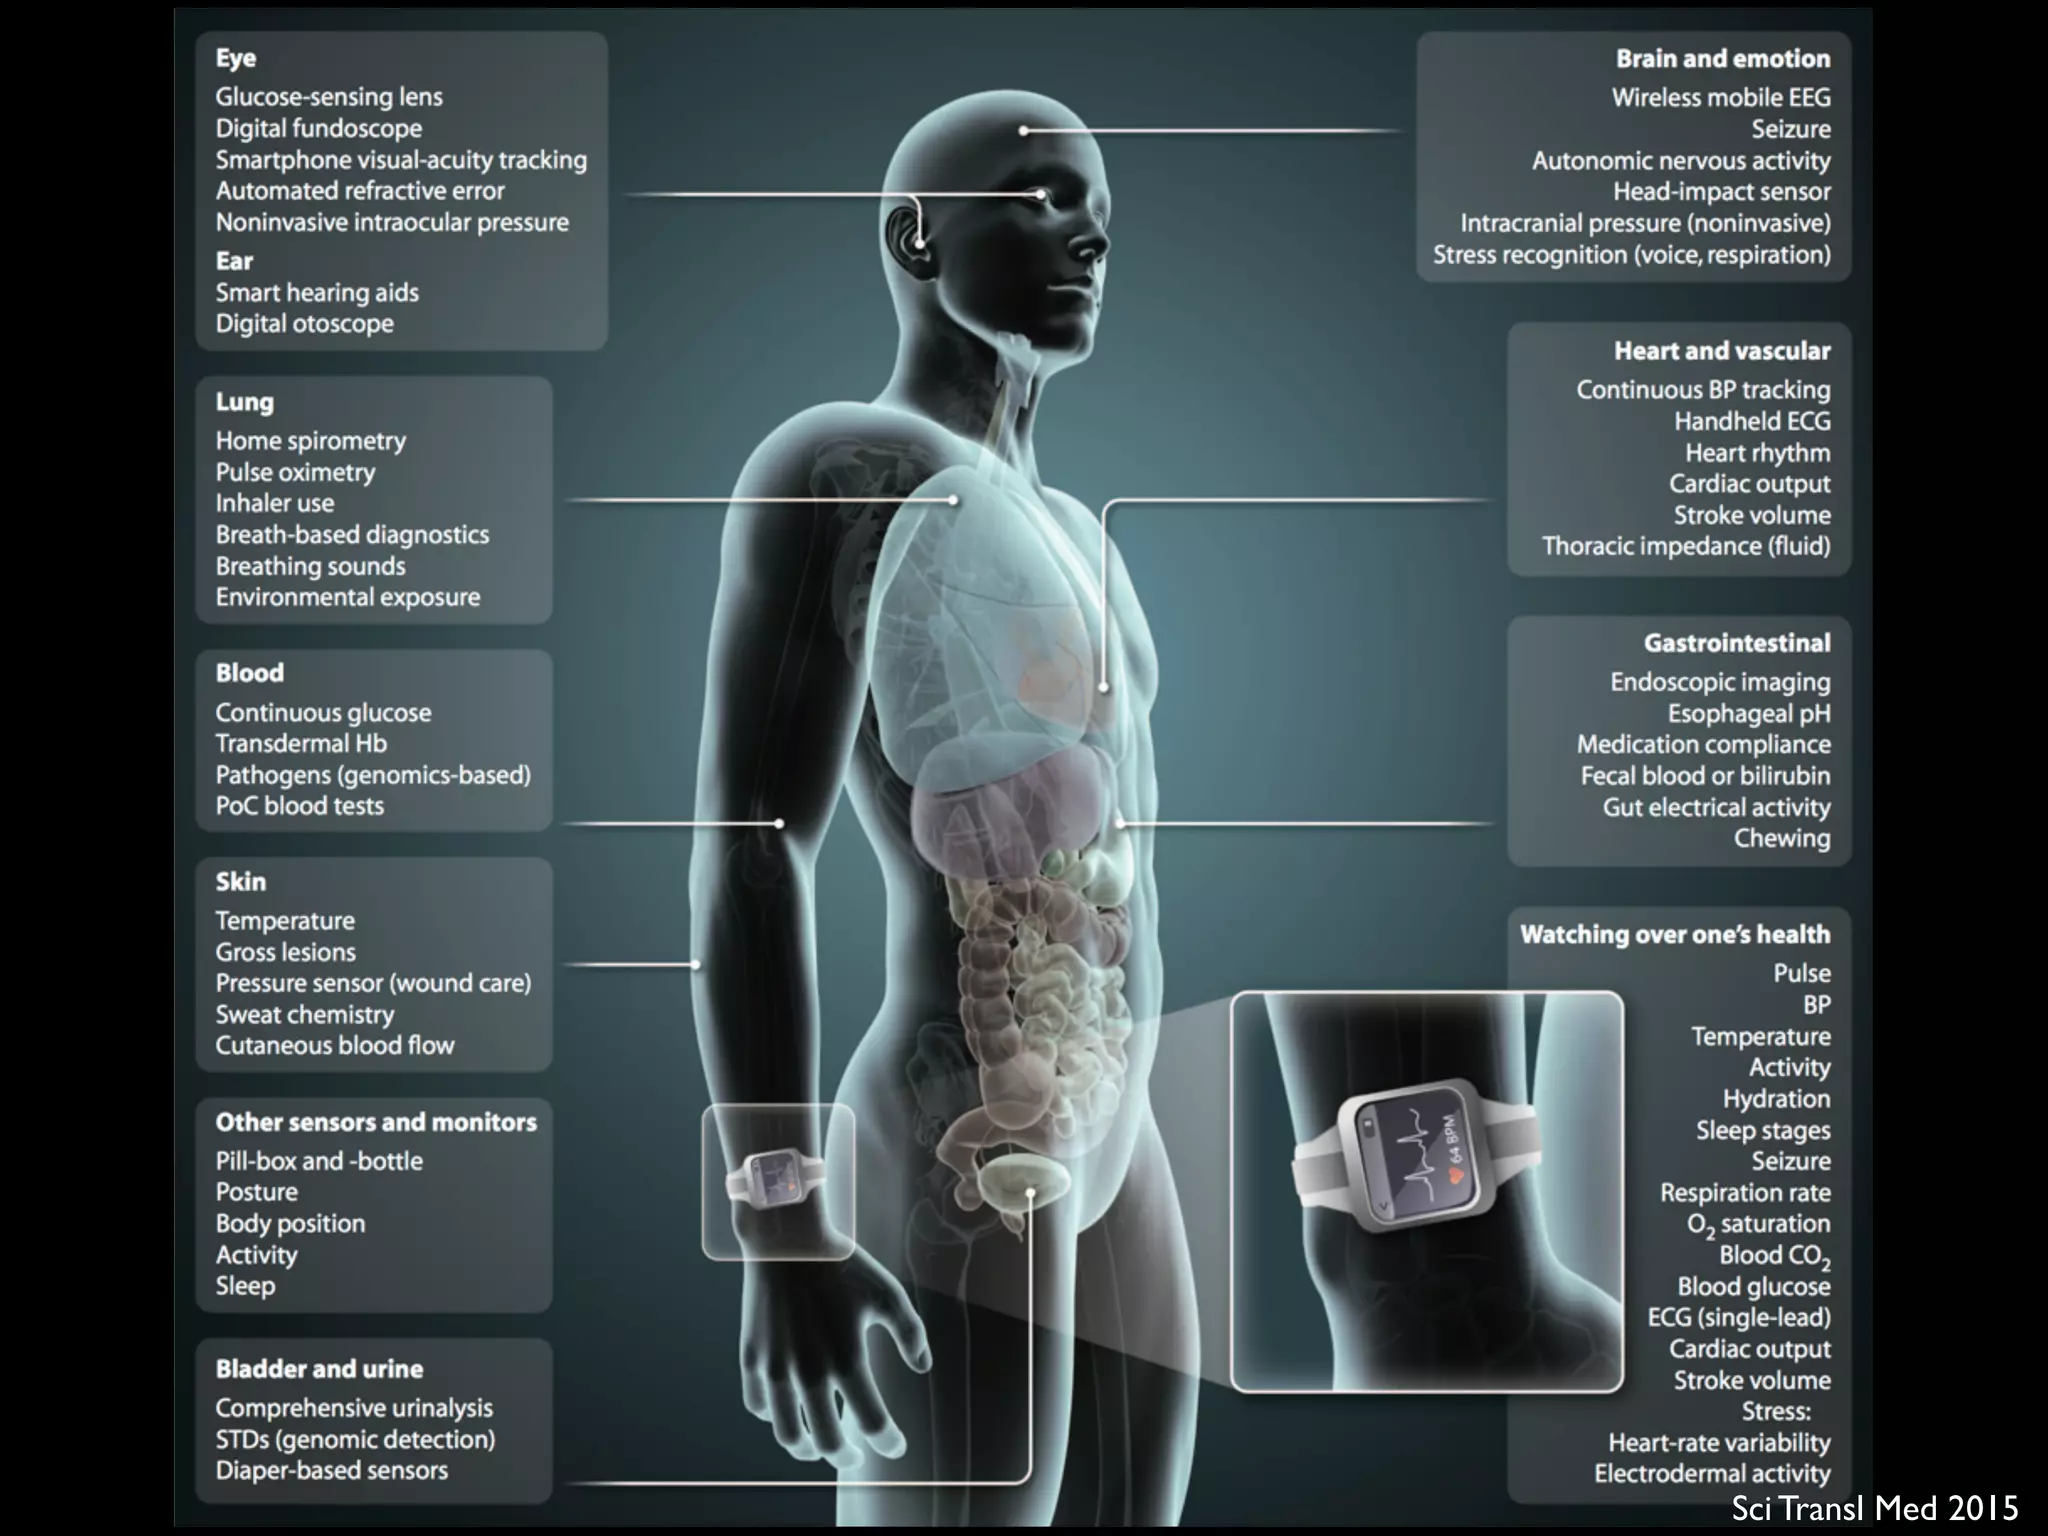
“digital medicine” means: using digital tools to upgrade the
practice of medicine to one that is high-definition and far more
individualized. It encompasses our ability to digitize human beings
using biosensors that track our complex physiologic systems, but
also the means to process the vast data generated via algorithms,
cloud computing, and artificial intelligence. It has the potential to
democratize medicine, with smartphones as the hub, enabling
each individual to generate their own real world data and being
far more engaged with their health. Add to this new imaging
tools, mobile device laboratory capabilities, end-to-end digital
clinical trials, telemedicine, and one can see there is a remarkable
array of transformative technology which lays the groundwork for
a new form of healthcare.
As is obvious by its definition, the far-reaching scope of digital
medicine straddles many and widely varied expertise. Computer
scientists, healthcare providers, engineers, behavioral scientists,
ethicists, clinical researchers, and epidemiologists are just some of
the backgrounds necessary to move the field forward. But to truly
accelerate the development of digital medicine solutions in health
requires the collaborative and thoughtful interaction between
individuals from several, if not most of these specialties. That is the
primary goal of npj Digital Medicine: to serve as a cross-cutting
resource for everyone interested in this area, fostering collabora-
tions and accelerating its advancement.
Current systems of healthcare face multiple insurmountable
challenges. Patients are not receiving the kind of care they want
and need, caregivers are dissatisfied with their role, and in most
countries, especially the United States, the cost of care is
unsustainable. We are confident that the development of new
systems of care that take full advantage of the many capabilities
that digital innovations bring can address all of these major issues.
Researchers too, can take advantage of these leading-edge
technologies as they enable clinical research to break free of the
confines of the academic medical center and be brought into the
real world of participants’ lives. The continuous capture of multiple
interconnected streams of data will allow for a much deeper
refinement of our understanding and definition of most pheno-
types, with the discovery of novel signals in these enormous data
sets made possible only through the use of machine learning.
Our enthusiasm for the future of digital medicine is tempered by
the recognition that presently too much of the publicized work in
this field is characterized by irrational exuberance and excessive
hype. Many technologies have yet to be formally studied in a
clinical setting, and for those that have, too many began and
ended with an under-powered pilot program. In addition, there are
more than a few examples of digital “snake oil” with substantial
uptake prior to their eventual discrediting.2
Both of these practices
are barriers to advancing the field of digital medicine.
Our vision for npj Digital Medicine is to provide a reliable,
evidence-based forum for all clinicians, researchers, and even
patients, curious about how digital technologies can transform
every aspect of health management and care. Being open source,
as all medical research should be, allows for the broadest possible
dissemination, which we will strongly encourage, including
through advocating for the publication of preprints
And finally, quite paradoxically, we hope that npj Digital
Medicine is so successful that in the coming years there will no
longer be a need for this journal, or any journal specifically
focused on digital medicine. Because if we are able to meet our
primary goal of accelerating the advancement of digital medicine,
then soon, we will just be calling it medicine. And there are
already several excellent journals for that.
ACKNOWLEDGEMENTS
Supported by the National Institutes of Health (NIH)/National Center for Advancing
Translational Sciences grant UL1TR001114 and a grant from the Qualcomm Foundation.
ADDITIONAL INFORMATION
Competing interests:The authors declare no competing financial interests.
Publisher's note:Springer Nature remains neutral with regard to jurisdictional claims
in published maps and institutional affiliations.
Change history:The original version of this Article had an incorrect Article number
of 5 and an incorrect Publication year of 2017. These errors have now been corrected
in the PDF and HTML versions of the Article.
Steven R. Steinhubl1
and Eric J. Topol1
1
Scripps Translational Science Institute, 3344 North Torrey Pines
Court, Suite 300, La Jolla, CA 92037, USA
Correspondence: Steven R. Steinhubl (steinhub@scripps.edu) or
Eric J. Topol (etopol@scripps.edu)
REFERENCES
1. Ware, M. & Mabe, M. The STM report: an overview of scientific and scholarly journal
publishing 2015 [updated March]. http://digitalcommons.unl.edu/scholcom/92017
(2015).
2. Plante, T. B., Urrea, B. & MacFarlane, Z. T. et al. Validation of the instant blood
pressure smartphone App. JAMA Intern. Med. 176, 700–702 (2016).
Open Access This article is licensed under a Creative Commons
Attribution 4.0 International License, which permits use, sharing,
adaptation, distribution and reproduction in any medium or format, as long as you give
appropriate credit to the original author(s) and the source, provide a link to the Creative
Commons license, and indicate if changes were made. The images or other third party
material in this article are included in the article’s Creative Commons license, unless
indicated otherwise in a credit line to the material. If material is not included in the
article’s Creative Commons license and your intended use is not permitted by statutory
regulation or exceeds the permitted use, you will need to obtain permission directly
from the copyright holder. To view a copy of this license, visit http://creativecommons.
org/licenses/by/4.0/.
© The Author(s) 2018
Received: 19 October 2017 Accepted: 25 October 2017
www.nature.com/npjdigitalmed
Published in partnership with the Scripps Translational Science Institute
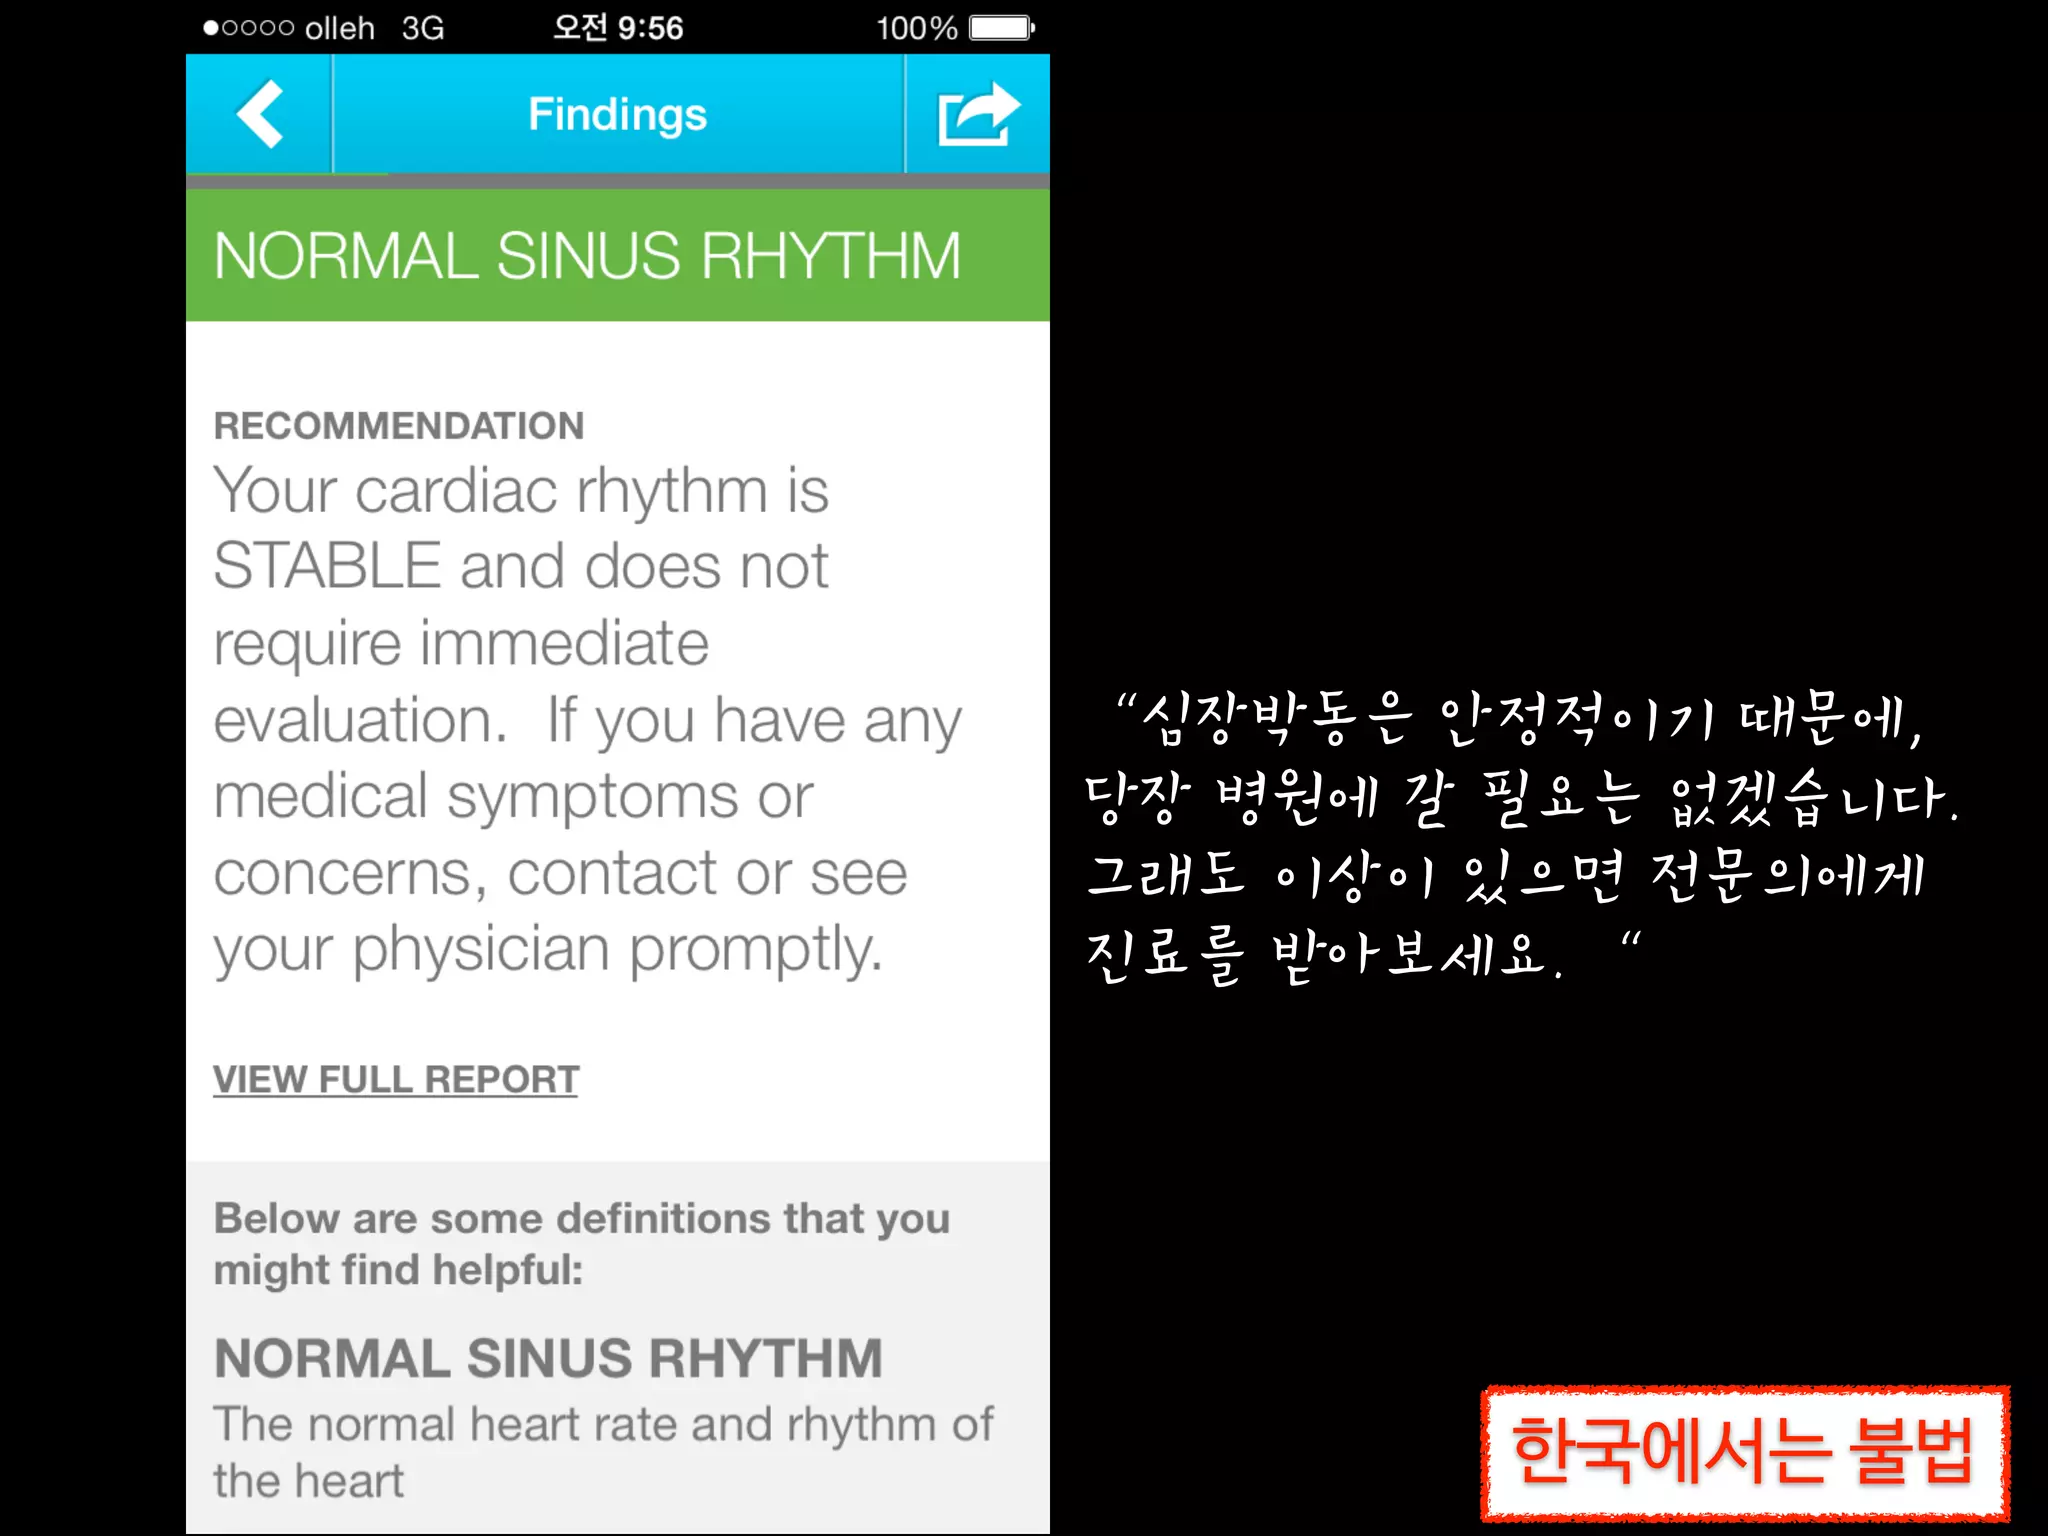
디지털 의료의 미래는?
일상적인 의료가 되는 것](https://image.slidesharecdn.com/digitalhealth-190427130553/75/slide-21-2048.jpg)


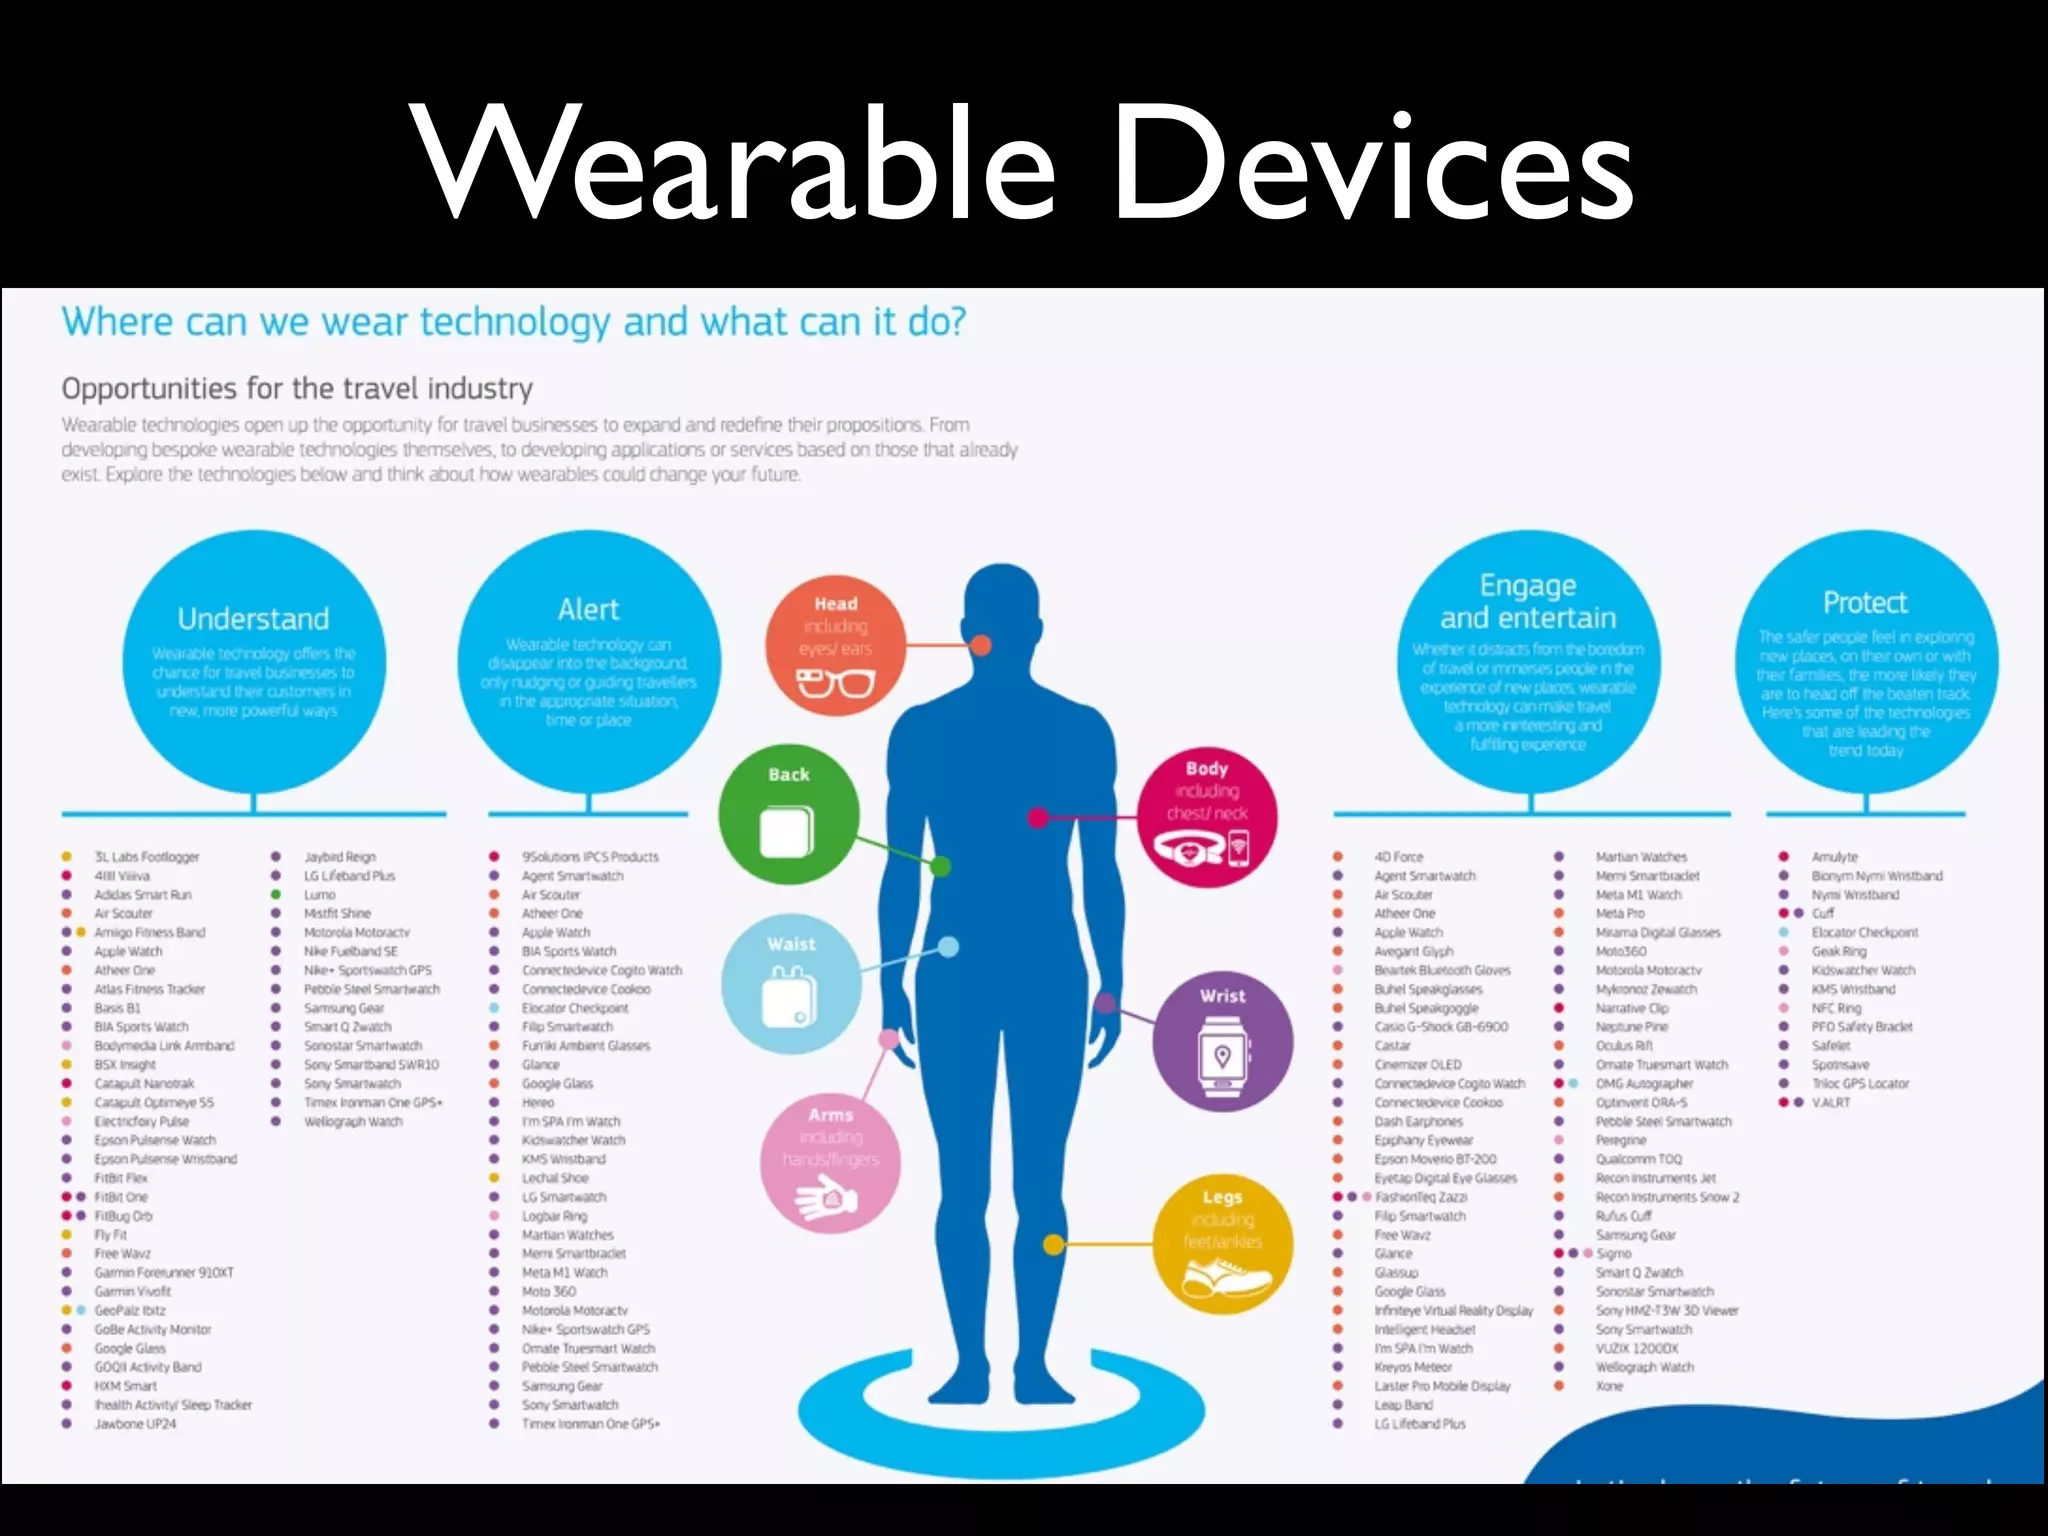


![Fig 1. What can consumer wearables do? Heart rate can be measured with an oximeter built into a ring [3], muscle activity with an electromyographi
sensor embedded into clothing [4], stress with an electodermal sensor incorporated into a wristband [5], and physical activity or sleep patterns via an
accelerometer in a watch [6,7]. In addition, a female’s most fertile period can be identified with detailed body temperature tracking [8], while levels of me
attention can be monitored with a small number of non-gelled electroencephalogram (EEG) electrodes [9]. Levels of social interaction (also known to a
PLOS Medicine 2016](https://image.slidesharecdn.com/digitalhealth-190427130553/75/slide-60-2048.jpg)


![ARTICLE OPEN
Scalable and accurate deep learning with electronic health
records
Alvin Rajkomar 1,2
, Eyal Oren1
, Kai Chen1
, Andrew M. Dai1
, Nissan Hajaj1
, Michaela Hardt1
, Peter J. Liu1
, Xiaobing Liu1
, Jake Marcus1
,
Mimi Sun1
, Patrik Sundberg1
, Hector Yee1
, Kun Zhang1
, Yi Zhang1
, Gerardo Flores1
, Gavin E. Duggan1
, Jamie Irvine1
, Quoc Le1
,
Kurt Litsch1
, Alexander Mossin1
, Justin Tansuwan1
, De Wang1
, James Wexler1
, Jimbo Wilson1
, Dana Ludwig2
, Samuel L. Volchenboum3
,
Katherine Chou1
, Michael Pearson1
, Srinivasan Madabushi1
, Nigam H. Shah4
, Atul J. Butte2
, Michael D. Howell1
, Claire Cui1
,
Greg S. Corrado1
and Jeffrey Dean1
Predictive modeling with electronic health record (EHR) data is anticipated to drive personalized medicine and improve healthcare
quality. Constructing predictive statistical models typically requires extraction of curated predictor variables from normalized EHR
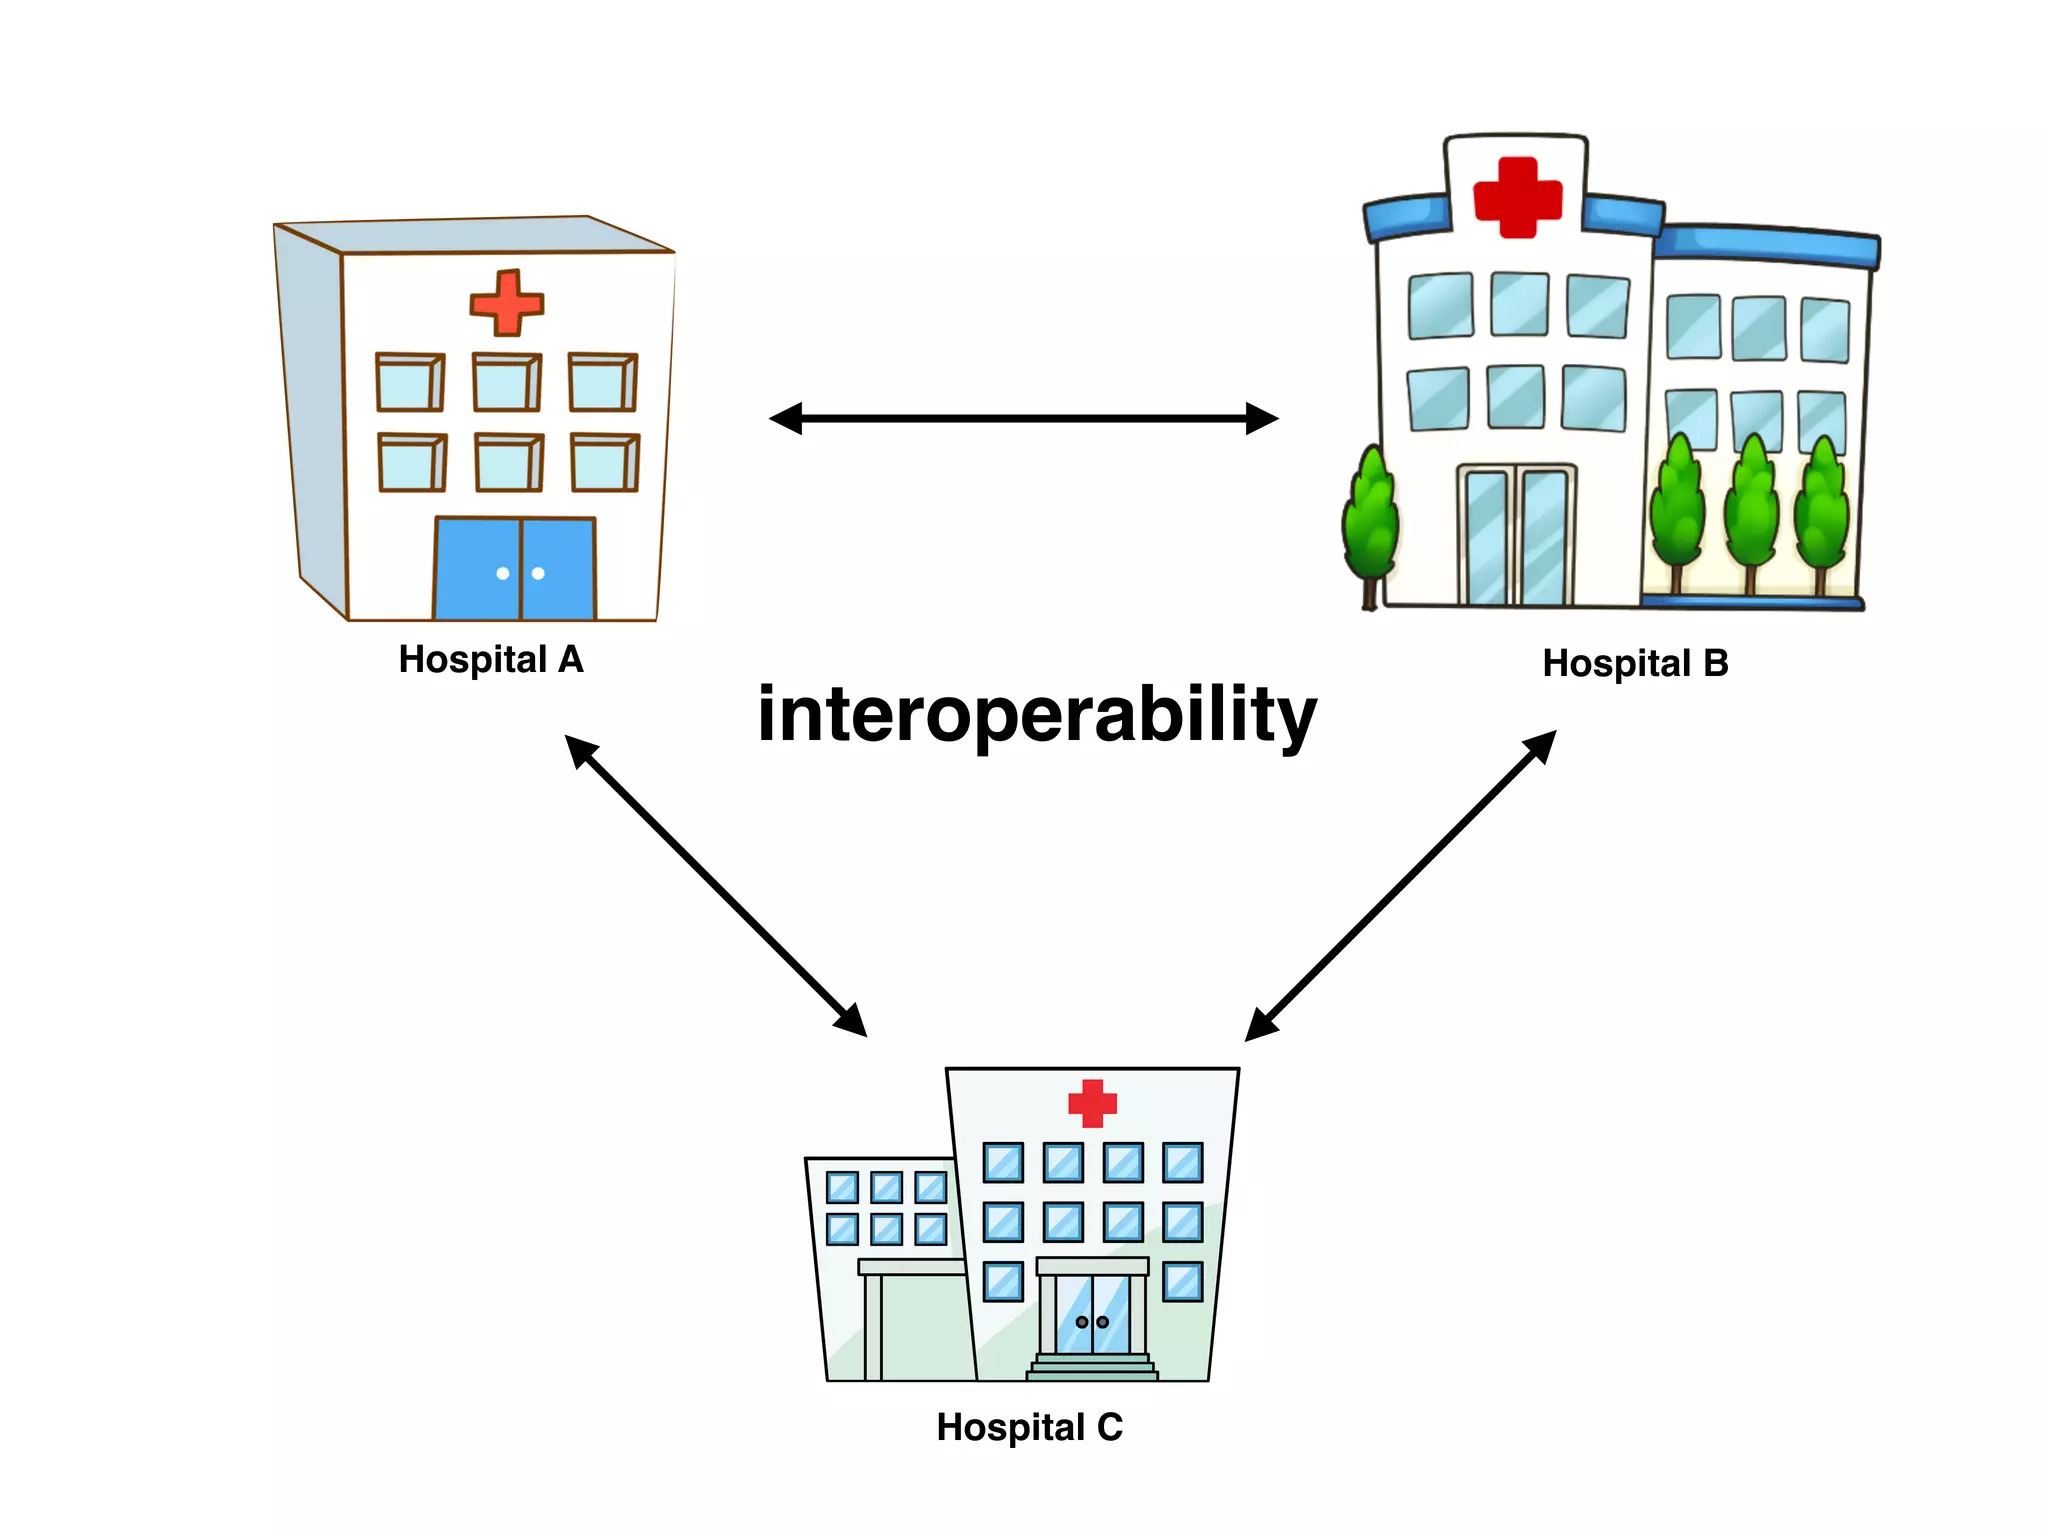
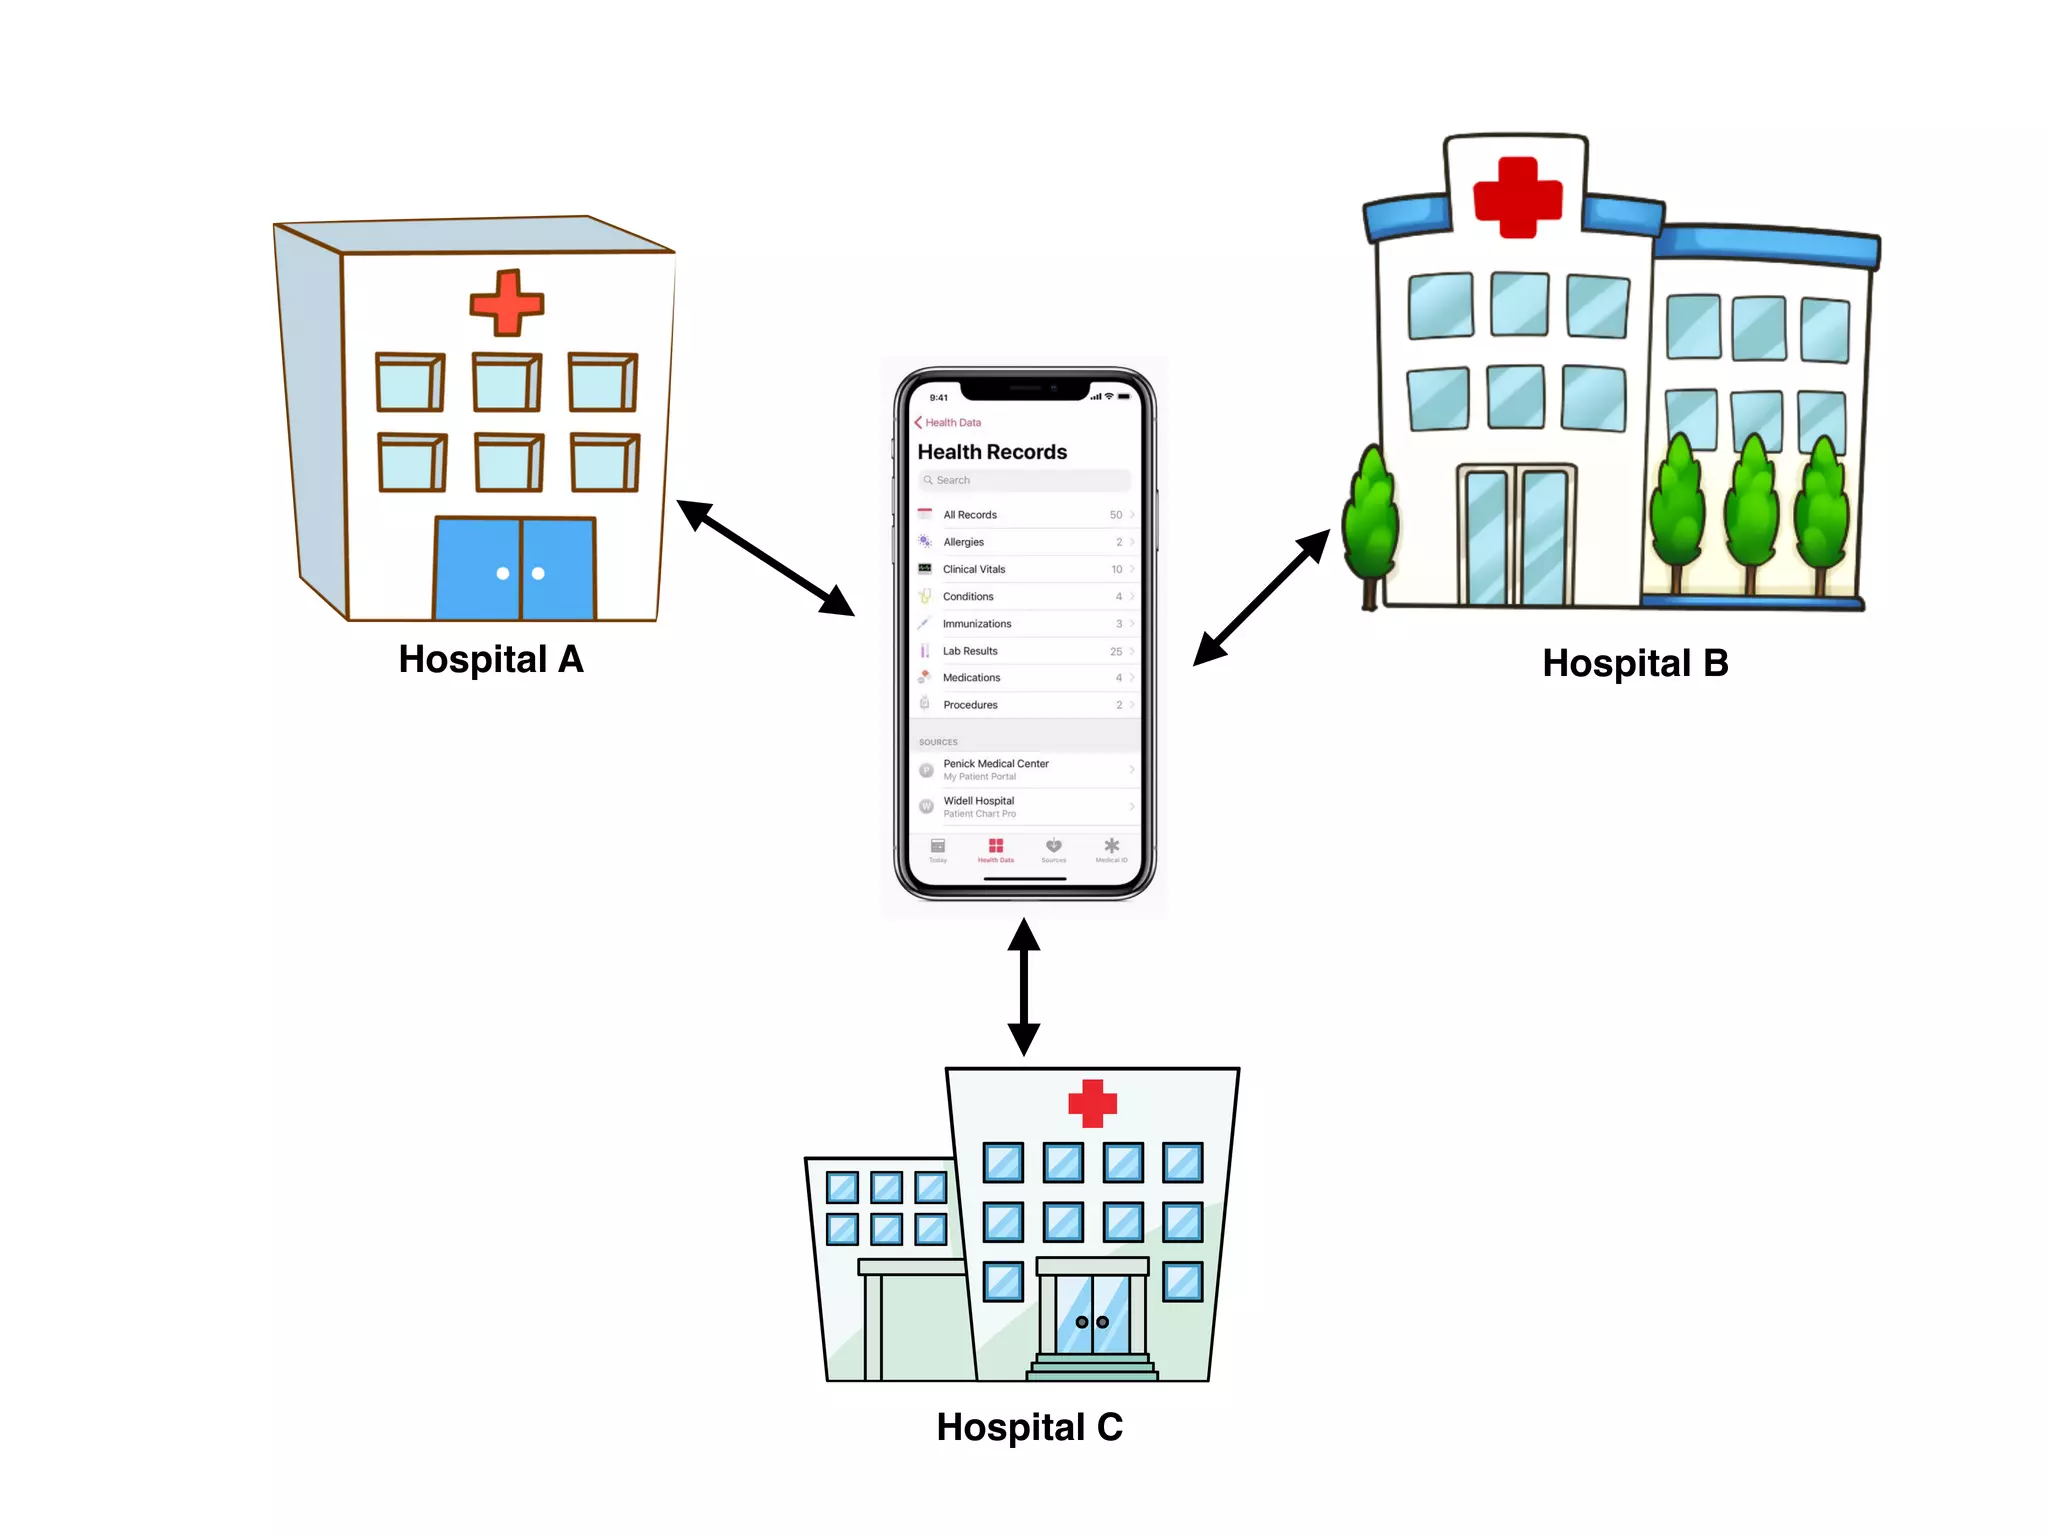
data, a labor-intensive process that discards the vast majority of information in each patient’s record. We propose a representation
of patients’ entire raw EHR records based on the Fast Healthcare Interoperability Resources (FHIR) format. We demonstrate that
deep learning methods using this representation are capable of accurately predicting multiple medical events from multiple
centers without site-specific data harmonization. We validated our approach using de-identified EHR data from two US academic
medical centers with 216,221 adult patients hospitalized for at least 24 h. In the sequential format we propose, this volume of EHR
data unrolled into a total of 46,864,534,945 data points, including clinical notes. Deep learning models achieved high accuracy for
tasks such as predicting: in-hospital mortality (area under the receiver operator curve [AUROC] across sites 0.93–0.94), 30-day
unplanned readmission (AUROC 0.75–0.76), prolonged length of stay (AUROC 0.85–0.86), and all of a patient’s final discharge
diagnoses (frequency-weighted AUROC 0.90). These models outperformed traditional, clinically-used predictive models in all cases.
We believe that this approach can be used to create accurate and scalable predictions for a variety of clinical scenarios. In a case
study of a particular prediction, we demonstrate that neural networks can be used to identify relevant information from the
patient’s chart.
npj Digital Medicine (2018)1:18 ; doi:10.1038/s41746-018-0029-1
INTRODUCTION
The promise of digital medicine stems in part from the hope that,
by digitizing health data, we might more easily leverage computer
information systems to understand and improve care. In fact,
routinely collected patient healthcare data are now approaching
the genomic scale in volume and complexity.1
Unfortunately,
most of this information is not yet used in the sorts of predictive
statistical models clinicians might use to improve care delivery. It
is widely suspected that use of such efforts, if successful, could
provide major benefits not only for patient safety and quality but
also in reducing healthcare costs.2–6
In spite of the richness and potential of available data, scaling
the development of predictive models is difficult because, for
traditional predictive modeling techniques, each outcome to be
predicted requires the creation of a custom dataset with specific
variables.7
It is widely held that 80% of the effort in an analytic
model is preprocessing, merging, customizing, and cleaning
datasets,8,9
not analyzing them for insights. This profoundly limits
the scalability of predictive models.
Another challenge is that the number of potential predictor
variables in the electronic health record (EHR) may easily number
in the thousands, particularly if free-text notes from doctors,
nurses, and other providers are included. Traditional modeling
approaches have dealt with this complexity simply by choosing a
very limited number of commonly collected variables to consider.7
This is problematic because the resulting models may produce
imprecise predictions: false-positive predictions can overwhelm
physicians, nurses, and other providers with false alarms and
concomitant alert fatigue,10
which the Joint Commission identified
as a national patient safety priority in 2014.11
False-negative
predictions can miss significant numbers of clinically important
events, leading to poor clinical outcomes.11,12
Incorporating the
entire EHR, including clinicians’ free-text notes, offers some hope
of overcoming these shortcomings but is unwieldy for most
predictive modeling techniques.
Recent developments in deep learning and artificial neural
networks may allow us to address many of these challenges and
unlock the information in the EHR. Deep learning emerged as the
preferred machine learning approach in machine perception
problems ranging from computer vision to speech recognition,
but has more recently proven useful in natural language
processing, sequence prediction, and mixed modality data
settings.13–17
These systems are known for their ability to handle
large volumes of relatively messy data, including errors in labels
Received: 26 January 2018 Revised: 14 March 2018 Accepted: 26 March 2018
1
Google Inc, Mountain View, CA, USA; 2
University of California, San Francisco, San Francisco, CA, USA; 3
University of Chicago Medicine, Chicago, IL, USA and 4
Stanford University,
Stanford, CA, USA
Correspondence: Alvin Rajkomar (alvinrajkomar@google.com)
These authors contributed equally: Alvin Rajkomar, Eyal Oren
www.nature.com/npjdigitalmed
Published in partnership with the Scripps Translational Science Institute
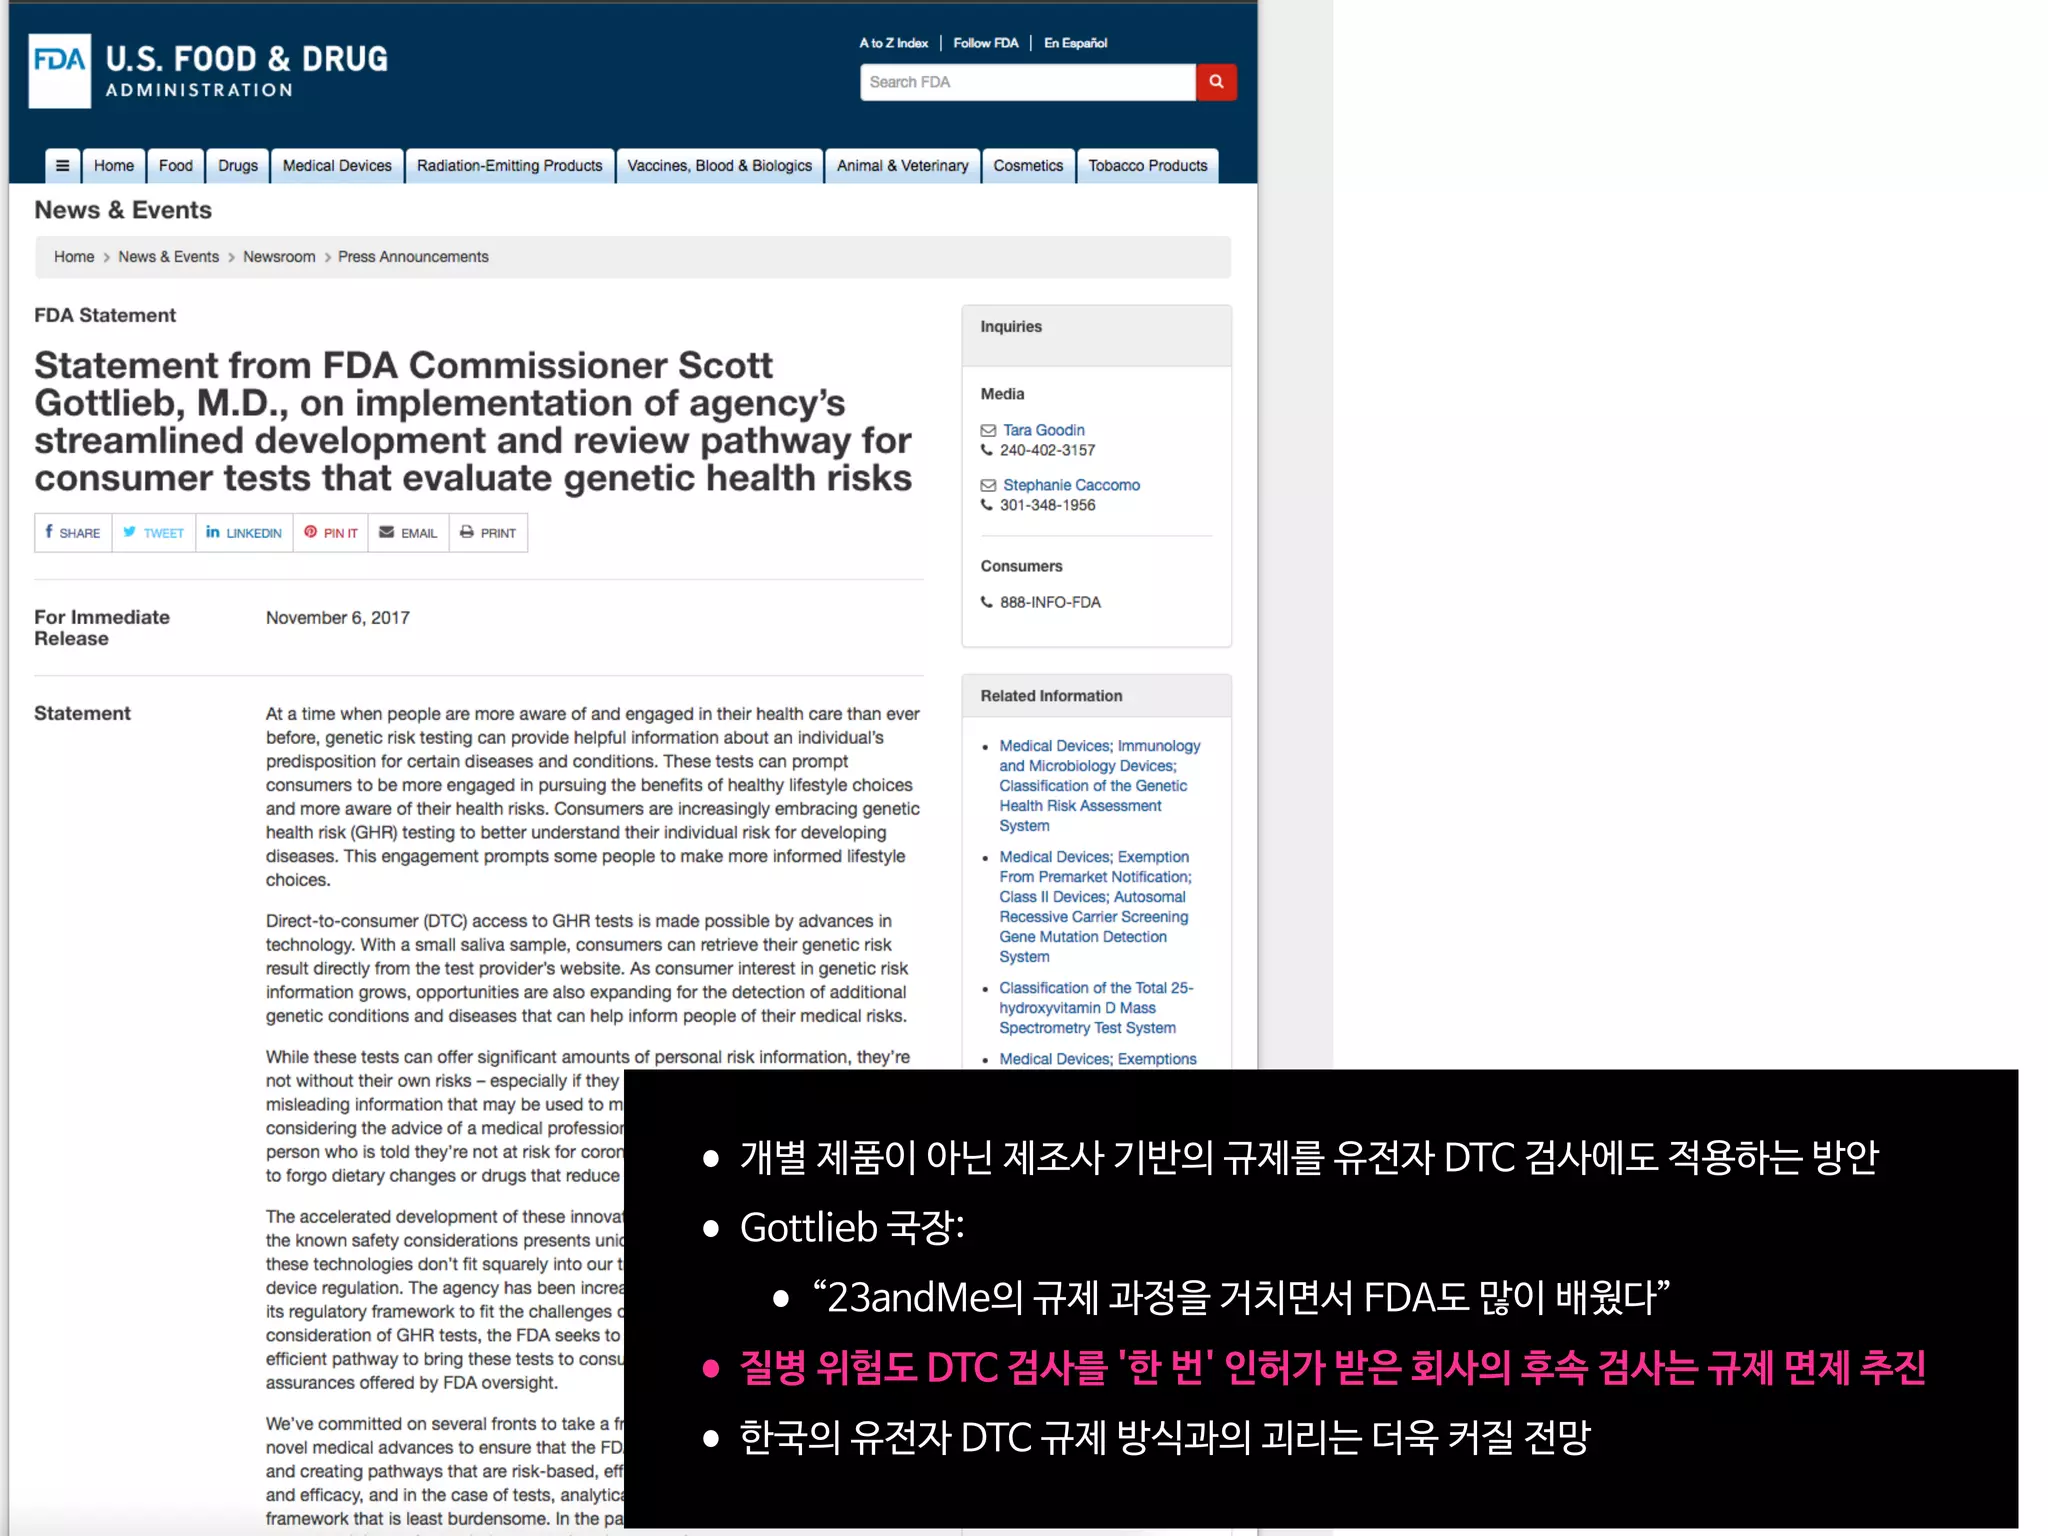
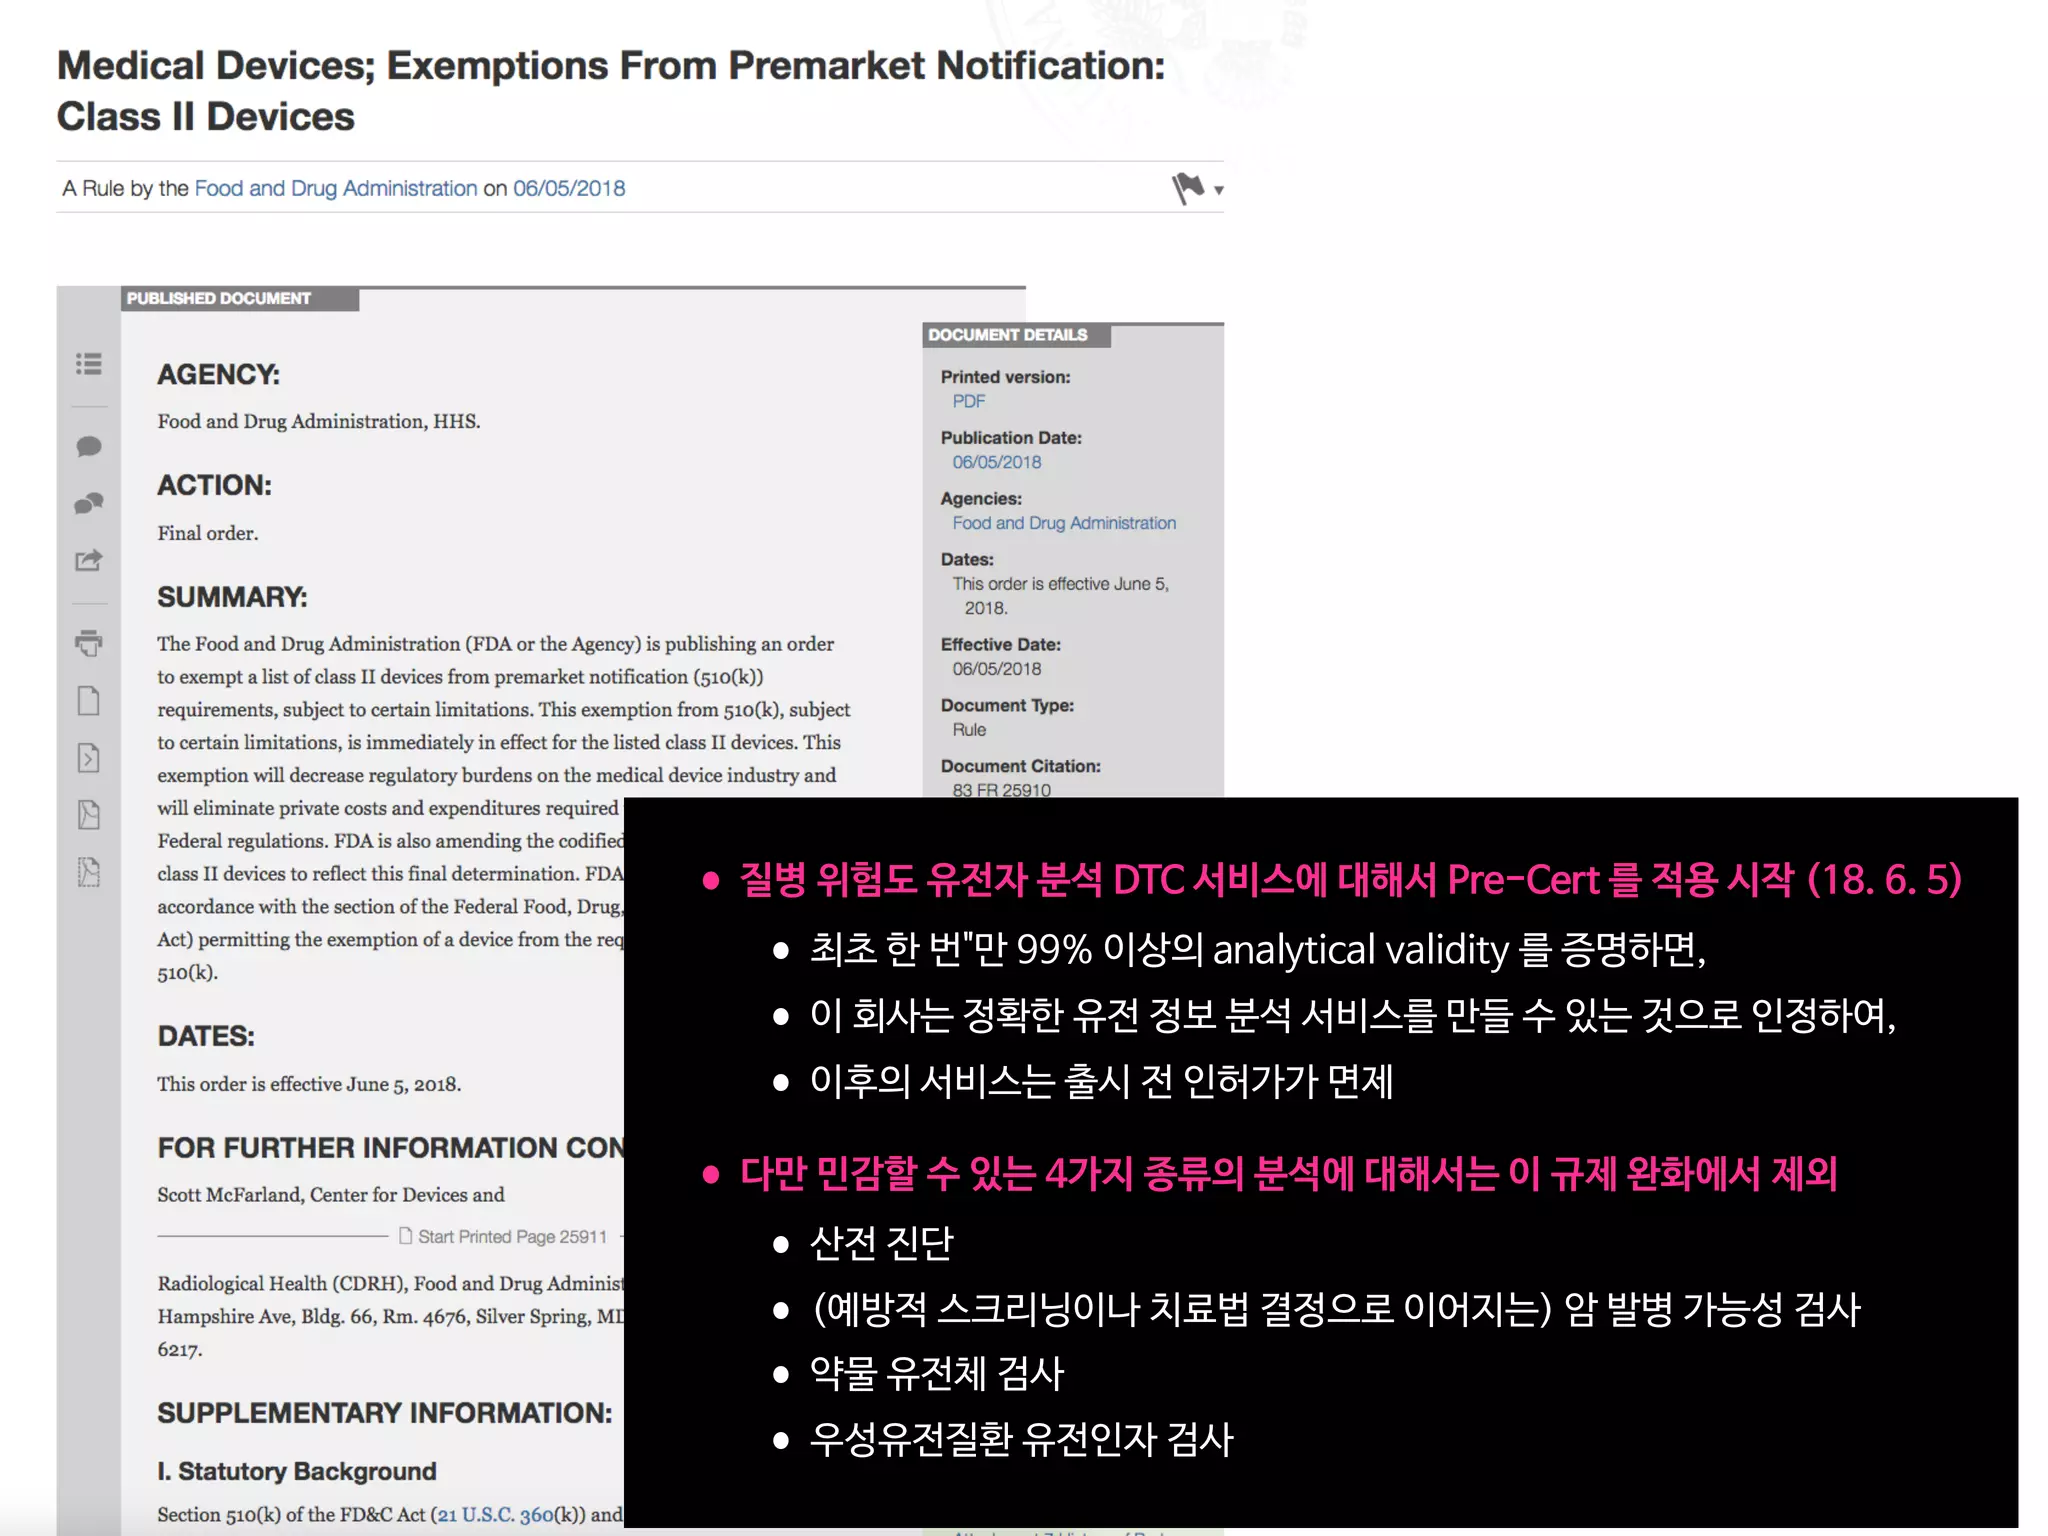
•2018년 1월 구글이 전자의무기록(EMR)을 분석하여, 환자 치료 결과를 예측하는 인공지능 발표
•환자가 입원 중에 사망할 것인지
•장기간 입원할 것인지
•퇴원 후에 30일 내에 재입원할 것인지
•퇴원 시의 진단명
•이번 연구의 특징: 확장성
•과거 다른 연구와 달리 EMR의 일부 데이터를 pre-processing 하지 않고,
•전체 EMR 를 통채로 모두 분석하였음: UCSF, UCM (시카고 대학병원)
•특히, 비정형 데이터인 의사의 진료 노트도 분석
Nat Digi Med 2018](https://image.slidesharecdn.com/digitalhealth-190427130553/75/slide-182-2048.jpg)


![AJR:209, December 2017 1
Since 1992, concerns regarding interob-
server variability in manual bone age esti-
mation [4] have led to the establishment of
several automatic computerized methods for
bone age estimation, including computer-as-
sisted skeletal age scores, computer-aided
skeletal maturation assessment systems, and
BoneXpert (Visiana) [5–14]. BoneXpert was
developed according to traditional machine-
learning techniques and has been shown to
have a good performance for patients of var-
ious ethnicities and in various clinical set-
tings [10–14]. The deep-learning technique
is an improvement in artificial neural net-
works. Unlike traditional machine-learning
techniques, deep-learning techniques allow
an algorithm to program itself by learning
from the images given a large dataset of la-
beled examples, thus removing the need to
specify rules [15].
Deep-learning techniques permit higher
levels of abstraction and improved predic-
tions from data. Deep-learning techniques
Computerized Bone Age
Estimation Using Deep Learning–
Based Program: Evaluation of the
Accuracy and Efficiency
Jeong Rye Kim1
Woo Hyun Shim1
Hee Mang Yoon1
Sang Hyup Hong1
Jin Seong Lee1
Young Ah Cho1
Sangki Kim2
Kim JR, Shim WH, Yoon MH, et al.
1
Department of Radiology and Research Institute of
Radiology, Asan Medical Center, University of Ulsan
College of Medicine, 88 Olympic-ro 43-gil, Songpa-gu,
Seoul 05505, South Korea. Address correspondence to
H. M. Yoon (espoirhm@gmail.com).
2
Vuno Research Center, Vuno Inc., Seoul, South Korea.
Pediatric Imaging • Original Research
Supplemental Data
Available online at www.ajronline.org.
AJR 2017; 209:1–7
0361–803X/17/2096–1
© American Roentgen Ray Society
B
one age estimation is crucial for
developmental status determina-
tions and ultimate height predic-
tions in the pediatric population,
particularly for patients with growth disor-
ders and endocrine abnormalities [1]. Two
major left-hand wrist radiograph-based
methods for bone age estimation are current-
ly used: the Greulich-Pyle [2] and Tanner-
Whitehouse [3] methods. The former is much
more frequently used in clinical practice.
Greulich-Pyle–based bone age estimation is
performed by comparing a patient’s left-hand
radiograph to standard radiographs in the
Greulich-Pyle atlas and is therefore simple
and easily applied in clinical practice. How-
ever, the process of bone age estimation,
which comprises a simple comparison of
multiple images, can be repetitive and time
consuming and is thus sometimes burden-
some to radiologists. Moreover, the accuracy
depends on the radiologist’s experience and
tends to be subjective.
Keywords: bone age, children, deep learning, neural
network model
DOI:10.2214/AJR.17.18224
J. R. Kim and W. H. Shim contributed equally to this work.
Received March 12, 2017; accepted after revision
July 7, 2017.
S. Kim is employed by Vuno, Inc., which created the deep
learning–based automatic software system for bone
age determination. J. R. Kim, W. H. Shim, H. M. Yoon,
S. H. Hong, J. S. Lee, and Y. A. Cho are employed by
Asan Medical Center, which holds patent rights for the
deep learning–based automatic software system for
bone age assessment.
OBJECTIVE. The purpose of this study is to evaluate the accuracy and efficiency of a
new automatic software system for bone age assessment and to validate its feasibility in clini-
cal practice.
MATERIALS AND METHODS. A Greulich-Pyle method–based deep-learning tech-
nique was used to develop the automatic software system for bone age determination. Using
this software, bone age was estimated from left-hand radiographs of 200 patients (3–17 years
old) using first-rank bone age (software only), computer-assisted bone age (two radiologists
with software assistance), and Greulich-Pyle atlas–assisted bone age (two radiologists with
Greulich-Pyle atlas assistance only). The reference bone age was determined by the consen-
sus of two experienced radiologists.
RESULTS. First-rank bone ages determined by the automatic software system showed a
69.5% concordance rate and significant correlations with the reference bone age (r = 0.992;
p < 0.001). Concordance rates increased with the use of the automatic software system for
both reviewer 1 (63.0% for Greulich-Pyle atlas–assisted bone age vs 72.5% for computer-as-
sisted bone age) and reviewer 2 (49.5% for Greulich-Pyle atlas–assisted bone age vs 57.5% for
computer-assisted bone age). Reading times were reduced by 18.0% and 40.0% for reviewers
1 and 2, respectively.
CONCLUSION. Automatic software system showed reliably accurate bone age estima-
tions and appeared to enhance efficiency by reducing reading times without compromising
the diagnostic accuracy.
Kim et al.
Accuracy and Efficiency of Computerized Bone Age Estimation
Pediatric Imaging
Original Research
Downloadedfromwww.ajronline.orgbyFloridaAtlanticUnivon09/13/17fromIPaddress131.91.169.193.CopyrightARRS.Forpersonaluseonly;allrightsreserved
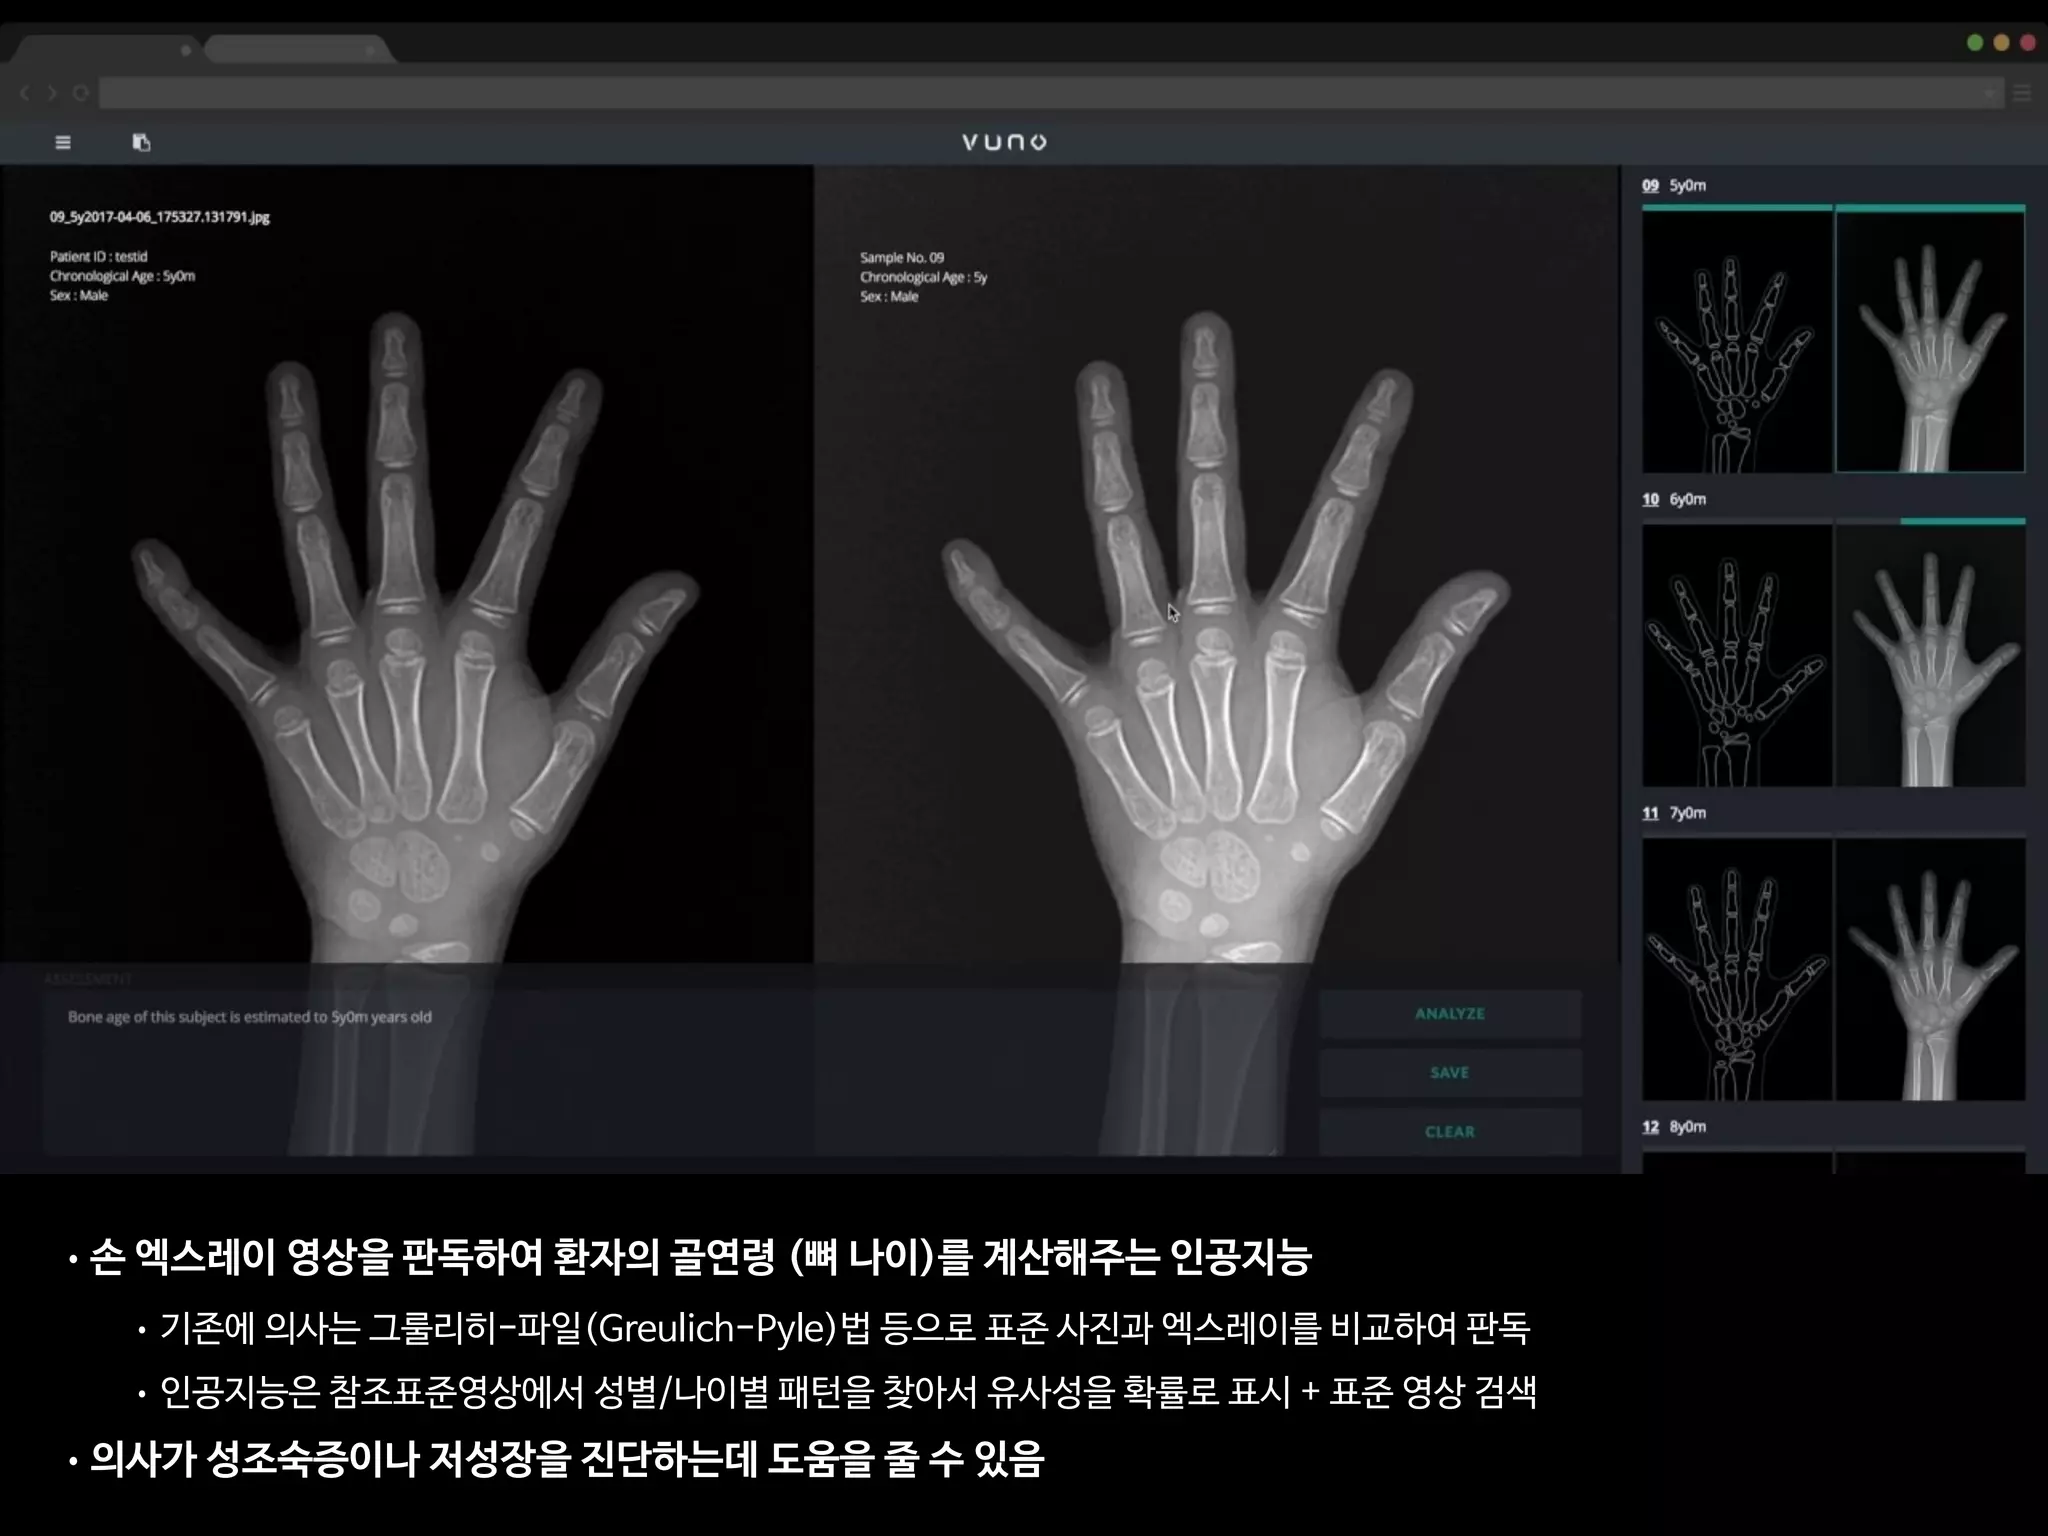
• 총 환자의 수: 200명
• 레퍼런스: 경험 많은 소아영상의학과 전문의 2명(18년, 4년 경력)의 컨센서스
• 의사A: 소아영상 세부전공한 영상의학 전문의 (500례 이상의 판독 경험)
• 의사B: 영상의학과 2년차 전공의 (판독법 하루 교육 이수 + 20례 판독)
• 인공지능: VUNO의 골연령 판독 딥러닝
AJR Am J Roentgenol. 2017 Dec;209(6):1374-1380.](https://image.slidesharecdn.com/digitalhealth-190427130553/75/slide-193-2048.jpg)


![This copy is for personal use only.
To order printed copies, contact reprints@rsna.org
This copy is for personal use only.
To order printed copies, contact reprints@rsna.org
ORIGINAL RESEARCH • THORACIC IMAGING
hest radiography, one of the most common diagnos- intraobserver agreements because of its limited spatial reso-
Development and Validation of Deep
Learning–based Automatic Detection
Algorithm for Malignant Pulmonary Nodules
on Chest Radiographs
Ju Gang Nam, MD* • Sunggyun Park, PhD* • Eui Jin Hwang, MD • Jong Hyuk Lee, MD • Kwang-Nam Jin, MD,
PhD • KunYoung Lim, MD, PhD • Thienkai HuyVu, MD, PhD • Jae Ho Sohn, MD • Sangheum Hwang, PhD • Jin
Mo Goo, MD, PhD • Chang Min Park, MD, PhD
From the Department of Radiology and Institute of Radiation Medicine, Seoul National University Hospital and College of Medicine, 101 Daehak-ro, Jongno-gu, Seoul
03080, Republic of Korea (J.G.N., E.J.H., J.M.G., C.M.P.); Lunit Incorporated, Seoul, Republic of Korea (S.P.); Department of Radiology, Armed Forces Seoul Hospital,
Seoul, Republic of Korea (J.H.L.); Department of Radiology, Seoul National University Boramae Medical Center, Seoul, Republic of Korea (K.N.J.); Department of
Radiology, National Cancer Center, Goyang, Republic of Korea (K.Y.L.); Department of Radiology and Biomedical Imaging, University of California, San Francisco,
San Francisco, Calif (T.H.V., J.H.S.); and Department of Industrial & Information Systems Engineering, Seoul National University of Science and Technology, Seoul,
Republic of Korea (S.H.). Received January 30, 2018; revision requested March 20; revision received July 29; accepted August 6. Address correspondence to C.M.P.
(e-mail: cmpark.morphius@gmail.com).
Study supported by SNUH Research Fund and Lunit (06–2016–3000) and by Seoul Research and Business Development Program (FI170002).
*J.G.N. and S.P. contributed equally to this work.
Conflicts of interest are listed at the end of this article.
Radiology 2018; 00:1–11 • https://doi.org/10.1148/radiol.2018180237 • Content codes:
Purpose: To develop and validate a deep learning–based automatic detection algorithm (DLAD) for malignant pulmonary nodules
on chest radiographs and to compare its performance with physicians including thoracic radiologists.
Materials and Methods: For this retrospective study, DLAD was developed by using 43292 chest radiographs (normal radiograph–
to–nodule radiograph ratio, 34067:9225) in 34676 patients (healthy-to-nodule ratio, 30784:3892; 19230 men [mean age, 52.8
years; age range, 18–99 years]; 15446 women [mean age, 52.3 years; age range, 18–98 years]) obtained between 2010 and 2015,
which were labeled and partially annotated by 13 board-certified radiologists, in a convolutional neural network. Radiograph clas-
sification and nodule detection performances of DLAD were validated by using one internal and four external data sets from three
South Korean hospitals and one U.S. hospital. For internal and external validation, radiograph classification and nodule detection
performances of DLAD were evaluated by using the area under the receiver operating characteristic curve (AUROC) and jackknife
alternative free-response receiver-operating characteristic (JAFROC) figure of merit (FOM), respectively. An observer performance
test involving 18 physicians, including nine board-certified radiologists, was conducted by using one of the four external validation
data sets. Performances of DLAD, physicians, and physicians assisted with DLAD were evaluated and compared.
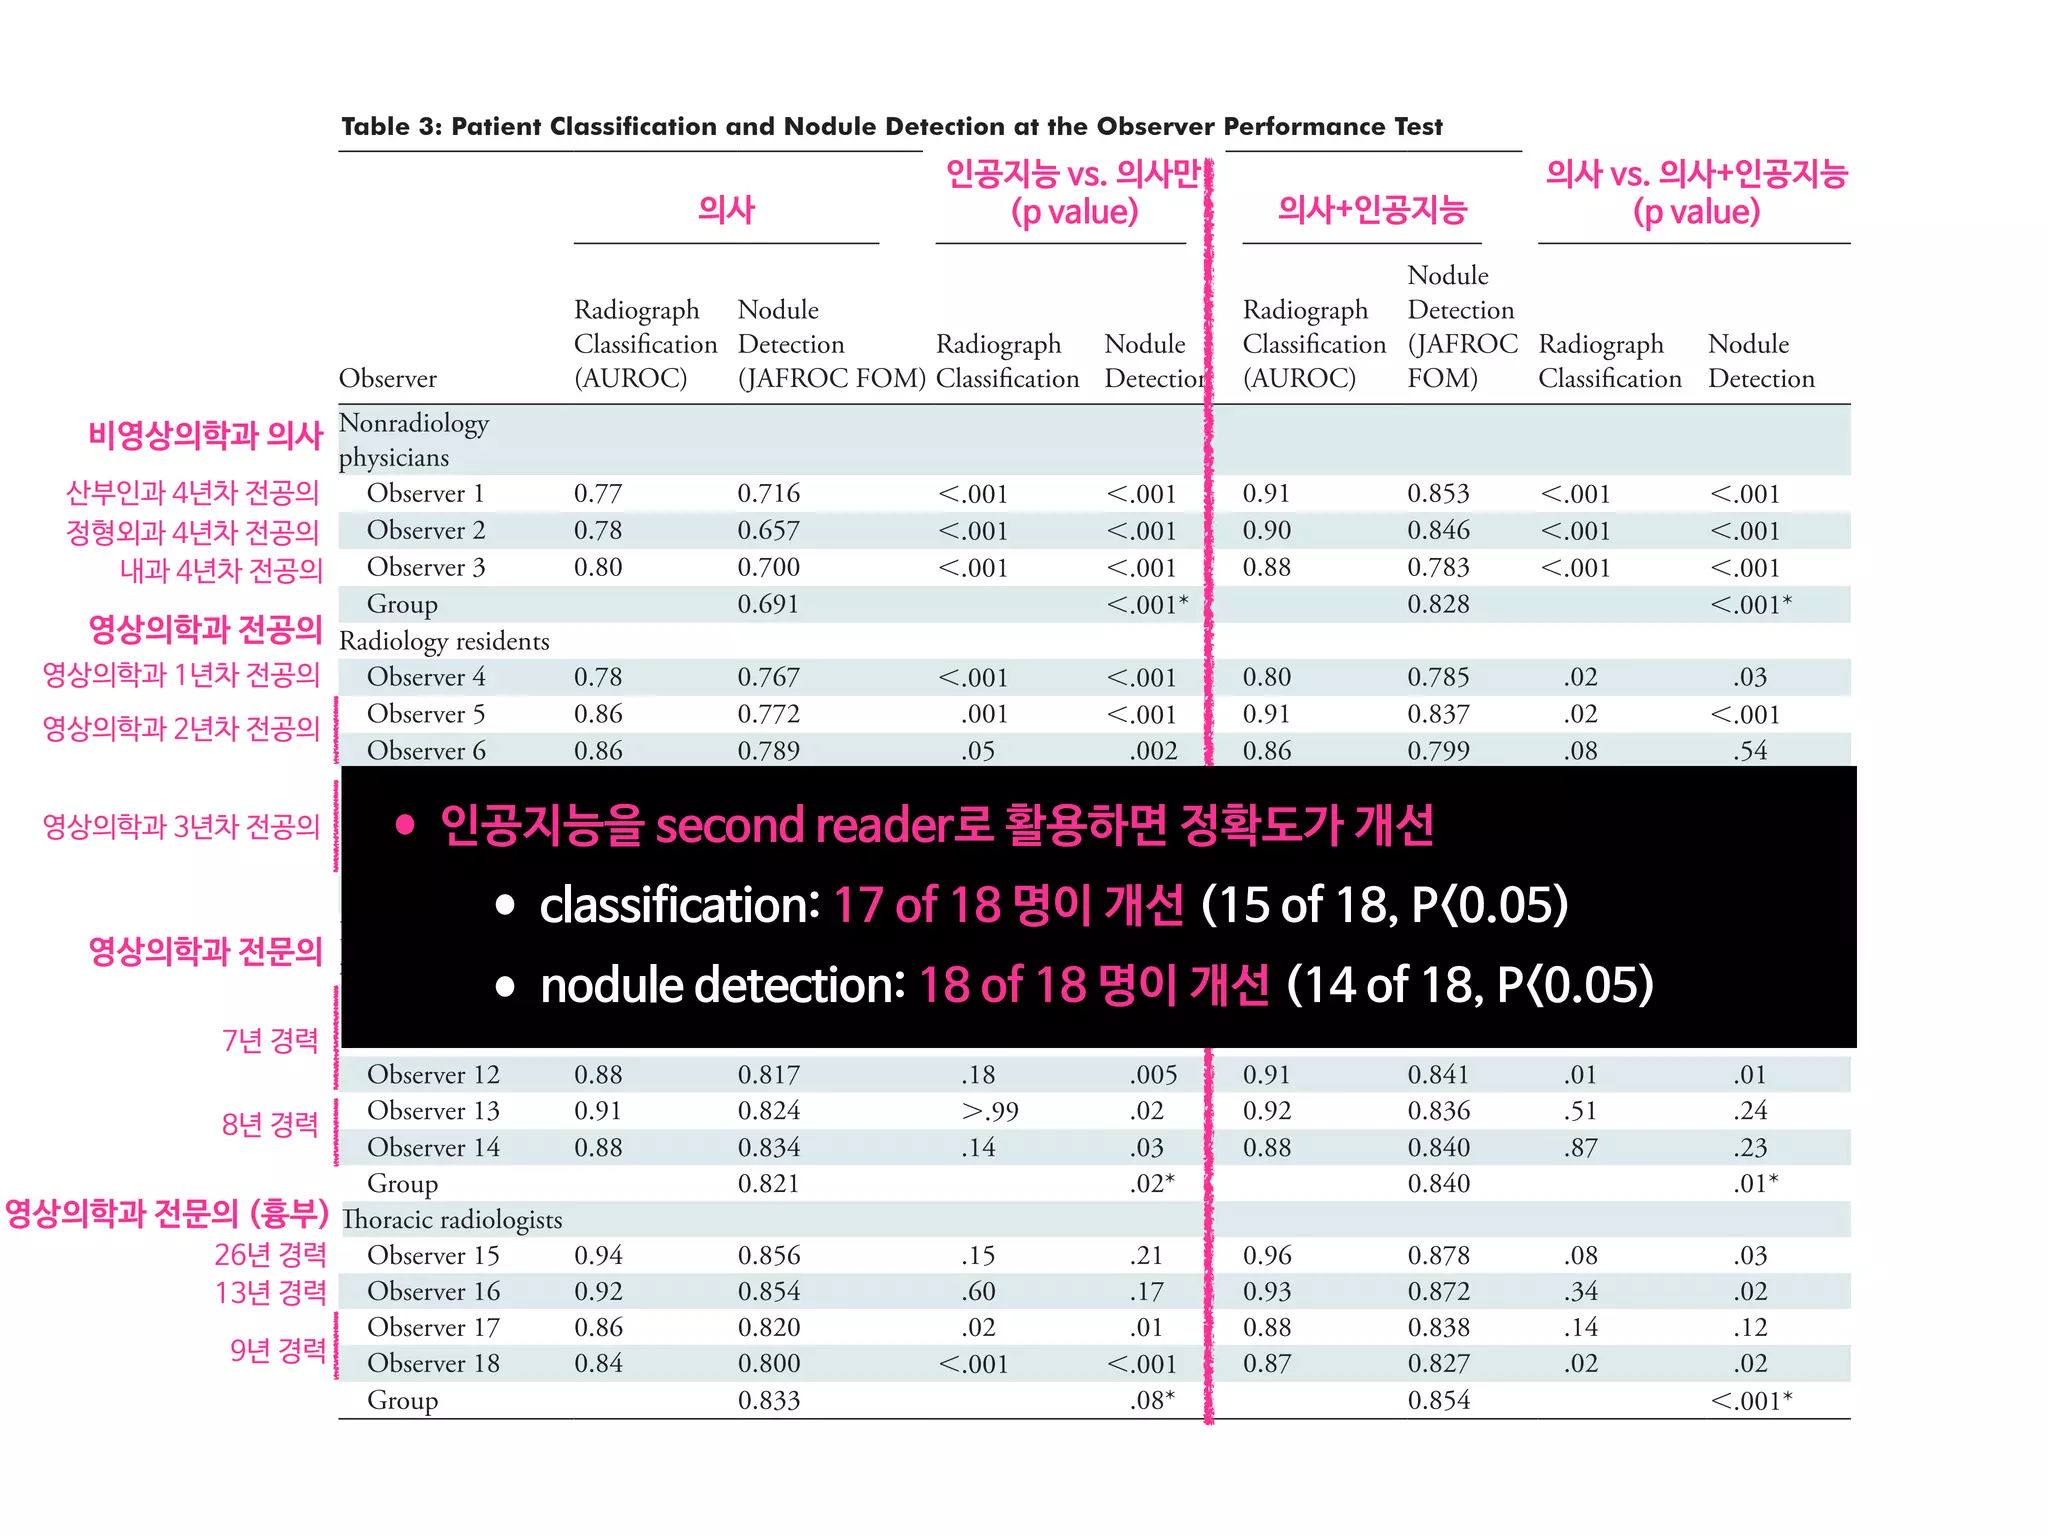
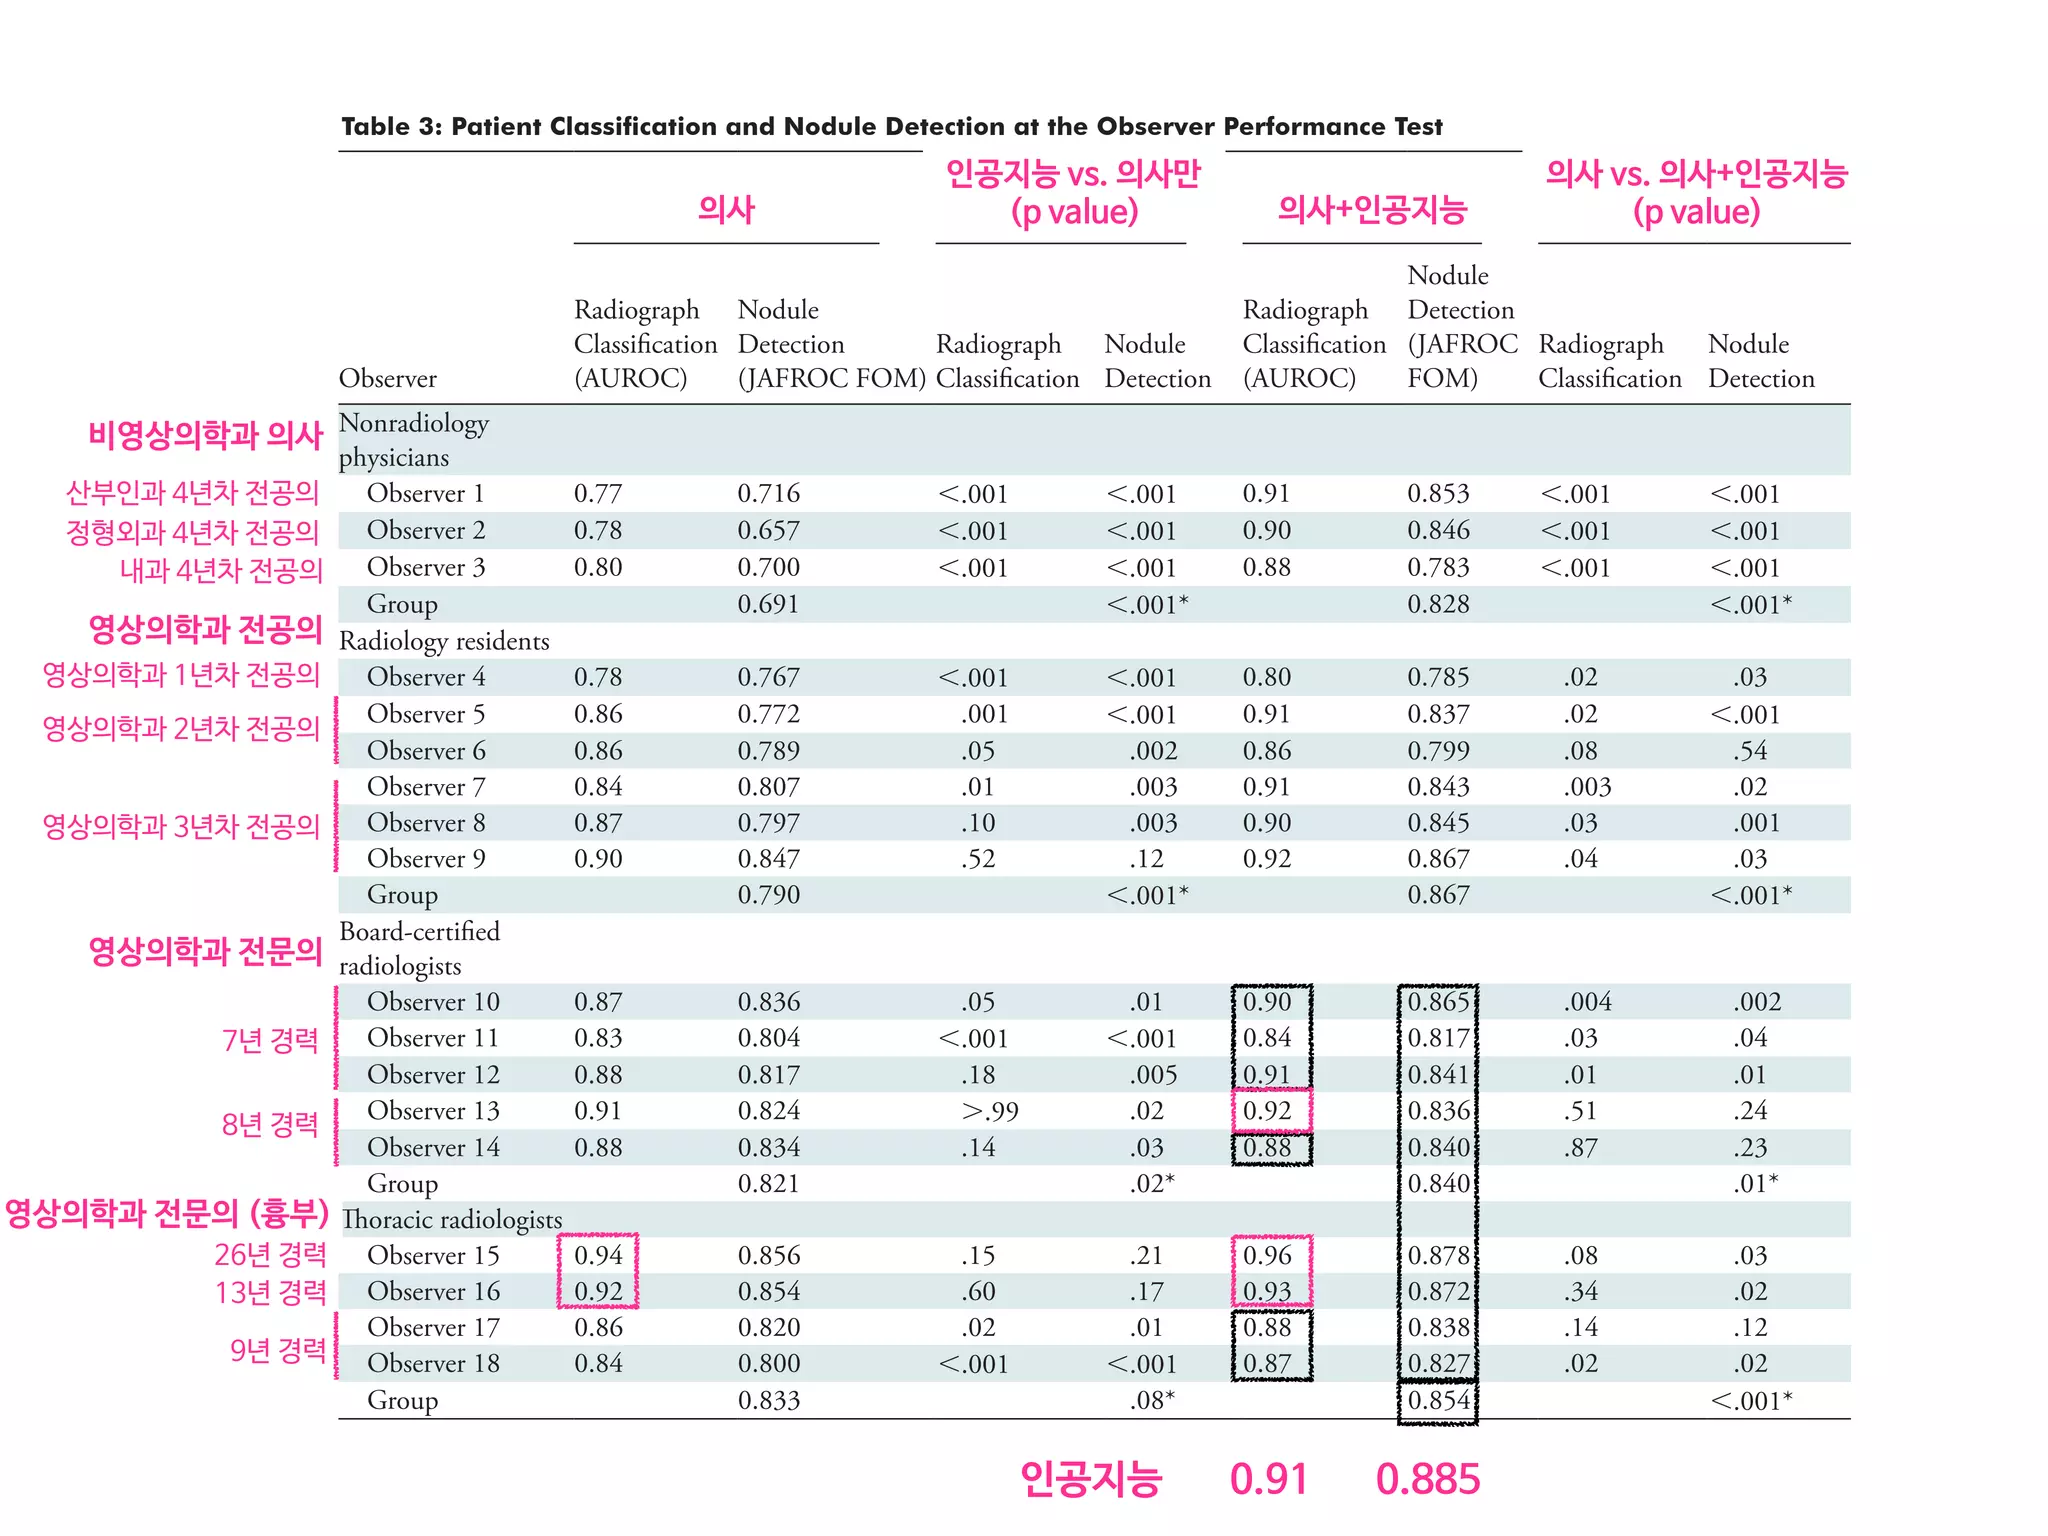
Results: According to one internal and four external validation data sets, radiograph classification and nodule detection perfor-
mances of DLAD were a range of 0.92–0.99 (AUROC) and 0.831–0.924 (JAFROC FOM), respectively. DLAD showed a higher
AUROC and JAFROC FOM at the observer performance test than 17 of 18 and 15 of 18 physicians, respectively (P , .05), and
all physicians showed improved nodule detection performances with DLAD (mean JAFROC FOM improvement, 0.043; range,
0.006–0.190; P , .05).
Conclusion: This deep learning–based automatic detection algorithm outperformed physicians in radiograph classification and nod-
ule detection performance for malignant pulmonary nodules on chest radiographs, and it enhanced physicians’ performances when
used as a second reader.
©RSNA, 2018
Online supplemental material is available for this article.
• 43,292 chest PA (normal:nodule=34,067:9225)
• labeled/annotated by 13 board-certified radiologists.
• DLAD were validated 1 internal + 4 external datasets
• 서울대병원 / 보라매병원 / 국립암센터 / UCSF
• Classification / Lesion localization
• 인공지능 vs. 의사 vs. 인공지능+의사
• 다양한 수준의 의사와 비교
• Non-radiology / radiology residents
• Board-certified radiologist / Thoracic radiologists](https://image.slidesharecdn.com/digitalhealth-190427130553/75/slide-197-2048.jpg)


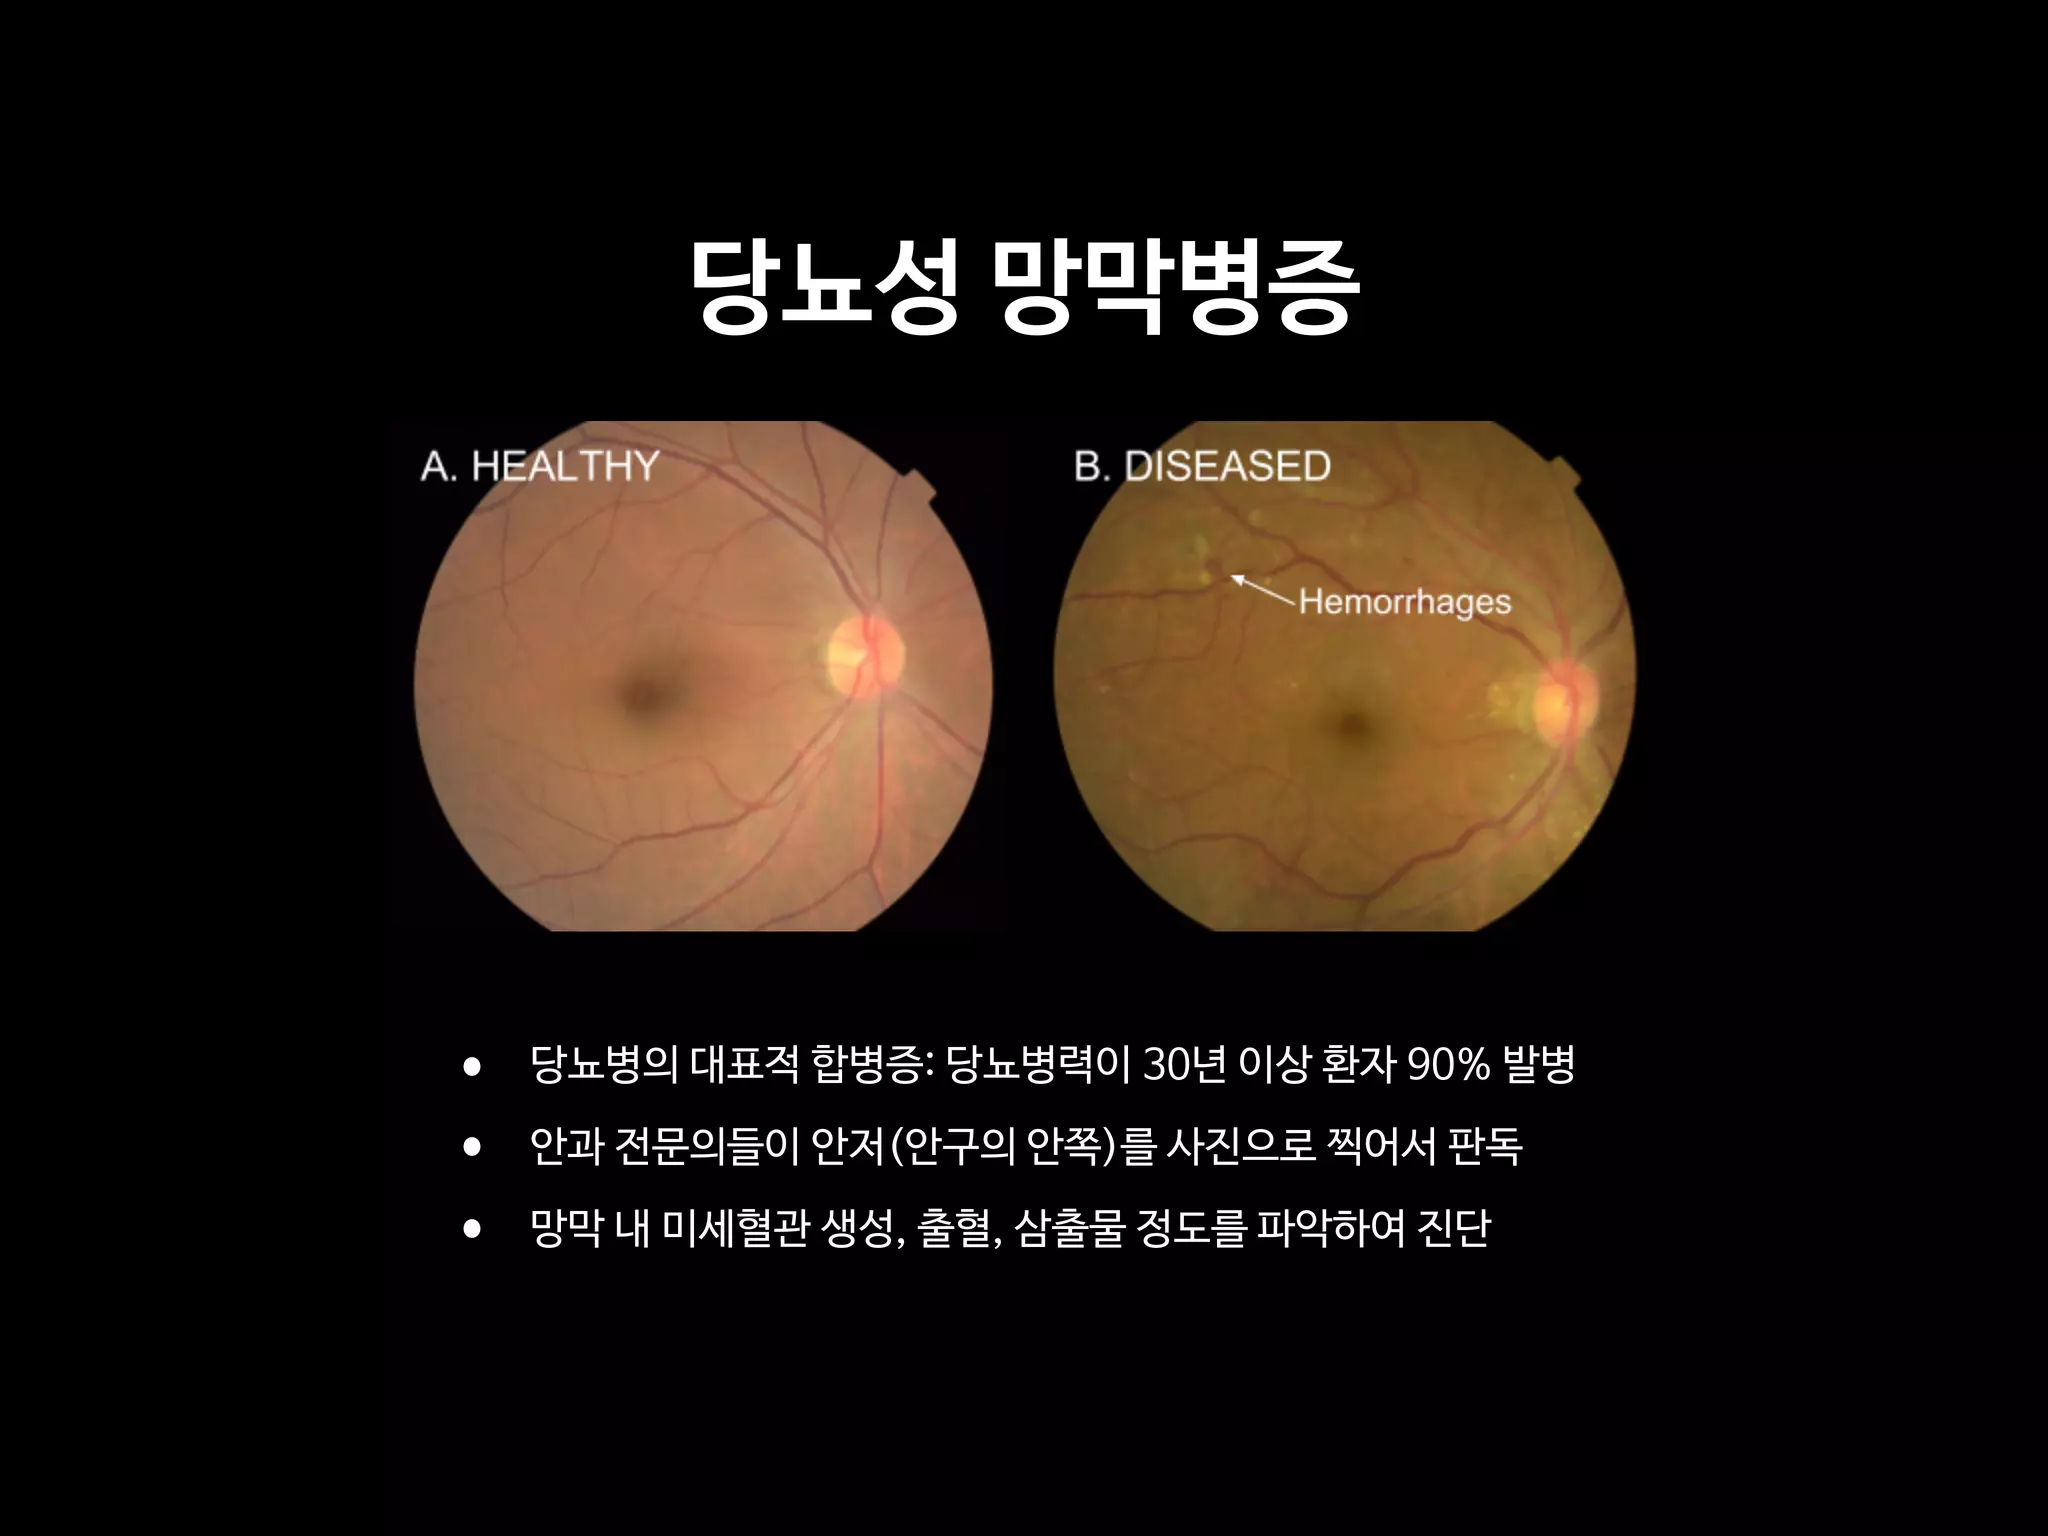
![Copyright 2016 American Medical Association. All rights reserved.
Development and Validation of a Deep Learning Algorithm
for Detection of Diabetic Retinopathy
in Retinal Fundus Photographs
Varun Gulshan, PhD; Lily Peng, MD, PhD; Marc Coram, PhD; Martin C. Stumpe, PhD; Derek Wu, BS; Arunachalam Narayanaswamy, PhD;
Subhashini Venugopalan, MS; Kasumi Widner, MS; Tom Madams, MEng; Jorge Cuadros, OD, PhD; Ramasamy Kim, OD, DNB;
Rajiv Raman, MS, DNB; Philip C. Nelson, BS; Jessica L. Mega, MD, MPH; Dale R. Webster, PhD
IMPORTANCE Deep learning is a family of computational methods that allow an algorithm to
program itself by learning from a large set of examples that demonstrate the desired
behavior, removing the need to specify rules explicitly. Application of these methods to
medical imaging requires further assessment and validation.
OBJECTIVE To apply deep learning to create an algorithm for automated detection of diabetic
retinopathy and diabetic macular edema in retinal fundus photographs.
DESIGN AND SETTING A specific type of neural network optimized for image classification
called a deep convolutional neural network was trained using a retrospective development
data set of 128 175 retinal images, which were graded 3 to 7 times for diabetic retinopathy,
diabetic macular edema, and image gradability by a panel of 54 US licensed ophthalmologists
and ophthalmology senior residents between May and December 2015. The resultant
algorithm was validated in January and February 2016 using 2 separate data sets, both
graded by at least 7 US board-certified ophthalmologists with high intragrader consistency.
EXPOSURE Deep learning–trained algorithm.
MAIN OUTCOMES AND MEASURES The sensitivity and specificity of the algorithm for detecting
referable diabetic retinopathy (RDR), defined as moderate and worse diabetic retinopathy,
referable diabetic macular edema, or both, were generated based on the reference standard
of the majority decision of the ophthalmologist panel. The algorithm was evaluated at 2
operating points selected from the development set, one selected for high specificity and
another for high sensitivity.
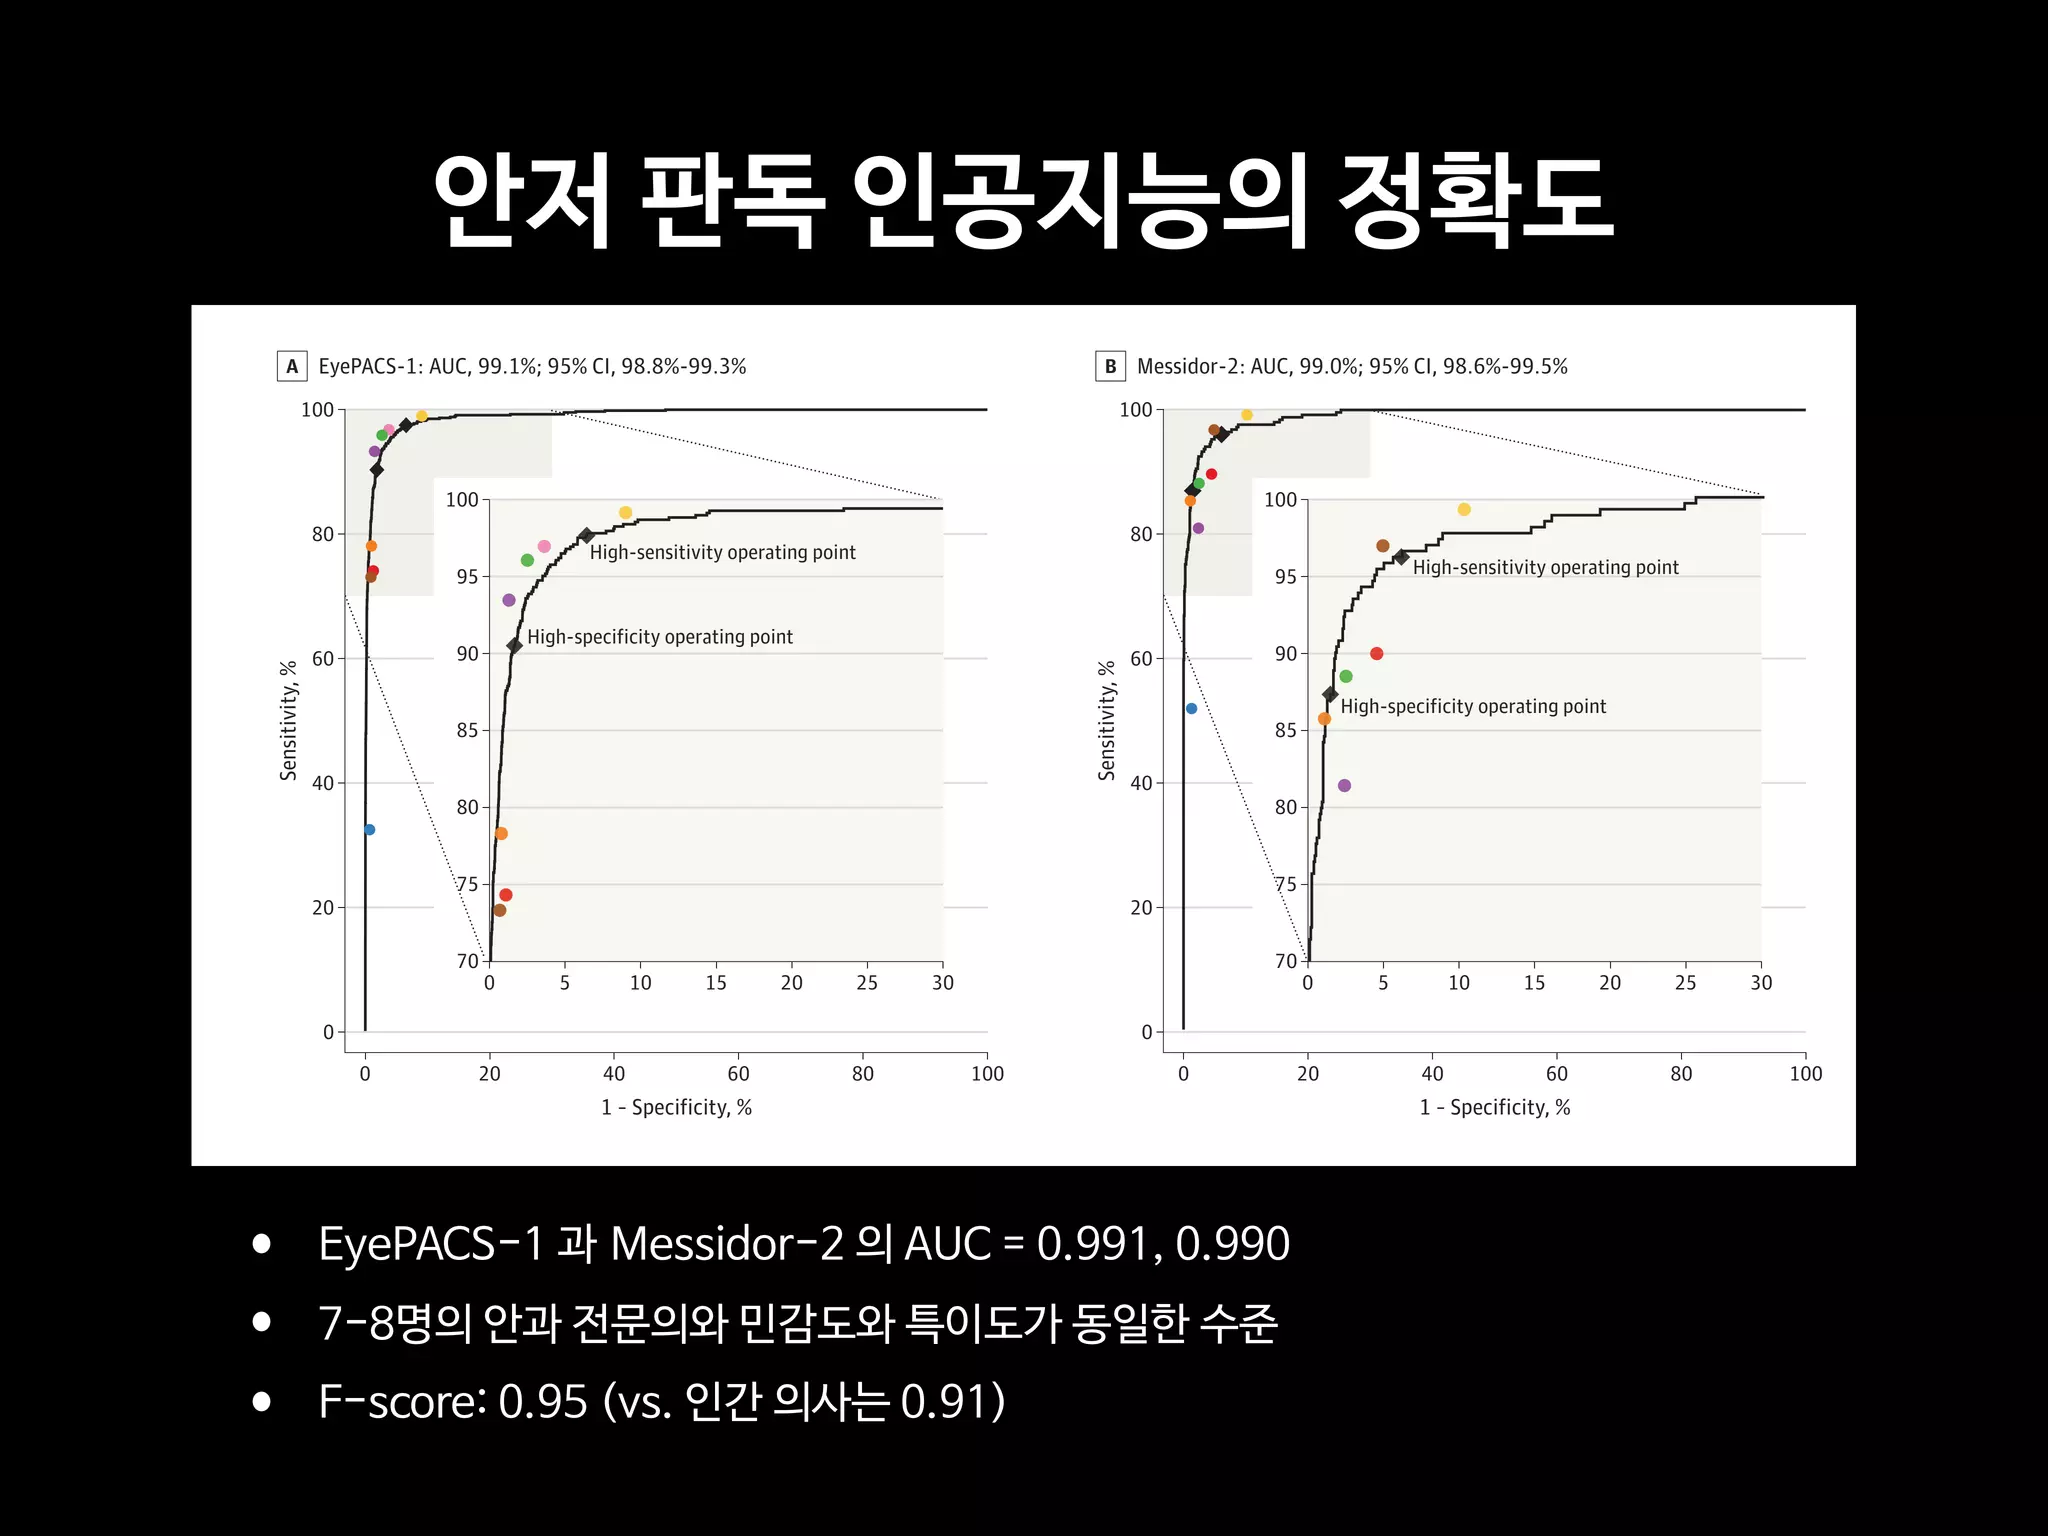
RESULTS TheEyePACS-1datasetconsistedof9963imagesfrom4997patients(meanage,54.4
years;62.2%women;prevalenceofRDR,683/8878fullygradableimages[7.8%]);the
Messidor-2datasethad1748imagesfrom874patients(meanage,57.6years;42.6%women;
prevalenceofRDR,254/1745fullygradableimages[14.6%]).FordetectingRDR,thealgorithm
hadanareaunderthereceiveroperatingcurveof0.991(95%CI,0.988-0.993)forEyePACS-1and
0.990(95%CI,0.986-0.995)forMessidor-2.Usingthefirstoperatingcutpointwithhigh
specificity,forEyePACS-1,thesensitivitywas90.3%(95%CI,87.5%-92.7%)andthespecificity
was98.1%(95%CI,97.8%-98.5%).ForMessidor-2,thesensitivitywas87.0%(95%CI,81.1%-
91.0%)andthespecificitywas98.5%(95%CI,97.7%-99.1%).Usingasecondoperatingpoint
withhighsensitivityinthedevelopmentset,forEyePACS-1thesensitivitywas97.5%and
specificitywas93.4%andforMessidor-2thesensitivitywas96.1%andspecificitywas93.9%.
CONCLUSIONS AND RELEVANCE In this evaluation of retinal fundus photographs from adults
with diabetes, an algorithm based on deep machine learning had high sensitivity and
specificity for detecting referable diabetic retinopathy. Further research is necessary to
determine the feasibility of applying this algorithm in the clinical setting and to determine
whether use of the algorithm could lead to improved care and outcomes compared with
current ophthalmologic assessment.
JAMA. doi:10.1001/jama.2016.17216
Published online November 29, 2016.
Editorial
Supplemental content
Author Affiliations: Google Inc,
Mountain View, California (Gulshan,
Peng, Coram, Stumpe, Wu,
Narayanaswamy, Venugopalan,
Widner, Madams, Nelson, Webster);
Department of Computer Science,
University of Texas, Austin
(Venugopalan); EyePACS LLC,
San Jose, California (Cuadros); School
of Optometry, Vision Science
Graduate Group, University of
California, Berkeley (Cuadros);
Aravind Medical Research
Foundation, Aravind Eye Care
System, Madurai, India (Kim); Shri
Bhagwan Mahavir Vitreoretinal
Services, Sankara Nethralaya,
Chennai, Tamil Nadu, India (Raman);
Verily Life Sciences, Mountain View,
California (Mega); Cardiovascular
Division, Department of Medicine,
Brigham and Women’s Hospital and
Harvard Medical School, Boston,
Massachusetts (Mega).
Corresponding Author: Lily Peng,
MD, PhD, Google Research, 1600
Amphitheatre Way, Mountain View,
CA 94043 (lhpeng@google.com).
Research
JAMA | Original Investigation | INNOVATIONS IN HEALTH CARE DELIVERY
(Reprinted) E1
Copyright 2016 American Medical Association. All rights reserved.](https://image.slidesharecdn.com/digitalhealth-190427130553/75/slide-206-2048.jpg)


![Fig 1. What can consumer wearables do? Heart rate can be measured with an oximeter built into a ring [3], muscle activity with an electromyographi
sensor embedded into clothing [4], stress with an electodermal sensor incorporated into a wristband [5], and physical activity or sleep patterns via an
accelerometer in a watch [6,7]. In addition, a female’s most fertile period can be identified with detailed body temperature tracking [8], while levels of me
attention can be monitored with a small number of non-gelled electroencephalogram (EEG) electrodes [9]. Levels of social interaction (also known to a
PLOS Medicine 2016](https://image.slidesharecdn.com/digitalhealth-190427130553/75/slide-225-2048.jpg)
![S E P S I S
A targeted real-time early warning score (TREWScore)
for septic shock
Katharine E. Henry,1
David N. Hager,2
Peter J. Pronovost,3,4,5
Suchi Saria1,3,5,6
*
Sepsis is a leading cause of death in the United States, with mortality highest among patients who develop septic
shock. Early aggressive treatment decreases morbidity and mortality. Although automated screening tools can detect
patients currently experiencing severe sepsis and septic shock, none predict those at greatest risk of developing
shock. We analyzed routinely available physiological and laboratory data from intensive care unit patients and devel-
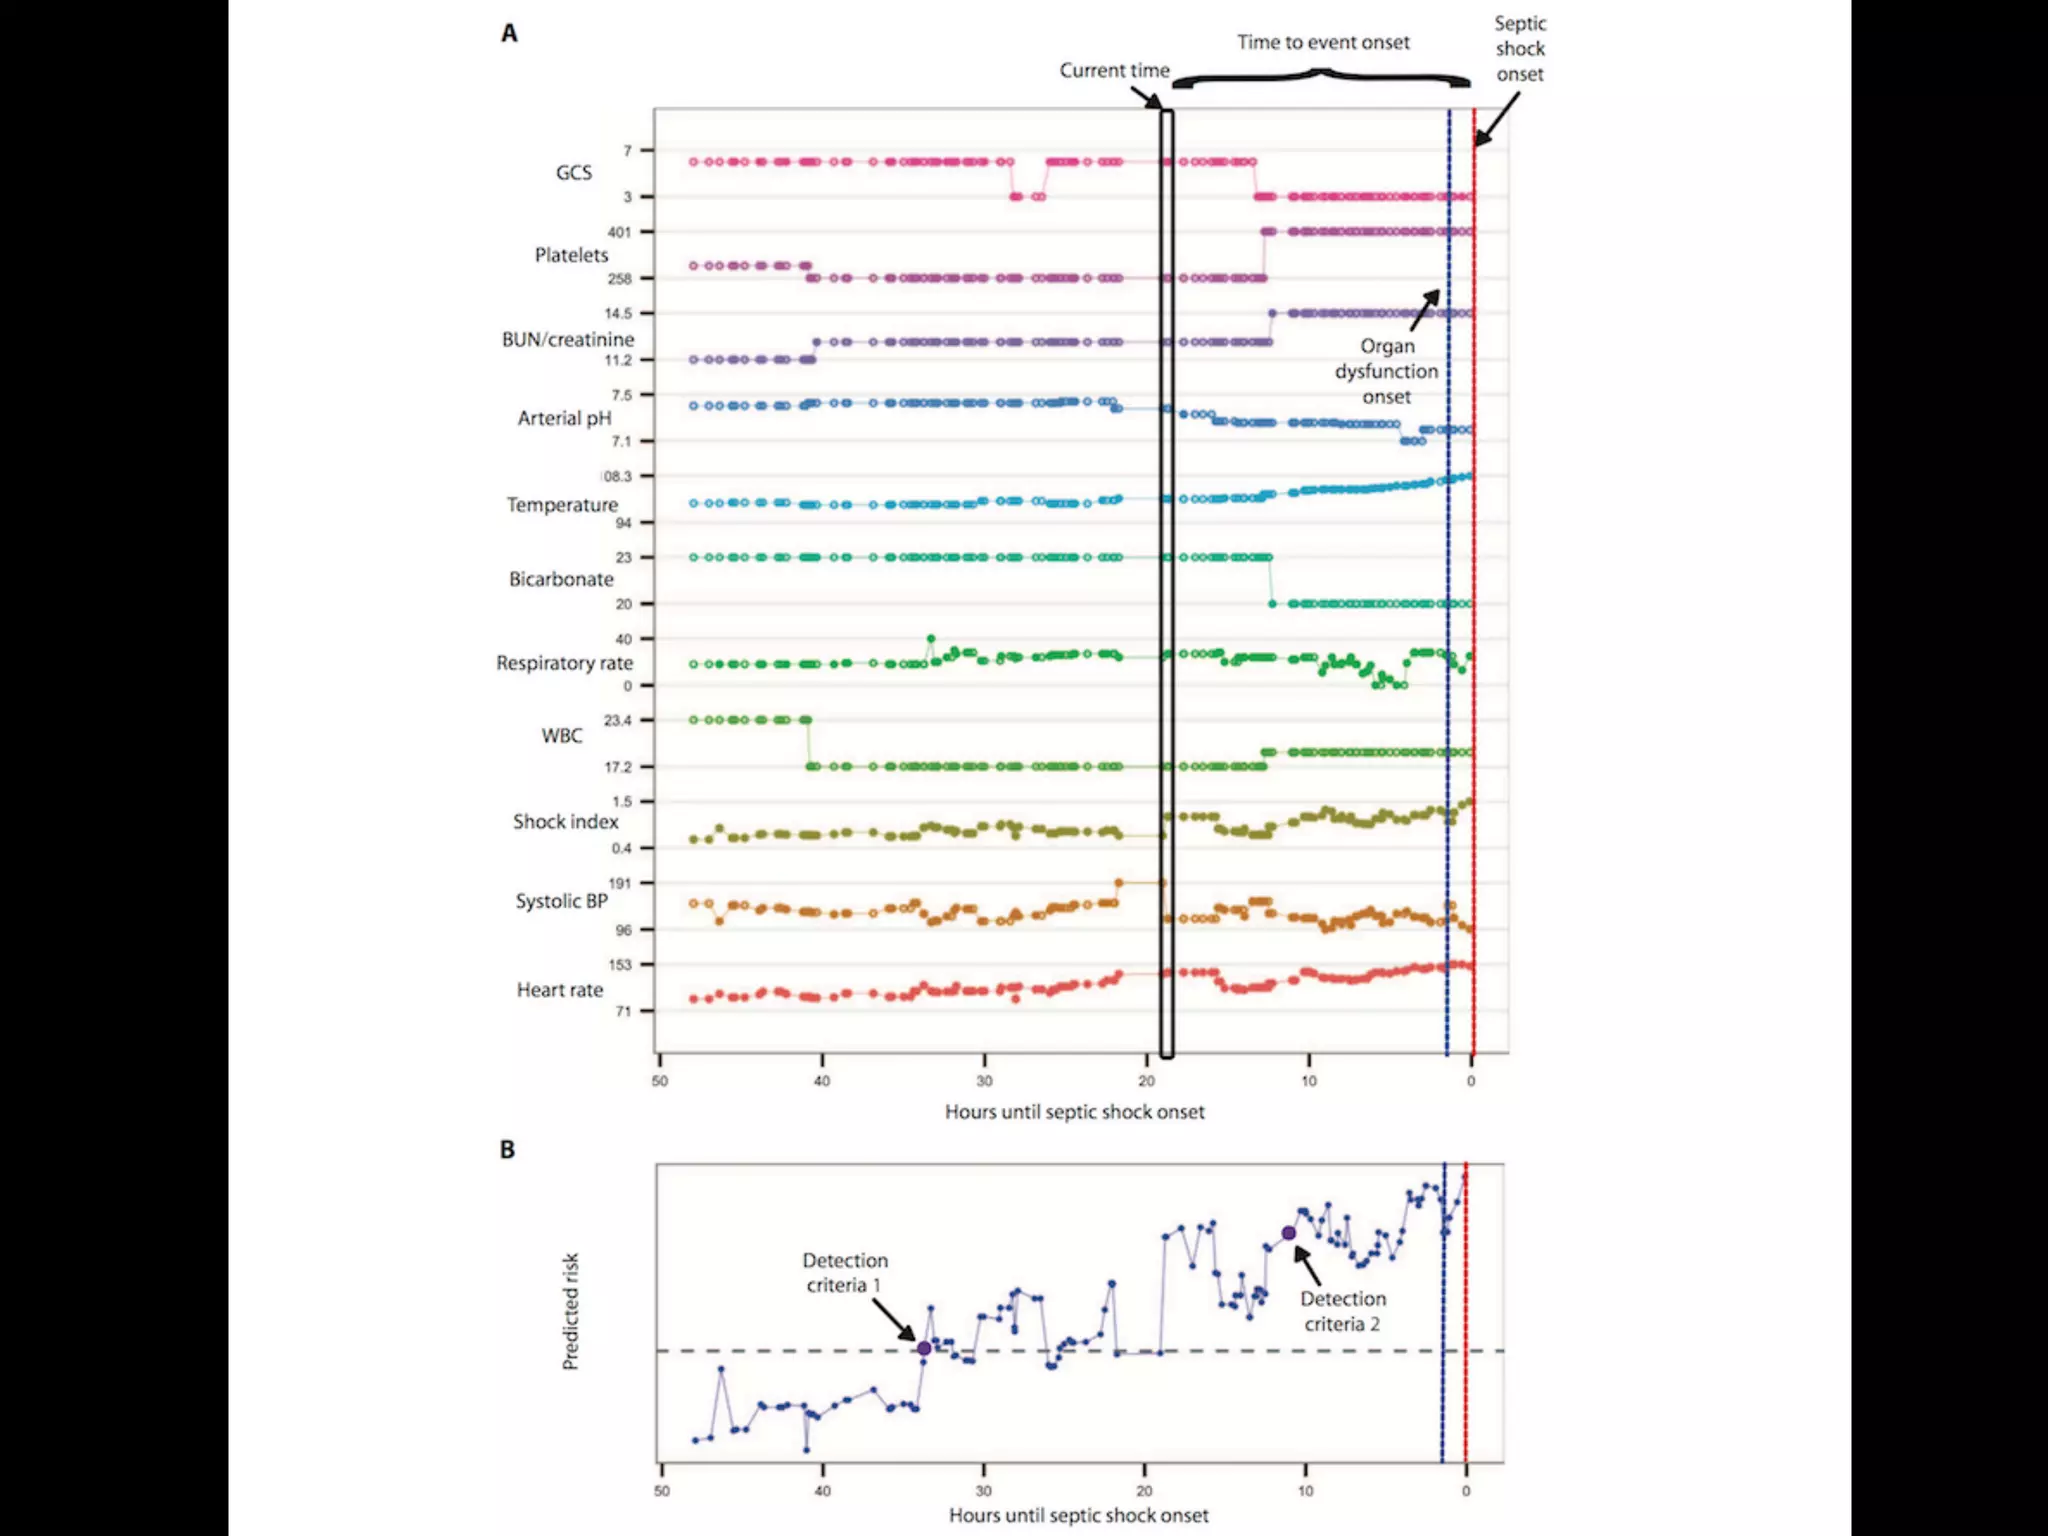
oped “TREWScore,” a targeted real-time early warning score that predicts which patients will develop septic shock.
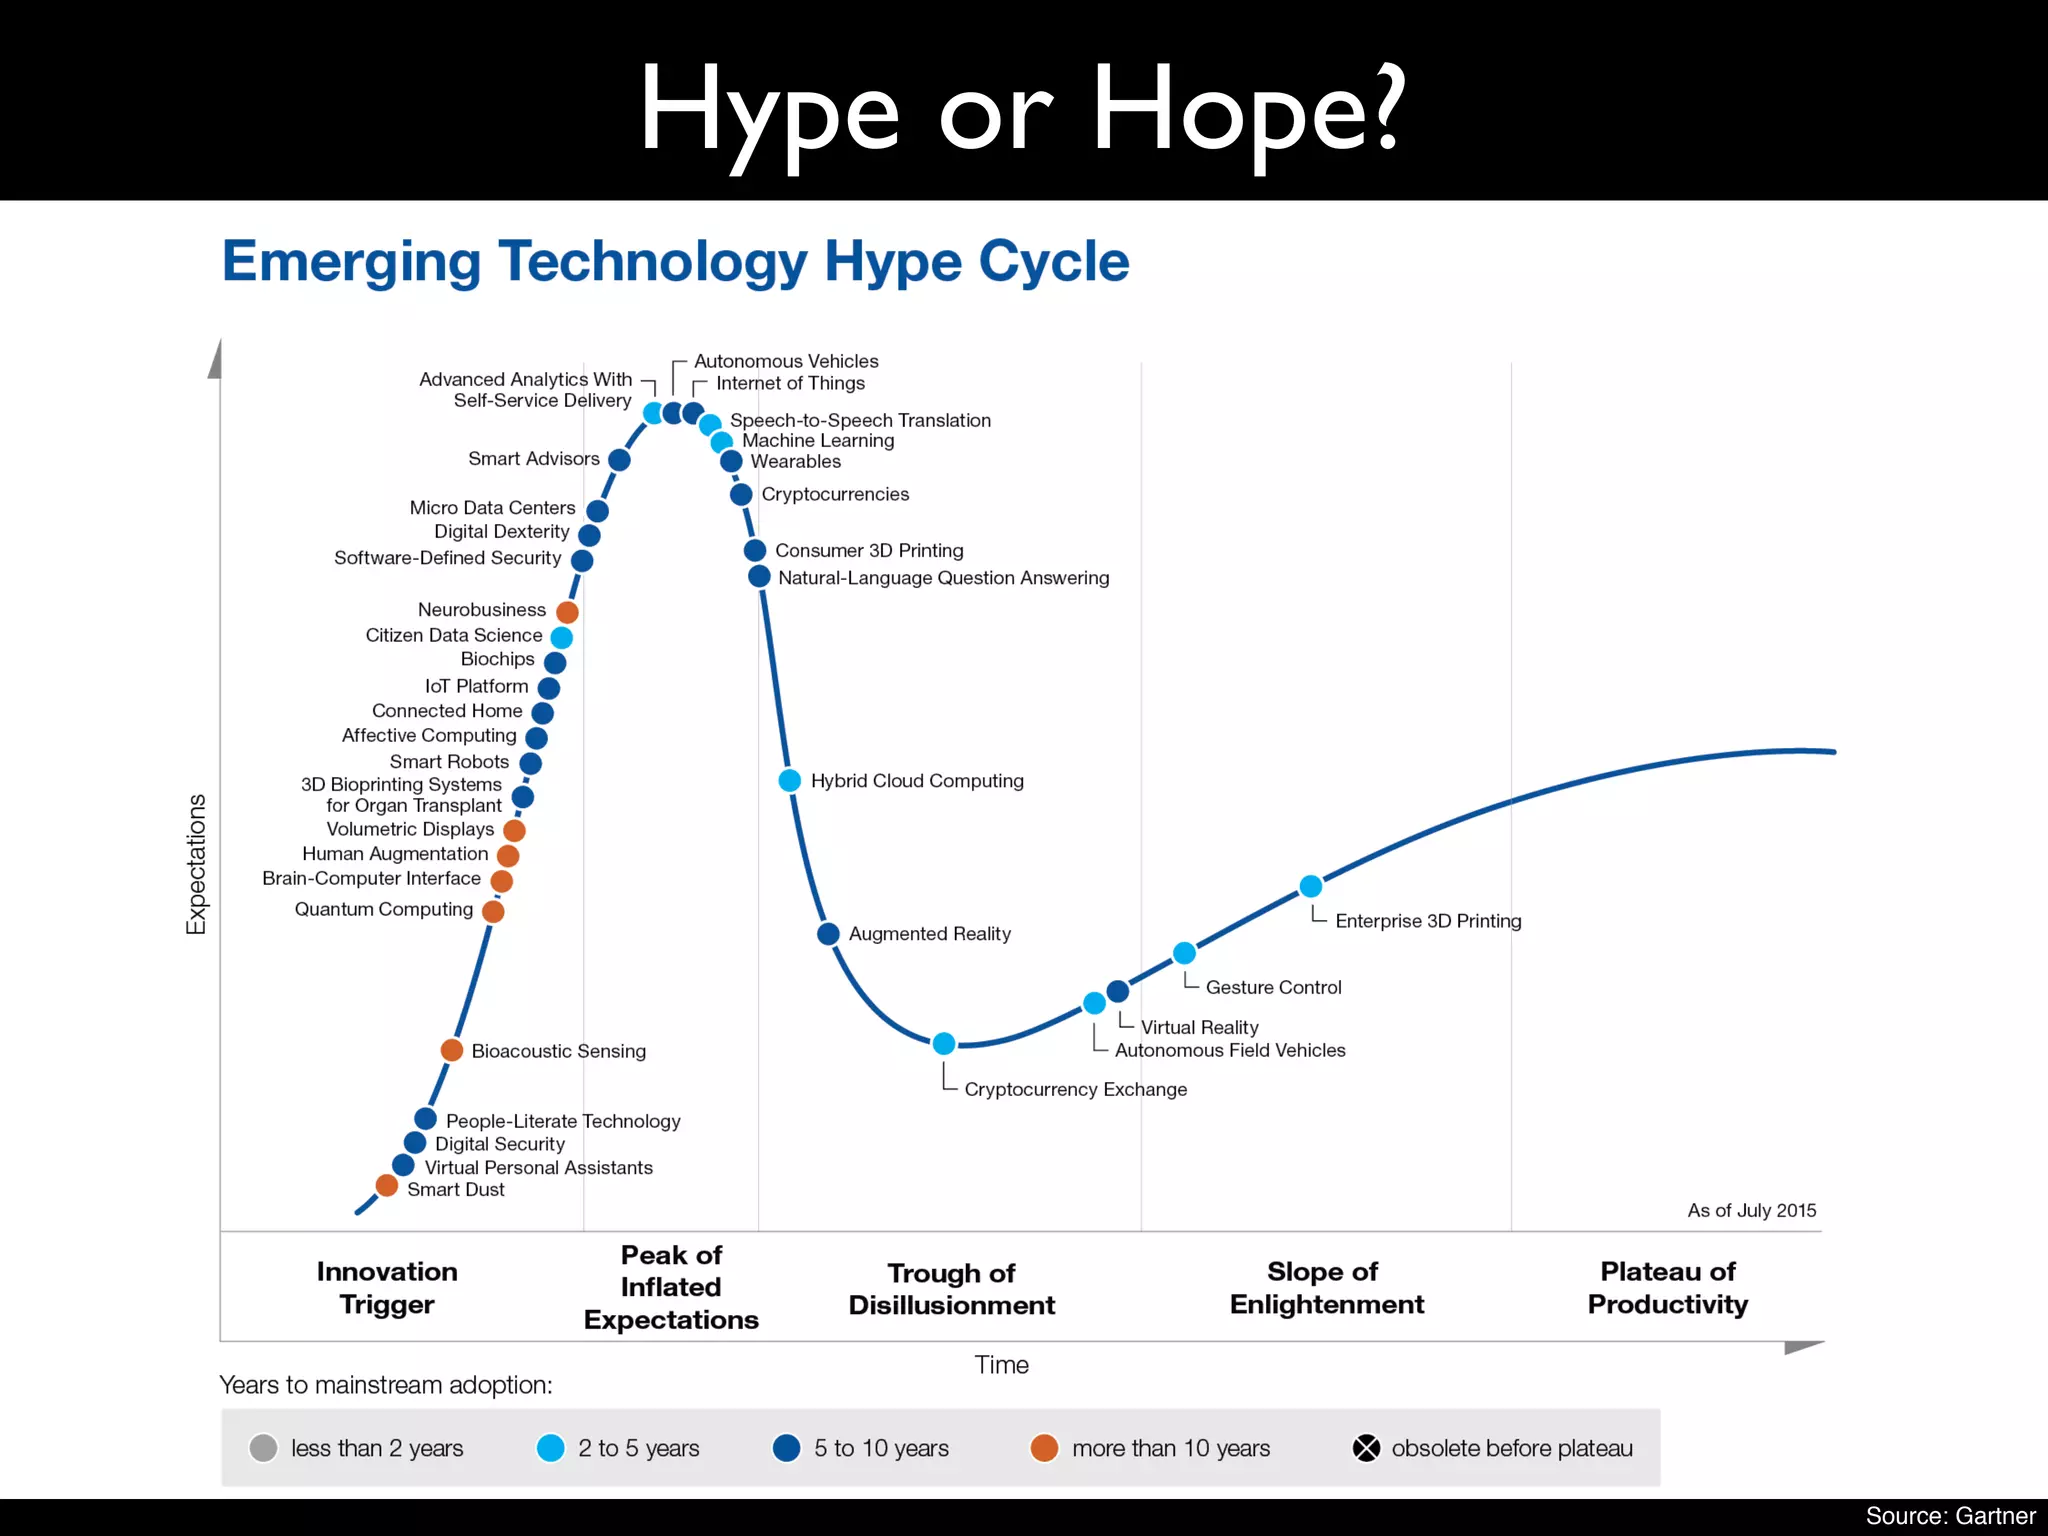
TREWScore identified patients before the onset of septic shock with an area under the ROC (receiver operating
characteristic) curve (AUC) of 0.83 [95% confidence interval (CI), 0.81 to 0.85]. At a specificity of 0.67, TREWScore
achieved a sensitivity of 0.85 and identified patients a median of 28.2 [interquartile range (IQR), 10.6 to 94.2] hours
before onset. Of those identified, two-thirds were identified before any sepsis-related organ dysfunction. In compar-
ison, the Modified Early Warning Score, which has been used clinically for septic shock prediction, achieved a lower
AUC of 0.73 (95% CI, 0.71 to 0.76). A routine screening protocol based on the presence of two of the systemic inflam-
matory response syndrome criteria, suspicion of infection, and either hypotension or hyperlactatemia achieved a low-
er sensitivity of 0.74 at a comparable specificity of 0.64. Continuous sampling of data from the electronic health
records and calculation of TREWScore may allow clinicians to identify patients at risk for septic shock and provide
earlier interventions that would prevent or mitigate the associated morbidity and mortality.
INTRODUCTION
Seven hundred fifty thousand patients develop severe sepsis and septic
shock in the United States each year. More than half of them are
admitted to an intensive care unit (ICU), accounting for 10% of all
ICU admissions, 20 to 30% of hospital deaths, and $15.4 billion in an-
nual health care costs (1–3). Several studies have demonstrated that
morbidity, mortality, and length of stay are decreased when severe sep-
sis and septic shock are identified and treated early (4–8). In particular,
one study showed that mortality from septic shock increased by 7.6%
with every hour that treatment was delayed after the onset of hypo-
tension (9).
More recent studies comparing protocolized care, usual care, and
early goal-directed therapy (EGDT) for patients with septic shock sug-
gest that usual care is as effective as EGDT (10–12). Some have inter-
preted this to mean that usual care has improved over time and reflects
important aspects of EGDT, such as early antibiotics and early ag-
gressive fluid resuscitation (13). It is likely that continued early identi-
fication and treatment will further improve outcomes. However, the
Acute Physiology Score (SAPS II), SequentialOrgan Failure Assessment
(SOFA) scores, Modified Early Warning Score (MEWS), and Simple
Clinical Score (SCS) have been validated to assess illness severity and
risk of death among septic patients (14–17). Although these scores
are useful for predicting general deterioration or mortality, they typical-
ly cannot distinguish with high sensitivity and specificity which patients
are at highest risk of developing a specific acute condition.
The increased use of electronic health records (EHRs), which can be
queried in real time, has generated interest in automating tools that
identify patients at risk for septic shock (18–20). A number of “early
warning systems,” “track and trigger” initiatives, “listening applica-
tions,” and “sniffers” have been implemented to improve detection
andtimelinessof therapy forpatients with severe sepsis andseptic shock
(18, 20–23). Although these tools have been successful at detecting pa-
tients currently experiencing severe sepsis or septic shock, none predict
which patients are at highest risk of developing septic shock.
The adoption of the Affordable Care Act has added to the growing
excitement around predictive models derived from electronic health
R E S E A R C H A R T I C L E
onNovember3,2016http://stm.sciencemag.org/Downloadedfrom](https://image.slidesharecdn.com/digitalhealth-190427130553/75/slide-228-2048.jpg)
![puted as new data became avail
when his or her score crossed t
dation set, the AUC obtained f
0.81 to 0.85) (Fig. 2). At a spec
of 0.33], TREWScore achieved a s
a median of 28.2 hours (IQR, 10
Identification of patients b
A critical event in the developme
related organ dysfunction (seve
been shown to increase after th
more than two-thirds (68.8%) o
were identified before any sepsi
tients were identified a median
(Fig. 3B).
Comparison of TREWScore
Weevaluatedtheperformanceof
methods for the purpose of provid
use of TREWScore. We first com
to MEWS, a general metric used
of catastrophic deterioration (17
oped for tracking sepsis, MEWS
tion of patients at risk for severe
Fig. 2. ROC for detection of septic shock before onset in the validation
set. The ROC curve for TREWScore is shown in blue, with the ROC curve for
MEWS in red. The sensitivity and specificity performance of the routine
screening criteria is indicated by the purple dot. Normal 95% CIs are shown
for TREWScore and MEWS. TPR, true-positive rate; FPR, false-positive rate.
R E S E A R C H A R T I C L E
A targeted real-time early warning score (TREWScore)
for septic shock
AUC=0.83
At a specificity of 0.67, TREWScore achieved a sensitivity of 0.85
and identified patients a median of 28.2 hours before onset.](https://image.slidesharecdn.com/digitalhealth-190427130553/75/slide-230-2048.jpg)


![An Algorithm Based on Deep Learning for Predicting In-Hospital
Cardiac Arrest
Joon-myoung Kwon, MD;* Youngnam Lee, MS;* Yeha Lee, PhD; Seungwoo Lee, BS; Jinsik Park, MD, PhD
Background-—In-hospital cardiac arrest is a major burden to public health, which affects patient safety. Although traditional track-
and-trigger systems are used to predict cardiac arrest early, they have limitations, with low sensitivity and high false-alarm rates.
We propose a deep learning–based early warning system that shows higher performance than the existing track-and-trigger
systems.
Methods and Results-—This retrospective cohort study reviewed patients who were admitted to 2 hospitals from June 2010 to July
2017. A total of 52 131 patients were included. Specifically, a recurrent neural network was trained using data from June 2010 to
January 2017. The result was tested using the data from February to July 2017. The primary outcome was cardiac arrest, and the
secondary outcome was death without attempted resuscitation. As comparative measures, we used the area under the receiver
operating characteristic curve (AUROC), the area under the precision–recall curve (AUPRC), and the net reclassification index.
Furthermore, we evaluated sensitivity while varying the number of alarms. The deep learning–based early warning system (AUROC:
0.850; AUPRC: 0.044) significantly outperformed a modified early warning score (AUROC: 0.603; AUPRC: 0.003), a random forest
algorithm (AUROC: 0.780; AUPRC: 0.014), and logistic regression (AUROC: 0.613; AUPRC: 0.007). Furthermore, the deep learning–
based early warning system reduced the number of alarms by 82.2%, 13.5%, and 42.1% compared with the modified early warning
system, random forest, and logistic regression, respectively, at the same sensitivity.
Conclusions-—An algorithm based on deep learning had high sensitivity and a low false-alarm rate for detection of patients with
cardiac arrest in the multicenter study. (J Am Heart Assoc. 2018;7:e008678. DOI: 10.1161/JAHA.118.008678.)
Key Words: artificial intelligence • cardiac arrest • deep learning • machine learning • rapid response system • resuscitation
In-hospital cardiac arrest is a major burden to public health,
which affects patient safety.1–3
More than a half of cardiac
arrests result from respiratory failure or hypovolemic shock,
and 80% of patients with cardiac arrest show signs of
deterioration in the 8 hours before cardiac arrest.4–9
However,
209 000 in-hospital cardiac arrests occur in the United States
each year, and the survival discharge rate for patients with
cardiac arrest is <20% worldwide.10,11
Rapid response systems
(RRSs) have been introduced in many hospitals to detect
cardiac arrest using the track-and-trigger system (TTS).12,13
Two types of TTS are used in RRSs. For the single-parameter
TTS (SPTTS), cardiac arrest is predicted if any single vital sign
(eg, heart rate [HR], blood pressure) is out of the normal
range.14
The aggregated weighted TTS calculates a weighted
score for each vital sign and then finds patients with cardiac
arrest based on the sum of these scores.15
The modified early
warning score (MEWS) is one of the most widely used
approaches among all aggregated weighted TTSs (Table 1)16
;
however, traditional TTSs including MEWS have limitations, with
low sensitivity or high false-alarm rates.14,15,17
Sensitivity and
false-alarm rate interact: Increased sensitivity creates higher
false-alarm rates and vice versa.
Current RRSs suffer from low sensitivity or a high false-
alarm rate. An RRS was used for only 30% of patients before
unplanned intensive care unit admission and was not used for
22.8% of patients, even if they met the criteria.18,19
From the Departments of Emergency Medicine (J.-m.K.) and Cardiology (J.P.), Mediplex Sejong Hospital, Incheon, Korea; VUNO, Seoul, Korea (Youngnam L., Yeha L.,
S.L.).
*Dr Kwon and Mr Youngnam Lee contributed equally to this study.
Correspondence to: Joon-myoung Kwon, MD, Department of Emergency medicine, Mediplex Sejong Hospital, 20, Gyeyangmunhwa-ro, Gyeyang-gu, Incheon 21080,
Korea. E-mail: kwonjm@sejongh.co.kr
Received January 18, 2018; accepted May 31, 2018.
ª 2018 The Authors. Published on behalf of the American Heart Association, Inc., by Wiley. This is an open access article under the terms of the Creative Commons
Attribution-NonCommercial License, which permits use, distribution and reproduction in any medium, provided the original work is properly cited and is not used for
commercial purposes.
DOI: 10.1161/JAHA.118.008678 Journal of the American Heart Association 1
ORIGINAL RESEARCH
byguestonJune28,2018http://jaha.ahajournals.org/Downloadedfrom](https://image.slidesharecdn.com/digitalhealth-190427130553/75/slide-237-2048.jpg)


The document summarizes the future of healthcare and digital healthcare. It introduces Professor Yoon Sup Choi, the director of the Digital Healthcare Institute at Sungkyunkwan University. It discusses how artificial intelligence is reshaping the conservative medical system and how quickly AI is developing and influencing healthcare. The convergence of information technology, biotechnology, and medicine is creating innovation that will transform medical education and clinical practice.
![[365mc] 디지털 헬스케어: 의료의 미래](https://cdn.slidesharecdn.com/ss_thumbnails/365mc-200317140059-thumbnail.jpg?width=640&height=640&fit=bounds)


![[코세나, kosena] 생성형 AI 앱 구축 플랫폼, 디파이(dify.ai) 소개 자료와 제안 사례입니다.](https://cdn.slidesharecdn.com/ss_thumbnails/dify-250321003306-5865b3d5-thumbnail.jpg?width=640&height=640&fit=bounds)


![[Solutions Showcase] 클라우드 기반의 강력한 자금세탁방지시스템 AMLXpress](https://cdn.slidesharecdn.com/ss_thumbnails/amlxpress-210812025237-thumbnail.jpg?width=640&height=640&fit=bounds)
![[台灣人工智慧學校] 工業 4.0 與智慧製造的發展趨勢與挑戰](https://cdn.slidesharecdn.com/ss_thumbnails/20190316jyh-horngchou-190315170336-thumbnail.jpg?width=640&height=640&fit=bounds)


![[메조미디어] Media&Market Report (2022.07)](https://cdn.slidesharecdn.com/ss_thumbnails/ssmediamarketreport202207-220715061625-8a1e04c1-thumbnail.jpg?width=640&height=640&fit=bounds)


![[메조미디어] 2023 디지털 마케팅 마일스톤](https://cdn.slidesharecdn.com/ss_thumbnails/2023digitalmediamilestone-230131083213-07cd1624-thumbnail.jpg?width=640&height=640&fit=bounds)


![[KNAPS] 포스트 코로나 시대, 제약 산업과 디지털 헬스케어](https://cdn.slidesharecdn.com/ss_thumbnails/knaps-210128022335-thumbnail.jpg?width=640&height=640&fit=bounds)


![[C&C] 의료의 미래 디지털 헬스케어](https://cdn.slidesharecdn.com/ss_thumbnails/cc-200616080105-thumbnail.jpg?width=640&height=640&fit=bounds)


![[ASGO 2019] Artificial Intelligence in Medicine](https://cdn.slidesharecdn.com/ss_thumbnails/asgo2019medicalai191010-191010155811-thumbnail.jpg?width=640&height=640&fit=bounds)
![[대한병리학회] 의료 인공지능 101: 병리를 중심으로](https://cdn.slidesharecdn.com/ss_thumbnails/pathology-201106004112-thumbnail.jpg?width=640&height=640&fit=bounds)


![Apporach to lung biopsy [Auto-saved].pptx latest](https://cdn.slidesharecdn.com/ss_thumbnails/apporachtolungbiopsyauto-saved-251211225655-93258539-thumbnail.jpg?width=640&height=640&fit=bounds)
