


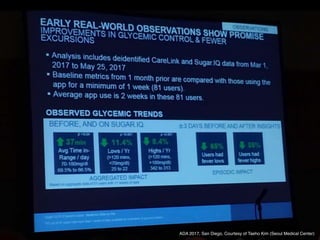
![ORIGINAL ARTICLE
Watson for Oncology and breast cancer treatment
recommendations: agreement with an expert
multidisciplinary tumor board
S. P. Somashekhar1*, M.-J. Sepu´lveda2
, S. Puglielli3
, A. D. Norden3
, E. H. Shortliffe4
, C. Rohit Kumar1
,
A. Rauthan1
, N. Arun Kumar1
, P. Patil1
, K. Rhee3
& Y. Ramya1
1
Manipal Comprehensive Cancer Centre, Manipal Hospital, Bangalore, India; 2
IBM Research (Retired), Yorktown Heights; 3
Watson Health, IBM Corporation,
Cambridge; 4
Department of Surgical Oncology, College of Health Solutions, Arizona State University, Phoenix, USA
*Correspondence to: Prof. Sampige Prasannakumar Somashekhar, Manipal Comprehensive Cancer Centre, Manipal Hospital, Old Airport Road, Bangalore 560017, Karnataka,
India. Tel: þ91-9845712012; Fax: þ91-80-2502-3759; E-mail: somashekhar.sp@manipalhospitals.com
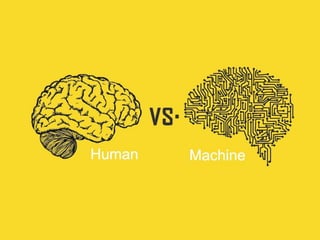
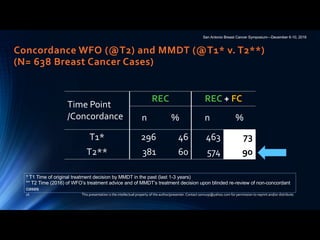
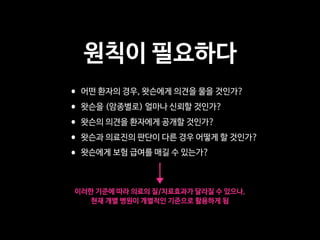
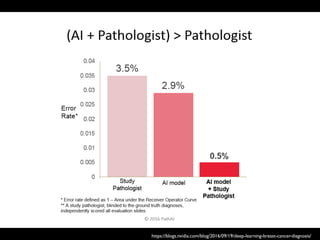
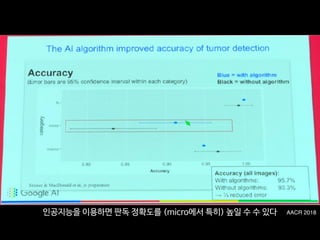
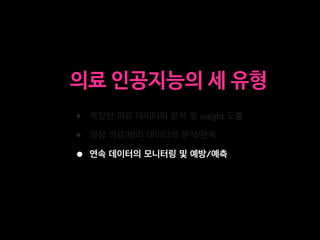
Background: Breast cancer oncologists are challenged to personalize care with rapidly changing scientific evidence, drug
approvals, and treatment guidelines. Artificial intelligence (AI) clinical decision-support systems (CDSSs) have the potential to
help address this challenge. We report here the results of examining the level of agreement (concordance) between treatment
recommendations made by the AI CDSS Watson for Oncology (WFO) and a multidisciplinary tumor board for breast cancer.
Patients and methods: Treatment recommendations were provided for 638 breast cancers between 2014 and 2016 at the
Manipal Comprehensive Cancer Center, Bengaluru, India. WFO provided treatment recommendations for the identical cases in
2016. A blinded second review was carried out by the center’s tumor board in 2016 for all cases in which there was not
agreement, to account for treatments and guidelines not available before 2016. Treatment recommendations were considered
concordant if the tumor board recommendations were designated ‘recommended’ or ‘for consideration’ by WFO.
Results: Treatment concordance between WFO and the multidisciplinary tumor board occurred in 93% of breast cancer cases.
Subgroup analysis found that patients with stage I or IV disease were less likely to be concordant than patients with stage II or III
disease. Increasing age was found to have a major impact on concordance. Concordance declined significantly (P 0.02;
P < 0.001) in all age groups compared with patients <45 years of age, except for the age group 55–64 years. Receptor status
was not found to affect concordance.
Conclusion: Treatment recommendations made by WFO and the tumor board were highly concordant for breast cancer cases
examined. Breast cancer stage and patient age had significant influence on concordance, while receptor status alone did not.
This study demonstrates that the AI clinical decision-support system WFO may be a helpful tool for breast cancer treatment
decision making, especially at centers where expert breast cancer resources are limited.
Key words: Watson for Oncology, artificial intelligence, cognitive clinical decision-support systems, breast cancer,
concordance, multidisciplinary tumor board
Introduction
Oncologists who treat breast cancer are challenged by a large and
rapidly expanding knowledge base [1, 2]. As of October 2017, for
example, there were 69 FDA-approved drugs for the treatment of
breast cancer, not including combination treatment regimens
[3]. The growth of massive genetic and clinical databases, along
with computing systems to exploit them, will accelerate the speed
of breast cancer treatment advances and shorten the cycle time
for changes to breast cancer treatment guidelines [4, 5]. In add-
ition, these information management challenges in cancer care
are occurring in a practice environment where there is little time
available for tracking and accessing relevant information at the
point of care [6]. For example, a study that surveyed 1117 oncolo-
gists reported that on average 4.6 h per week were spent keeping
VC The Author(s) 2018. Published by Oxford University Press on behalf of the European Society for Medical Oncology.
All rights reserved. For permissions, please email: journals.permissions@oup.com.
Annals of Oncology 29: 418–423, 2018
doi:10.1093/annonc/mdx781
Published online 9 January 2018
Downloaded from https://academic.oup.com/annonc/article-abstract/29/2/418/4781689
by guest](https://image.slidesharecdn.com/snuhmedicalai1810103-181010144352/85/updated-18-10-57-320.jpg)
![ORIGINAL ARTICLE
Watson for Oncology and breast cancer treatment
recommendations: agreement with an expert
multidisciplinary tumor board
S. P. Somashekhar1*, M.-J. Sepu´lveda2
, S. Puglielli3
, A. D. Norden3
, E. H. Shortliffe4
, C. Rohit Kumar1
,
A. Rauthan1
, N. Arun Kumar1
, P. Patil1
, K. Rhee3
& Y. Ramya1
1
Manipal Comprehensive Cancer Centre, Manipal Hospital, Bangalore, India; 2
IBM Research (Retired), Yorktown Heights; 3
Watson Health, IBM Corporation,
Cambridge; 4
Department of Surgical Oncology, College of Health Solutions, Arizona State University, Phoenix, USA
*Correspondence to: Prof. Sampige Prasannakumar Somashekhar, Manipal Comprehensive Cancer Centre, Manipal Hospital, Old Airport Road, Bangalore 560017, Karnataka,
India. Tel: þ91-9845712012; Fax: þ91-80-2502-3759; E-mail: somashekhar.sp@manipalhospitals.com
Background: Breast cancer oncologists are challenged to personalize care with rapidly changing scientific evidence, drug
approvals, and treatment guidelines. Artificial intelligence (AI) clinical decision-support systems (CDSSs) have the potential to
help address this challenge. We report here the results of examining the level of agreement (concordance) between treatment
recommendations made by the AI CDSS Watson for Oncology (WFO) and a multidisciplinary tumor board for breast cancer.
Patients and methods: Treatment recommendations were provided for 638 breast cancers between 2014 and 2016 at the
Manipal Comprehensive Cancer Center, Bengaluru, India. WFO provided treatment recommendations for the identical cases in
2016. A blinded second review was carried out by the center’s tumor board in 2016 for all cases in which there was not
agreement, to account for treatments and guidelines not available before 2016. Treatment recommendations were considered
concordant if the tumor board recommendations were designated ‘recommended’ or ‘for consideration’ by WFO.
Results: Treatment concordance between WFO and the multidisciplinary tumor board occurred in 93% of breast cancer cases.
Subgroup analysis found that patients with stage I or IV disease were less likely to be concordant than patients with stage II or III
disease. Increasing age was found to have a major impact on concordance. Concordance declined significantly (P 0.02;
P < 0.001) in all age groups compared with patients <45 years of age, except for the age group 55–64 years. Receptor status
was not found to affect concordance.
Conclusion: Treatment recommendations made by WFO and the tumor board were highly concordant for breast cancer cases
examined. Breast cancer stage and patient age had significant influence on concordance, while receptor status alone did not.
This study demonstrates that the AI clinical decision-support system WFO may be a helpful tool for breast cancer treatment
decision making, especially at centers where expert breast cancer resources are limited.
Key words: Watson for Oncology, artificial intelligence, cognitive clinical decision-support systems, breast cancer,
concordance, multidisciplinary tumor board
Introduction
Oncologists who treat breast cancer are challenged by a large and
rapidly expanding knowledge base [1, 2]. As of October 2017, for
example, there were 69 FDA-approved drugs for the treatment of
breast cancer, not including combination treatment regimens
[3]. The growth of massive genetic and clinical databases, along
with computing systems to exploit them, will accelerate the speed
of breast cancer treatment advances and shorten the cycle time
for changes to breast cancer treatment guidelines [4, 5]. In add-
ition, these information management challenges in cancer care
are occurring in a practice environment where there is little time
available for tracking and accessing relevant information at the
point of care [6]. For example, a study that surveyed 1117 oncolo-
gists reported that on average 4.6 h per week were spent keeping
VC The Author(s) 2018. Published by Oxford University Press on behalf of the European Society for Medical Oncology.
All rights reserved. For permissions, please email: journals.permissions@oup.com.
Annals of Oncology 29: 418–423, 2018
doi:10.1093/annonc/mdx781
Published online 9 January 2018
Downloaded from https://academic.oup.com/annonc/article-abstract/29/2/418/4781689
by guest
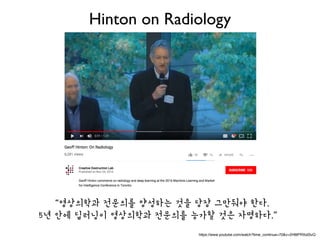
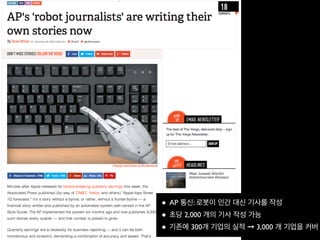
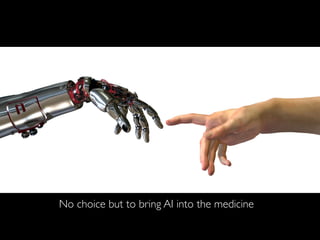
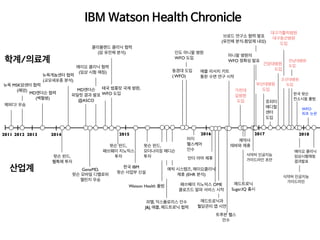
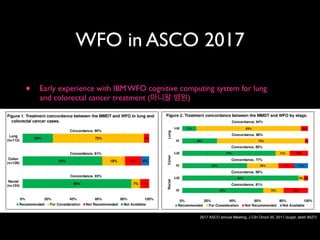
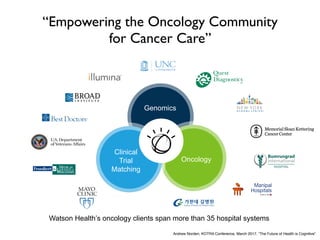
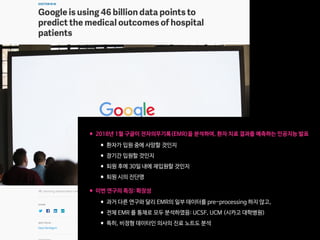
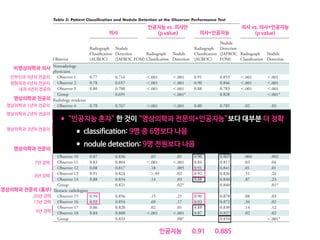
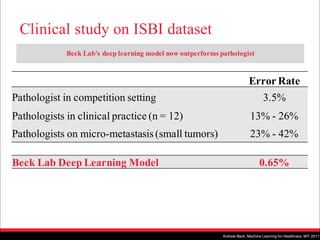
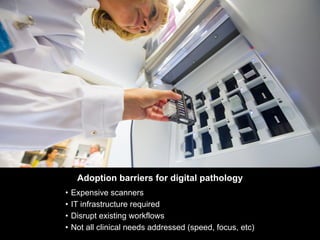
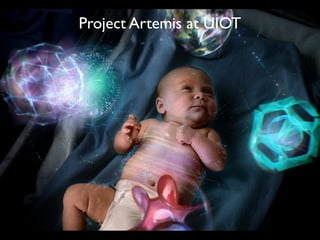
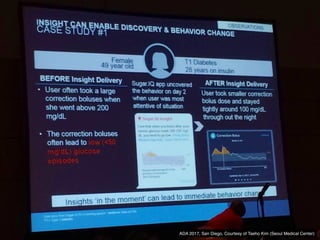
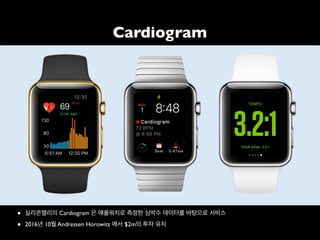
Table 2. MMDT and WFO recommendations after the initial and blinded second reviews
Review of breast cancer cases (N 5 638) Concordant cases, n (%) Non-concordant cases, n (%)
Recommended For consideration Total Not recommended Not available Total
Initial review (T1MMDT versus T2WFO) 296 (46) 167 (26) 463 (73) 137 (21) 38 (6) 175 (27)
Second review (T2MMDT versus T2WFO) 397 (62) 194 (30) 591 (93) 36 (5) 11 (2) 47 (7)
T1MMDT, original MMDT recommendation from 2014 to 2016; T2WFO, WFO advisor treatment recommendation in 2016; T2MMDT, MMDT treatment recom-
mendation in 2016; MMDT, Manipal multidisciplinary tumor board; WFO, Watson for Oncology.
31%
18%
1% 2% 33%
5% 31%
6%
0% 10% 20%
Not available Not recommended RecommendedFor consideration
30% 40% 50% 60% 70% 80% 90% 100%
8% 25% 61%
64%
64%
29% 51%
62%
Concordance, 93%
Concordance, 80%
Concordance, 97%
Concordance, 95%
Concordance, 86%
2%
2%
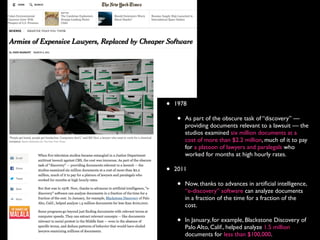
Overall
(n=638)
Stage I
(n=61)
Stage II
(n=262)
Stage III
(n=191)
Stage IV
(n=124)
5%
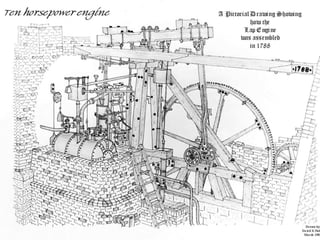
Figure 1. Treatment concordance between WFO and the MMDT overall and by stage. MMDT, Manipal multidisciplinary tumor board; WFO,
Watson for Oncology.
5%Non-metastatic
HR(+)HER2/neu(+)Triple(–)
Metastatic
Non-metastatic
Metastatic
Non-metastatic
Metastatic
10%
1%
2%
1% 5% 20%
20%10%
0%
Not applicable Not recommended For consideration Recommended
20% 40% 60% 80% 100%
5%
74%
65%
34% 64%
5% 38% 56%
15% 20% 55%
36% 59%
Concordance, 95%
Concordance, 75%
Concordance, 94%
Concordance, 98%
Concordance, 94%
Concordance, 85%
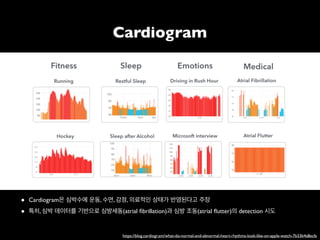
Figure 2. Treatment concordance between WFO and the MMDT by stage and receptor status. HER2/neu, human epidermal growth factor
receptor 2; HR, hormone receptor; MMDT, Manipal multidisciplinary tumor board; WFO, Watson for Oncology.
Annals of Oncology Original article](https://image.slidesharecdn.com/snuhmedicalai1810103-181010144352/85/updated-18-10-58-320.jpg)
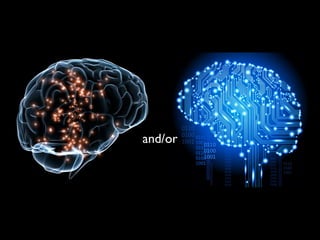
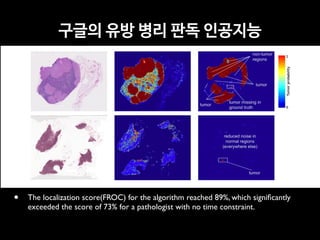
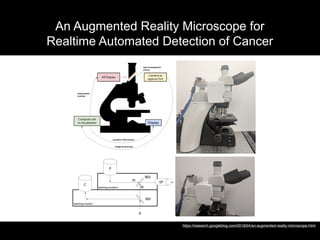
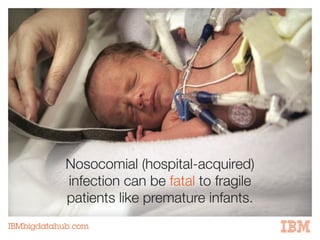
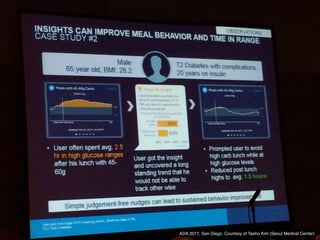
![페이스북의 딥페이스
Taigman,Y. et al. (2014). DeepFace: Closing the Gap to Human-Level Performance in FaceVerification, CVPR’14.
Figure 2. Outline of the DeepFace architecture. A front-end of a single convolution-pooling-convolution filtering on the rectified input, followed by three
locally-connected layers and two fully-connected layers. Colors illustrate feature maps produced at each layer. The net includes more than 120 million
parameters, where more than 95% come from the local and fully connected layers.
very few parameters. These layers merely expand the input
into a set of simple local features.
The subsequent layers (L4, L5 and L6) are instead lo-
cally connected [13, 16], like a convolutional layer they ap-
ply a filter bank, but every location in the feature map learns
a different set of filters. Since different regions of an aligned
image have different local statistics, the spatial stationarity
The goal of training is to maximize the probability of
the correct class (face id). We achieve this by minimiz-
ing the cross-entropy loss for each training sample. If k
is the index of the true label for a given input, the loss is:
L = log pk. The loss is minimized over the parameters
by computing the gradient of L w.r.t. the parameters and
Human: 95% vs. DeepFace in Facebook: 97.35%
Recognition Accuracy for Labeled Faces in the Wild (LFW) dataset (13,233 images, 5,749 people)](https://image.slidesharecdn.com/snuhmedicalai1810103-181010144352/85/updated-18-10-70-320.jpg)
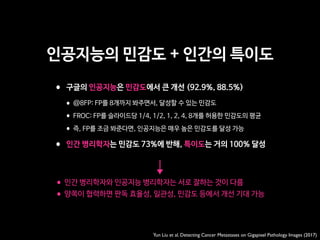
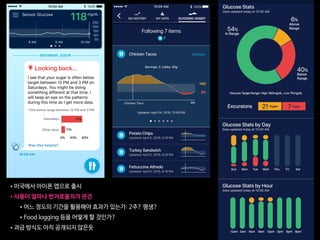
![Schroff, F. et al. (2015). FaceNet:A Unified Embedding for Face Recognition and Clustering
Human: 95% vs. FaceNet of Google: 99.63%
Recognition Accuracy for Labeled Faces in the Wild (LFW) dataset (13,233 images, 5,749 people)
False accept
False reject
s. This shows all pairs of images that were
on LFW. Only eight of the 13 errors shown
he other four are mislabeled in LFW.
on Youtube Faces DB
ge similarity of all pairs of the first one
our face detector detects in each video.
False accept
False reject
Figure 6. LFW errors. This shows all pairs of images that were
incorrectly classified on LFW. Only eight of the 13 errors shown
here are actual errors the other four are mislabeled in LFW.
5.7. Performance on Youtube Faces DB
We use the average similarity of all pairs of the first one
hundred frames that our face detector detects in each video.
This gives us a classification accuracy of 95.12%±0.39.
Using the first one thousand frames results in 95.18%.
Compared to [17] 91.4% who also evaluate one hundred
frames per video we reduce the error rate by almost half.
DeepId2+ [15] achieved 93.2% and our method reduces this
error by 30%, comparable to our improvement on LFW.
5.8. Face Clustering
Our compact embedding lends itself to be used in order
to cluster a users personal photos into groups of people with
the same identity. The constraints in assignment imposed
by clustering faces, compared to the pure verification task,
lead to truly amazing results. Figure 7 shows one cluster in
a users personal photo collection, generated using agglom-
erative clustering. It is a clear showcase of the incredible
invariance to occlusion, lighting, pose and even age.
Figure 7. Face Clustering. Shown is an exemplar cluster for one
user. All these images in the users personal photo collection were
clustered together.
6. Summary
We provide a method to directly learn an embedding into
an Euclidean space for face verification. This sets it apart
from other methods [15, 17] who use the CNN bottleneck
layer, or require additional post-processing such as concate-
nation of multiple models and PCA, as well as SVM clas-
sification. Our end-to-end training both simplifies the setup
and shows that directly optimizing a loss relevant to the task
at hand improves performance.
Another strength of our model is that it only requires
False accept
False reject
Figure 6. LFW errors. This shows all pairs of images that were
incorrectly classified on LFW. Only eight of the 13 errors shown
here are actual errors the other four are mislabeled in LFW.
5.7. Performance on Youtube Faces DB
We use the average similarity of all pairs of the first one
hundred frames that our face detector detects in each video.
This gives us a classification accuracy of 95.12%±0.39.
Using the first one thousand frames results in 95.18%.
Compared to [17] 91.4% who also evaluate one hundred
frames per video we reduce the error rate by almost half.
DeepId2+ [15] achieved 93.2% and our method reduces this
error by 30%, comparable to our improvement on LFW.
5.8. Face Clustering
Our compact embedding lends itself to be used in order
to cluster a users personal photos into groups of people with
the same identity. The constraints in assignment imposed
by clustering faces, compared to the pure verification task,
Figure 7. Face Clustering. Shown is an exemplar cluster for one
user. All these images in the users personal photo collection were
clustered together.
6. Summary
We provide a method to directly learn an embedding into
an Euclidean space for face verification. This sets it apart
from other methods [15, 17] who use the CNN bottleneck
layer, or require additional post-processing such as concate-
nation of multiple models and PCA, as well as SVM clas-
구글의 페이스넷](https://image.slidesharecdn.com/snuhmedicalai1810103-181010144352/85/updated-18-10-71-320.jpg)
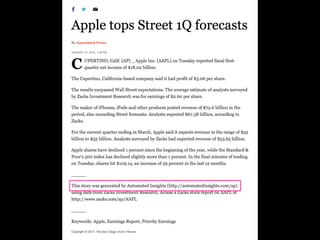
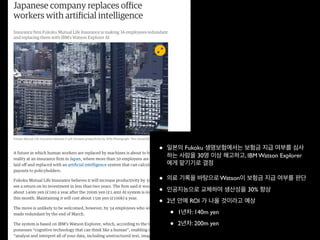
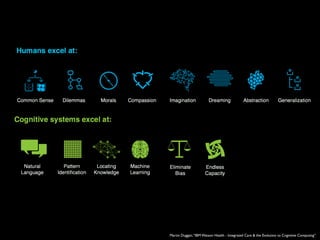
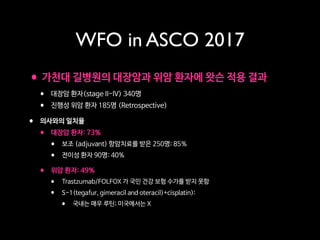
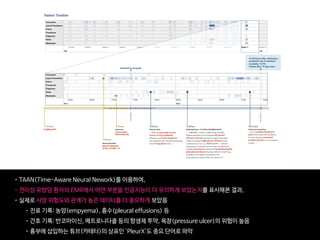
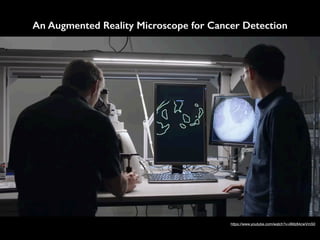
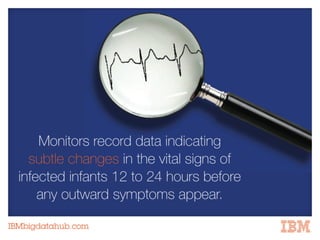
![바이두의 얼굴 인식 인공지능
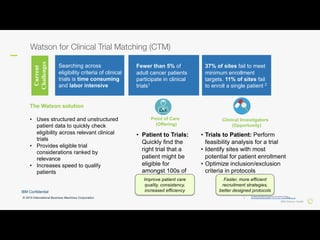
Jingtuo Liu (2015) Targeting Ultimate Accuracy: Face Recognition via Deep Embedding
Human: 95% vs.Baidu: 99.77%
Recognition Accuracy for Labeled Faces in the Wild (LFW) dataset (13,233 images, 5,749 people)
3
Although several algorithms have achieved nearly perfect
accuracy in the 6000-pair verification task, a more practical
can achieve 95.8% identification rate, relatively reducing the
error rate by about 77%.
TABLE 3. COMPARISONS WITH OTHER METHODS ON SEVERAL EVALUATION TASKS
Score = -0.060 (pair #113) Score = -0.022 (pair #202) Score = -0.034 (pair #656)
Score = -0.031 (pair #1230) Score = -0.073 (pair #1862) Score = -0.091(pair #2499)
Score = -0.024 (pair #2551) Score = -0.036 (pair #2552) Score = -0.089 (pair #2610)
Method
Performance on tasks
Pair-wise
Accuracy(%)
Rank-1(%)
DIR(%) @
FAR =1%
Verification(%
)@ FAR=0.1%
Open-set
Identification(%
)@ Rank =
1,FAR = 0.1%
IDL Ensemble
Model
99.77 98.03 95.8 99.41 92.09
IDL Single Model 99.68 97.60 94.12 99.11 89.08
FaceNet[12] 99.63 NA NA NA NA
DeepID3[9] 99.53 96.00 81.40 NA NA
Face++[2] 99.50 NA NA NA NA
Facebook[15] 98.37 82.5 61.9 NA NA
Learning from
Scratch[4]
97.73 NA NA 80.26 28.90
HighDimLBP[10] 95.17 NA NA
41.66(reported
in [4])
18.07(reported
in [4])
• 6,000쌍의 얼굴 사진 중에 바이두의 인공지능은 불과 14쌍만을 잘못 판단
• 알고 보니 이 14쌍 중의 5쌍의 사진은 오히려 정답에 오류가 있었고,
실제로는 인공지능이 정확 (red box)](https://image.slidesharecdn.com/snuhmedicalai1810103-181010144352/85/updated-18-10-72-320.jpg)

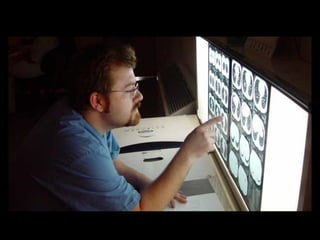
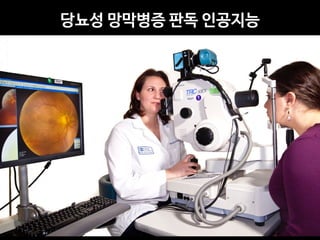
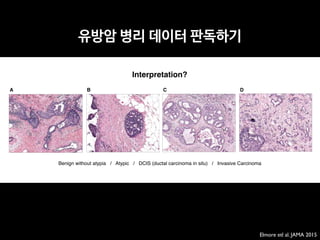
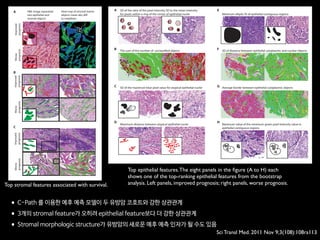
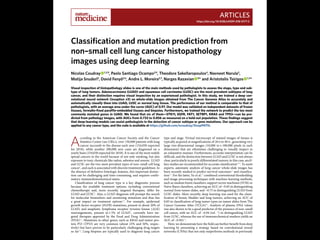
![AJR:209, December 2017 1
Since 1992, concerns regarding interob-
server variability in manual bone age esti-
mation [4] have led to the establishment of
several automatic computerized methods for
bone age estimation, including computer-as-
sisted skeletal age scores, computer-aided
skeletal maturation assessment systems, and
BoneXpert (Visiana) [5–14]. BoneXpert was
developed according to traditional machine-
learning techniques and has been shown to
have a good performance for patients of var-
ious ethnicities and in various clinical set-
tings [10–14]. The deep-learning technique
is an improvement in artificial neural net-
works. Unlike traditional machine-learning
techniques, deep-learning techniques allow
an algorithm to program itself by learning
from the images given a large dataset of la-
beled examples, thus removing the need to
specify rules [15].
Deep-learning techniques permit higher
levels of abstraction and improved predic-
tions from data. Deep-learning techniques
Computerized Bone Age
Estimation Using Deep Learning–
Based Program: Evaluation of the
Accuracy and Efficiency
Jeong Rye Kim1
Woo Hyun Shim1
Hee Mang Yoon1
Sang Hyup Hong1
Jin Seong Lee1
Young Ah Cho1
Sangki Kim2
Kim JR, Shim WH, Yoon MH, et al.
1
Department of Radiology and Research Institute of
Radiology, Asan Medical Center, University of Ulsan
College of Medicine, 88 Olympic-ro 43-gil, Songpa-gu,
Seoul 05505, South Korea. Address correspondence to
H. M. Yoon (espoirhm@gmail.com).
2
Vuno Research Center, Vuno Inc., Seoul, South Korea.
Pediatric Imaging • Original Research
Supplemental Data
Available online at www.ajronline.org.
AJR 2017; 209:1–7
0361–803X/17/2096–1
© American Roentgen Ray Society
B
one age estimation is crucial for
developmental status determina-
tions and ultimate height predic-
tions in the pediatric population,
particularly for patients with growth disor-
ders and endocrine abnormalities [1]. Two
major left-hand wrist radiograph-based
methods for bone age estimation are current-
ly used: the Greulich-Pyle [2] and Tanner-
Whitehouse [3] methods. The former is much
more frequently used in clinical practice.
Greulich-Pyle–based bone age estimation is
performed by comparing a patient’s left-hand
radiograph to standard radiographs in the
Greulich-Pyle atlas and is therefore simple
and easily applied in clinical practice. How-
ever, the process of bone age estimation,
which comprises a simple comparison of
multiple images, can be repetitive and time
consuming and is thus sometimes burden-
some to radiologists. Moreover, the accuracy
depends on the radiologist’s experience and
tends to be subjective.
Keywords: bone age, children, deep learning, neural
network model
DOI:10.2214/AJR.17.18224
J. R. Kim and W. H. Shim contributed equally to this work.
Received March 12, 2017; accepted after revision
July 7, 2017.
S. Kim is employed by Vuno, Inc., which created the deep
learning–based automatic software system for bone
age determination. J. R. Kim, W. H. Shim, H. M. Yoon,
S. H. Hong, J. S. Lee, and Y. A. Cho are employed by
Asan Medical Center, which holds patent rights for the
deep learning–based automatic software system for
bone age assessment.
OBJECTIVE. The purpose of this study is to evaluate the accuracy and efficiency of a
new automatic software system for bone age assessment and to validate its feasibility in clini-
cal practice.
MATERIALS AND METHODS. A Greulich-Pyle method–based deep-learning tech-
nique was used to develop the automatic software system for bone age determination. Using
this software, bone age was estimated from left-hand radiographs of 200 patients (3–17 years
old) using first-rank bone age (software only), computer-assisted bone age (two radiologists
with software assistance), and Greulich-Pyle atlas–assisted bone age (two radiologists with
Greulich-Pyle atlas assistance only). The reference bone age was determined by the consen-
sus of two experienced radiologists.
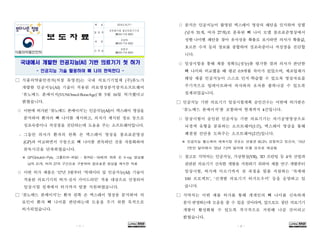
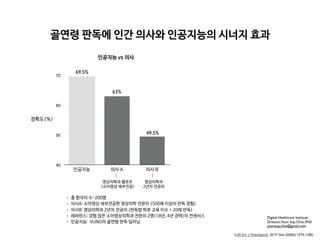
RESULTS. First-rank bone ages determined by the automatic software system showed a
69.5% concordance rate and significant correlations with the reference bone age (r = 0.992;
p < 0.001). Concordance rates increased with the use of the automatic software system for
both reviewer 1 (63.0% for Greulich-Pyle atlas–assisted bone age vs 72.5% for computer-as-
sisted bone age) and reviewer 2 (49.5% for Greulich-Pyle atlas–assisted bone age vs 57.5% for
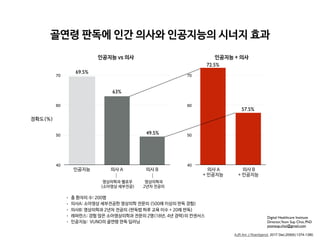
computer-assisted bone age). Reading times were reduced by 18.0% and 40.0% for reviewers
1 and 2, respectively.
CONCLUSION. Automatic software system showed reliably accurate bone age estima-
tions and appeared to enhance efficiency by reducing reading times without compromising
the diagnostic accuracy.
Kim et al.
Accuracy and Efficiency of Computerized Bone Age Estimation
Pediatric Imaging
Original Research
Downloadedfromwww.ajronline.orgbyFloridaAtlanticUnivon09/13/17fromIPaddress131.91.169.193.CopyrightARRS.Forpersonaluseonly;allrightsreserved
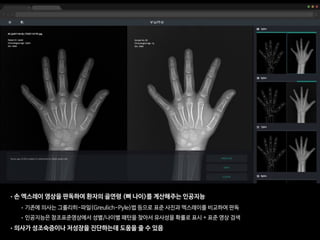
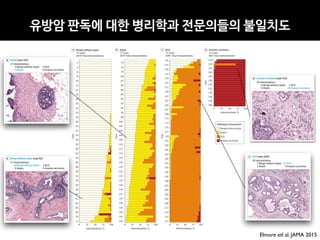
• 총 환자의 수: 200명
• 레퍼런스: 경험 많은 소아영상의학과 전문의 2명(18년, 4년 경력)의 컨센서스
• 의사A: 소아영상 세부전공한 영상의학 전문의 (500례 이상의 판독 경험)
• 의사B: 영상의학과 2년차 전공의 (판독법 하루 교육 이수 + 20례 판독)
• 인공지능: VUNO의 골연령 판독 딥러닝
AJR Am J Roentgenol. 2017 Dec;209(6):1374-1380.](https://image.slidesharecdn.com/snuhmedicalai1810103-181010144352/85/updated-18-10-77-320.jpg)
![This copy is for personal use only.
To order printed copies, contact reprints@rsna.org
This copy is for personal use only.
To order printed copies, contact reprints@rsna.org
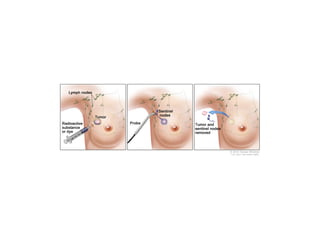
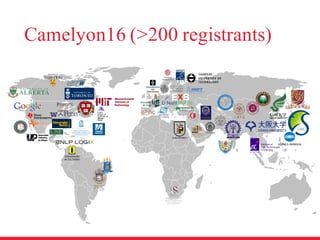
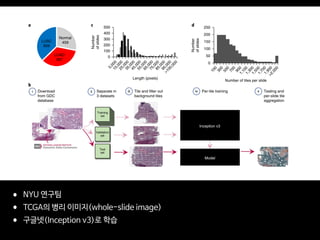
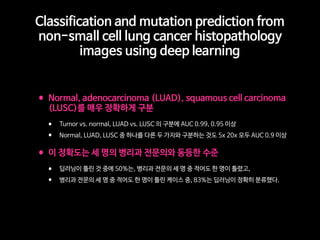
ORIGINAL RESEARCH • THORACIC IMAGING
hest radiography, one of the most common diagnos- intraobserver agreements because of its limited spatial reso-
Development and Validation of Deep
Learning–based Automatic Detection
Algorithm for Malignant Pulmonary Nodules
on Chest Radiographs
Ju Gang Nam, MD* • Sunggyun Park, PhD* • Eui Jin Hwang, MD • Jong Hyuk Lee, MD • Kwang-Nam Jin, MD,
PhD • KunYoung Lim, MD, PhD • Thienkai HuyVu, MD, PhD • Jae Ho Sohn, MD • Sangheum Hwang, PhD • Jin
Mo Goo, MD, PhD • Chang Min Park, MD, PhD
From the Department of Radiology and Institute of Radiation Medicine, Seoul National University Hospital and College of Medicine, 101 Daehak-ro, Jongno-gu, Seoul
03080, Republic of Korea (J.G.N., E.J.H., J.M.G., C.M.P.); Lunit Incorporated, Seoul, Republic of Korea (S.P.); Department of Radiology, Armed Forces Seoul Hospital,
Seoul, Republic of Korea (J.H.L.); Department of Radiology, Seoul National University Boramae Medical Center, Seoul, Republic of Korea (K.N.J.); Department of
Radiology, National Cancer Center, Goyang, Republic of Korea (K.Y.L.); Department of Radiology and Biomedical Imaging, University of California, San Francisco,
San Francisco, Calif (T.H.V., J.H.S.); and Department of Industrial & Information Systems Engineering, Seoul National University of Science and Technology, Seoul,
Republic of Korea (S.H.). Received January 30, 2018; revision requested March 20; revision received July 29; accepted August 6. Address correspondence to C.M.P.
(e-mail: cmpark.morphius@gmail.com).
Study supported by SNUH Research Fund and Lunit (06–2016–3000) and by Seoul Research and Business Development Program (FI170002).
*J.G.N. and S.P. contributed equally to this work.
Conflicts of interest are listed at the end of this article.
Radiology 2018; 00:1–11 • https://doi.org/10.1148/radiol.2018180237 • Content codes:
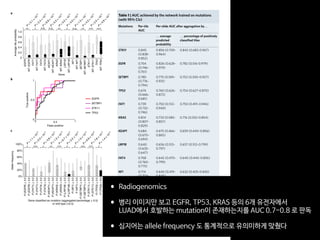
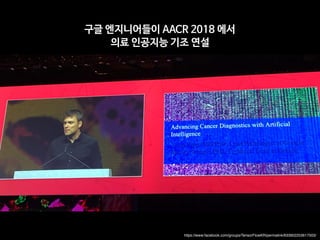
Purpose: To develop and validate a deep learning–based automatic detection algorithm (DLAD) for malignant pulmonary nodules
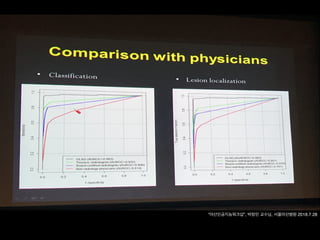
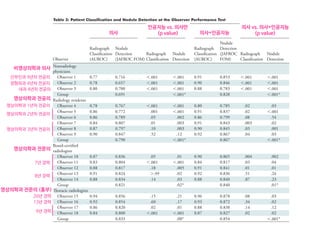
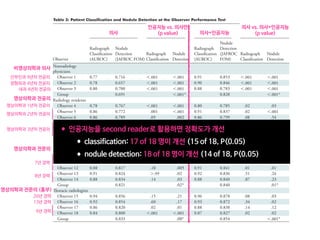
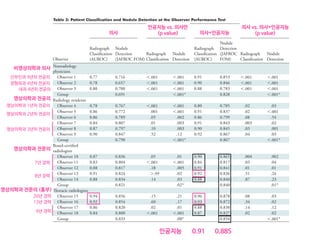
on chest radiographs and to compare its performance with physicians including thoracic radiologists.
Materials and Methods: For this retrospective study, DLAD was developed by using 43292 chest radiographs (normal radiograph–
to–nodule radiograph ratio, 34067:9225) in 34676 patients (healthy-to-nodule ratio, 30784:3892; 19230 men [mean age, 52.8
years; age range, 18–99 years]; 15446 women [mean age, 52.3 years; age range, 18–98 years]) obtained between 2010 and 2015,
which were labeled and partially annotated by 13 board-certified radiologists, in a convolutional neural network. Radiograph clas-
sification and nodule detection performances of DLAD were validated by using one internal and four external data sets from three
South Korean hospitals and one U.S. hospital. For internal and external validation, radiograph classification and nodule detection
performances of DLAD were evaluated by using the area under the receiver operating characteristic curve (AUROC) and jackknife
alternative free-response receiver-operating characteristic (JAFROC) figure of merit (FOM), respectively. An observer performance
test involving 18 physicians, including nine board-certified radiologists, was conducted by using one of the four external validation
data sets. Performances of DLAD, physicians, and physicians assisted with DLAD were evaluated and compared.
Results: According to one internal and four external validation data sets, radiograph classification and nodule detection perfor-
mances of DLAD were a range of 0.92–0.99 (AUROC) and 0.831–0.924 (JAFROC FOM), respectively. DLAD showed a higher
AUROC and JAFROC FOM at the observer performance test than 17 of 18 and 15 of 18 physicians, respectively (P , .05), and
all physicians showed improved nodule detection performances with DLAD (mean JAFROC FOM improvement, 0.043; range,
0.006–0.190; P , .05).
Conclusion: This deep learning–based automatic detection algorithm outperformed physicians in radiograph classification and nod-
ule detection performance for malignant pulmonary nodules on chest radiographs, and it enhanced physicians’ performances when
used as a second reader.
©RSNA, 2018
Online supplemental material is available for this article.](https://image.slidesharecdn.com/snuhmedicalai1810103-181010144352/85/updated-18-10-81-320.jpg)
![This copy is for personal use only.
To order printed copies, contact reprints@rsna.org
This copy is for personal use only.
To order printed copies, contact reprints@rsna.org
ORIGINAL RESEARCH • THORACIC IMAGING
hest radiography, one of the most common diagnos- intraobserver agreements because of its limited spatial reso-
Development and Validation of Deep
Learning–based Automatic Detection
Algorithm for Malignant Pulmonary Nodules
on Chest Radiographs
Ju Gang Nam, MD* • Sunggyun Park, PhD* • Eui Jin Hwang, MD • Jong Hyuk Lee, MD • Kwang-Nam Jin, MD,
PhD • KunYoung Lim, MD, PhD • Thienkai HuyVu, MD, PhD • Jae Ho Sohn, MD • Sangheum Hwang, PhD • Jin
Mo Goo, MD, PhD • Chang Min Park, MD, PhD
From the Department of Radiology and Institute of Radiation Medicine, Seoul National University Hospital and College of Medicine, 101 Daehak-ro, Jongno-gu, Seoul
03080, Republic of Korea (J.G.N., E.J.H., J.M.G., C.M.P.); Lunit Incorporated, Seoul, Republic of Korea (S.P.); Department of Radiology, Armed Forces Seoul Hospital,
Seoul, Republic of Korea (J.H.L.); Department of Radiology, Seoul National University Boramae Medical Center, Seoul, Republic of Korea (K.N.J.); Department of
Radiology, National Cancer Center, Goyang, Republic of Korea (K.Y.L.); Department of Radiology and Biomedical Imaging, University of California, San Francisco,
San Francisco, Calif (T.H.V., J.H.S.); and Department of Industrial & Information Systems Engineering, Seoul National University of Science and Technology, Seoul,
Republic of Korea (S.H.). Received January 30, 2018; revision requested March 20; revision received July 29; accepted August 6. Address correspondence to C.M.P.
(e-mail: cmpark.morphius@gmail.com).
Study supported by SNUH Research Fund and Lunit (06–2016–3000) and by Seoul Research and Business Development Program (FI170002).
*J.G.N. and S.P. contributed equally to this work.
Conflicts of interest are listed at the end of this article.
Radiology 2018; 00:1–11 • https://doi.org/10.1148/radiol.2018180237 • Content codes:
Purpose: To develop and validate a deep learning–based automatic detection algorithm (DLAD) for malignant pulmonary nodules
on chest radiographs and to compare its performance with physicians including thoracic radiologists.
Materials and Methods: For this retrospective study, DLAD was developed by using 43292 chest radiographs (normal radiograph–
to–nodule radiograph ratio, 34067:9225) in 34676 patients (healthy-to-nodule ratio, 30784:3892; 19230 men [mean age, 52.8
years; age range, 18–99 years]; 15446 women [mean age, 52.3 years; age range, 18–98 years]) obtained between 2010 and 2015,
which were labeled and partially annotated by 13 board-certified radiologists, in a convolutional neural network. Radiograph clas-
sification and nodule detection performances of DLAD were validated by using one internal and four external data sets from three
South Korean hospitals and one U.S. hospital. For internal and external validation, radiograph classification and nodule detection
performances of DLAD were evaluated by using the area under the receiver operating characteristic curve (AUROC) and jackknife
alternative free-response receiver-operating characteristic (JAFROC) figure of merit (FOM), respectively. An observer performance
test involving 18 physicians, including nine board-certified radiologists, was conducted by using one of the four external validation
data sets. Performances of DLAD, physicians, and physicians assisted with DLAD were evaluated and compared.
Results: According to one internal and four external validation data sets, radiograph classification and nodule detection perfor-
mances of DLAD were a range of 0.92–0.99 (AUROC) and 0.831–0.924 (JAFROC FOM), respectively. DLAD showed a higher
AUROC and JAFROC FOM at the observer performance test than 17 of 18 and 15 of 18 physicians, respectively (P , .05), and
all physicians showed improved nodule detection performances with DLAD (mean JAFROC FOM improvement, 0.043; range,
0.006–0.190; P , .05).
Conclusion: This deep learning–based automatic detection algorithm outperformed physicians in radiograph classification and nod-
ule detection performance for malignant pulmonary nodules on chest radiographs, and it enhanced physicians’ performances when
used as a second reader.
©RSNA, 2018
Online supplemental material is available for this article.
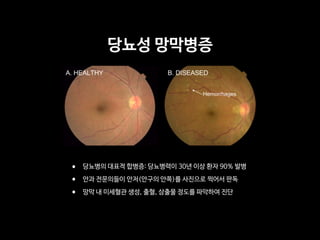
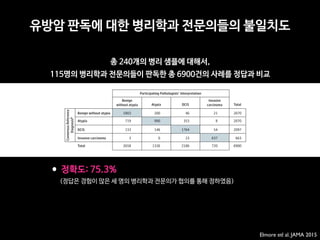
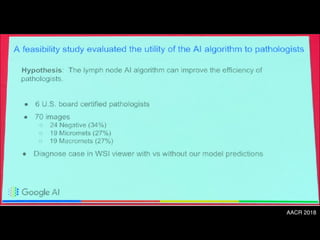
• 43,292 chest PA (normal:nodule=34,067:9225)
• labeled/annotated by 13 board-certified radiologists.
• DLAD were validated 1 internal + 4 external datasets
• 서울대병원 / 보라매병원 / 국립암센터 / UCSF
• Classification / Lesion localization
• 인공지능 vs. 의사 vs. 인공지능+의사
• 다양한 수준의 의사와 비교
• non-radiology / radiology residents
• board-certified radiologist / Thoracic radiologists](https://image.slidesharecdn.com/snuhmedicalai1810103-181010144352/85/updated-18-10-82-320.jpg)
![This copy is for personal use only.
To order printed copies, contact reprints@rsna.org
This copy is for personal use only.
To order printed copies, contact reprints@rsna.org
ORIGINAL RESEARCH • THORACIC IMAGING
hest radiography, one of the most common diagnos- intraobserver agreements because of its limited spatial reso-
Development and Validation of Deep
Learning–based Automatic Detection
Algorithm for Malignant Pulmonary Nodules
on Chest Radiographs
Ju Gang Nam, MD* • Sunggyun Park, PhD* • Eui Jin Hwang, MD • Jong Hyuk Lee, MD • Kwang-Nam Jin, MD,
PhD • KunYoung Lim, MD, PhD • Thienkai HuyVu, MD, PhD • Jae Ho Sohn, MD • Sangheum Hwang, PhD • Jin
Mo Goo, MD, PhD • Chang Min Park, MD, PhD
From the Department of Radiology and Institute of Radiation Medicine, Seoul National University Hospital and College of Medicine, 101 Daehak-ro, Jongno-gu, Seoul
03080, Republic of Korea (J.G.N., E.J.H., J.M.G., C.M.P.); Lunit Incorporated, Seoul, Republic of Korea (S.P.); Department of Radiology, Armed Forces Seoul Hospital,
Seoul, Republic of Korea (J.H.L.); Department of Radiology, Seoul National University Boramae Medical Center, Seoul, Republic of Korea (K.N.J.); Department of
Radiology, National Cancer Center, Goyang, Republic of Korea (K.Y.L.); Department of Radiology and Biomedical Imaging, University of California, San Francisco,
San Francisco, Calif (T.H.V., J.H.S.); and Department of Industrial & Information Systems Engineering, Seoul National University of Science and Technology, Seoul,
Republic of Korea (S.H.). Received January 30, 2018; revision requested March 20; revision received July 29; accepted August 6. Address correspondence to C.M.P.
(e-mail: cmpark.morphius@gmail.com).
Study supported by SNUH Research Fund and Lunit (06–2016–3000) and by Seoul Research and Business Development Program (FI170002).
*J.G.N. and S.P. contributed equally to this work.
Conflicts of interest are listed at the end of this article.
Radiology 2018; 00:1–11 • https://doi.org/10.1148/radiol.2018180237 • Content codes:
Purpose: To develop and validate a deep learning–based automatic detection algorithm (DLAD) for malignant pulmonary nodules
on chest radiographs and to compare its performance with physicians including thoracic radiologists.
Materials and Methods: For this retrospective study, DLAD was developed by using 43292 chest radiographs (normal radiograph–
to–nodule radiograph ratio, 34067:9225) in 34676 patients (healthy-to-nodule ratio, 30784:3892; 19230 men [mean age, 52.8
years; age range, 18–99 years]; 15446 women [mean age, 52.3 years; age range, 18–98 years]) obtained between 2010 and 2015,
which were labeled and partially annotated by 13 board-certified radiologists, in a convolutional neural network. Radiograph clas-
sification and nodule detection performances of DLAD were validated by using one internal and four external data sets from three
South Korean hospitals and one U.S. hospital. For internal and external validation, radiograph classification and nodule detection
performances of DLAD were evaluated by using the area under the receiver operating characteristic curve (AUROC) and jackknife
alternative free-response receiver-operating characteristic (JAFROC) figure of merit (FOM), respectively. An observer performance
test involving 18 physicians, including nine board-certified radiologists, was conducted by using one of the four external validation
data sets. Performances of DLAD, physicians, and physicians assisted with DLAD were evaluated and compared.
Results: According to one internal and four external validation data sets, radiograph classification and nodule detection perfor-
mances of DLAD were a range of 0.92–0.99 (AUROC) and 0.831–0.924 (JAFROC FOM), respectively. DLAD showed a higher
AUROC and JAFROC FOM at the observer performance test than 17 of 18 and 15 of 18 physicians, respectively (P , .05), and
all physicians showed improved nodule detection performances with DLAD (mean JAFROC FOM improvement, 0.043; range,
0.006–0.190; P , .05).
Conclusion: This deep learning–based automatic detection algorithm outperformed physicians in radiograph classification and nod-
ule detection performance for malignant pulmonary nodules on chest radiographs, and it enhanced physicians’ performances when
used as a second reader.
©RSNA, 2018
Online supplemental material is available for this article.
• 43,292 chest PA (normal:nodule=34,067:9225)
• labeled/annotated by 13 board-certified radiologists.
• DLAD were validated 1 internal + 4 external datasets
• 서울대병원 / 보라매병원 / 국립암센터 / UCSF
• Classification / Lesion localization
• 인공지능 vs. 의사 vs. 인공지능+의사
• 다양한 수준의 의사와 비교
• non-radiology / radiology residents
• board-certified radiologist / Thoracic radiologists](https://image.slidesharecdn.com/snuhmedicalai1810103-181010144352/85/updated-18-10-83-320.jpg)
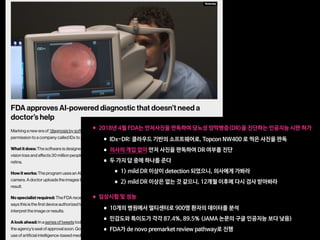
![Copyright 2016 American Medical Association. All rights reserved.
Development and Validation of a Deep Learning Algorithm
for Detection of Diabetic Retinopathy
in Retinal Fundus Photographs
Varun Gulshan, PhD; Lily Peng, MD, PhD; Marc Coram, PhD; Martin C. Stumpe, PhD; Derek Wu, BS; Arunachalam Narayanaswamy, PhD;
Subhashini Venugopalan, MS; Kasumi Widner, MS; Tom Madams, MEng; Jorge Cuadros, OD, PhD; Ramasamy Kim, OD, DNB;
Rajiv Raman, MS, DNB; Philip C. Nelson, BS; Jessica L. Mega, MD, MPH; Dale R. Webster, PhD
IMPORTANCE Deep learning is a family of computational methods that allow an algorithm to
program itself by learning from a large set of examples that demonstrate the desired
behavior, removing the need to specify rules explicitly. Application of these methods to
medical imaging requires further assessment and validation.
OBJECTIVE To apply deep learning to create an algorithm for automated detection of diabetic
retinopathy and diabetic macular edema in retinal fundus photographs.
DESIGN AND SETTING A specific type of neural network optimized for image classification
called a deep convolutional neural network was trained using a retrospective development
data set of 128 175 retinal images, which were graded 3 to 7 times for diabetic retinopathy,
diabetic macular edema, and image gradability by a panel of 54 US licensed ophthalmologists
and ophthalmology senior residents between May and December 2015. The resultant
algorithm was validated in January and February 2016 using 2 separate data sets, both
graded by at least 7 US board-certified ophthalmologists with high intragrader consistency.
EXPOSURE Deep learning–trained algorithm.
MAIN OUTCOMES AND MEASURES The sensitivity and specificity of the algorithm for detecting
referable diabetic retinopathy (RDR), defined as moderate and worse diabetic retinopathy,
referable diabetic macular edema, or both, were generated based on the reference standard
of the majority decision of the ophthalmologist panel. The algorithm was evaluated at 2
operating points selected from the development set, one selected for high specificity and
another for high sensitivity.
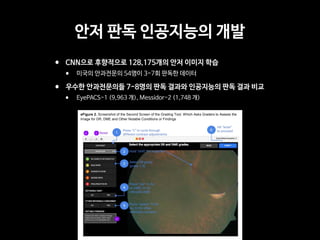
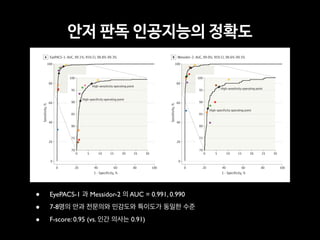
RESULTS TheEyePACS-1datasetconsistedof9963imagesfrom4997patients(meanage,54.4
years;62.2%women;prevalenceofRDR,683/8878fullygradableimages[7.8%]);the
Messidor-2datasethad1748imagesfrom874patients(meanage,57.6years;42.6%women;
prevalenceofRDR,254/1745fullygradableimages[14.6%]).FordetectingRDR,thealgorithm
hadanareaunderthereceiveroperatingcurveof0.991(95%CI,0.988-0.993)forEyePACS-1and
0.990(95%CI,0.986-0.995)forMessidor-2.Usingthefirstoperatingcutpointwithhigh
specificity,forEyePACS-1,thesensitivitywas90.3%(95%CI,87.5%-92.7%)andthespecificity
was98.1%(95%CI,97.8%-98.5%).ForMessidor-2,thesensitivitywas87.0%(95%CI,81.1%-
91.0%)andthespecificitywas98.5%(95%CI,97.7%-99.1%).Usingasecondoperatingpoint
withhighsensitivityinthedevelopmentset,forEyePACS-1thesensitivitywas97.5%and
specificitywas93.4%andforMessidor-2thesensitivitywas96.1%andspecificitywas93.9%.
CONCLUSIONS AND RELEVANCE In this evaluation of retinal fundus photographs from adults
with diabetes, an algorithm based on deep machine learning had high sensitivity and
specificity for detecting referable diabetic retinopathy. Further research is necessary to
determine the feasibility of applying this algorithm in the clinical setting and to determine
whether use of the algorithm could lead to improved care and outcomes compared with
current ophthalmologic assessment.
JAMA. doi:10.1001/jama.2016.17216
Published online November 29, 2016.
Editorial
Supplemental content
Author Affiliations: Google Inc,
Mountain View, California (Gulshan,
Peng, Coram, Stumpe, Wu,
Narayanaswamy, Venugopalan,
Widner, Madams, Nelson, Webster);
Department of Computer Science,
University of Texas, Austin
(Venugopalan); EyePACS LLC,
San Jose, California (Cuadros); School
of Optometry, Vision Science
Graduate Group, University of
California, Berkeley (Cuadros);
Aravind Medical Research
Foundation, Aravind Eye Care
System, Madurai, India (Kim); Shri
Bhagwan Mahavir Vitreoretinal
Services, Sankara Nethralaya,
Chennai, Tamil Nadu, India (Raman);
Verily Life Sciences, Mountain View,
California (Mega); Cardiovascular
Division, Department of Medicine,
Brigham and Women’s Hospital and
Harvard Medical School, Boston,
Massachusetts (Mega).
Corresponding Author: Lily Peng,
MD, PhD, Google Research, 1600
Amphitheatre Way, Mountain View,
CA 94043 (lhpeng@google.com).
Research
JAMA | Original Investigation | INNOVATIONS IN HEALTH CARE DELIVERY
(Reprinted) E1
Copyright 2016 American Medical Association. All rights reserved.](https://image.slidesharecdn.com/snuhmedicalai1810103-181010144352/85/updated-18-10-92-320.jpg)

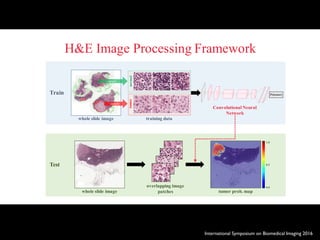


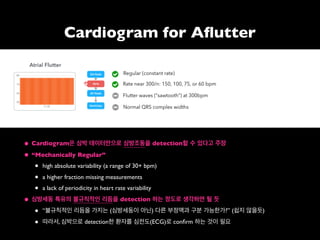
![Fig 1. What can consumer wearables do? Heart rate can be measured with an oximeter built into a ring [3], muscle activity with an electromyographi
sensor embedded into clothing [4], stress with an electodermal sensor incorporated into a wristband [5], and physical activity or sleep patterns via an
accelerometer in a watch [6,7]. In addition, a female’s most fertile period can be identified with detailed body temperature tracking [8], while levels of me
attention can be monitored with a small number of non-gelled electroencephalogram (EEG) electrodes [9]. Levels of social interaction (also known to a
PLOS Medicine 2016](https://image.slidesharecdn.com/snuhmedicalai1810103-181010144352/85/updated-18-10-128-320.jpg)

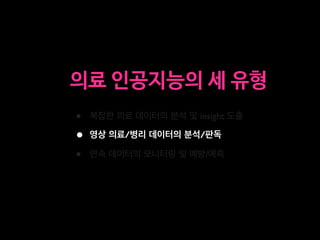
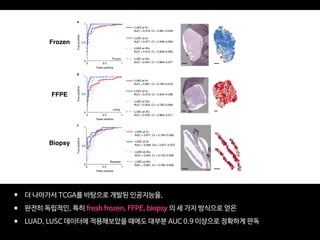
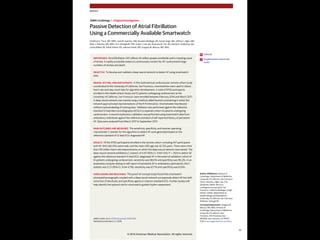
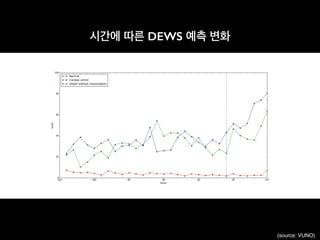
![S E P S I S
A targeted real-time early warning score (TREWScore)
for septic shock
Katharine E. Henry,1
David N. Hager,2
Peter J. Pronovost,3,4,5
Suchi Saria1,3,5,6
*
Sepsis is a leading cause of death in the United States, with mortality highest among patients who develop septic
shock. Early aggressive treatment decreases morbidity and mortality. Although automated screening tools can detect
patients currently experiencing severe sepsis and septic shock, none predict those at greatest risk of developing
shock. We analyzed routinely available physiological and laboratory data from intensive care unit patients and devel-
oped “TREWScore,” a targeted real-time early warning score that predicts which patients will develop septic shock.
TREWScore identified patients before the onset of septic shock with an area under the ROC (receiver operating
characteristic) curve (AUC) of 0.83 [95% confidence interval (CI), 0.81 to 0.85]. At a specificity of 0.67, TREWScore
achieved a sensitivity of 0.85 and identified patients a median of 28.2 [interquartile range (IQR), 10.6 to 94.2] hours
before onset. Of those identified, two-thirds were identified before any sepsis-related organ dysfunction. In compar-
ison, the Modified Early Warning Score, which has been used clinically for septic shock prediction, achieved a lower
AUC of 0.73 (95% CI, 0.71 to 0.76). A routine screening protocol based on the presence of two of the systemic inflam-
matory response syndrome criteria, suspicion of infection, and either hypotension or hyperlactatemia achieved a low-
er sensitivity of 0.74 at a comparable specificity of 0.64. Continuous sampling of data from the electronic health
records and calculation of TREWScore may allow clinicians to identify patients at risk for septic shock and provide
earlier interventions that would prevent or mitigate the associated morbidity and mortality.
INTRODUCTION
Seven hundred fifty thousand patients develop severe sepsis and septic
shock in the United States each year. More than half of them are
admitted to an intensive care unit (ICU), accounting for 10% of all
ICU admissions, 20 to 30% of hospital deaths, and $15.4 billion in an-
nual health care costs (1–3). Several studies have demonstrated that
morbidity, mortality, and length of stay are decreased when severe sep-
sis and septic shock are identified and treated early (4–8). In particular,
one study showed that mortality from septic shock increased by 7.6%
with every hour that treatment was delayed after the onset of hypo-
tension (9).
More recent studies comparing protocolized care, usual care, and
early goal-directed therapy (EGDT) for patients with septic shock sug-
gest that usual care is as effective as EGDT (10–12). Some have inter-
preted this to mean that usual care has improved over time and reflects
important aspects of EGDT, such as early antibiotics and early ag-
gressive fluid resuscitation (13). It is likely that continued early identi-
fication and treatment will further improve outcomes. However, the
Acute Physiology Score (SAPS II), SequentialOrgan Failure Assessment
(SOFA) scores, Modified Early Warning Score (MEWS), and Simple
Clinical Score (SCS) have been validated to assess illness severity and
risk of death among septic patients (14–17). Although these scores
are useful for predicting general deterioration or mortality, they typical-
ly cannot distinguish with high sensitivity and specificity which patients
are at highest risk of developing a specific acute condition.
The increased use of electronic health records (EHRs), which can be
queried in real time, has generated interest in automating tools that
identify patients at risk for septic shock (18–20). A number of “early
warning systems,” “track and trigger” initiatives, “listening applica-
tions,” and “sniffers” have been implemented to improve detection
andtimelinessof therapy forpatients with severe sepsis andseptic shock
(18, 20–23). Although these tools have been successful at detecting pa-
tients currently experiencing severe sepsis or septic shock, none predict
which patients are at highest risk of developing septic shock.
The adoption of the Affordable Care Act has added to the growing
excitement around predictive models derived from electronic health
R E S E A R C H A R T I C L E
onNovember3,2016http://stm.sciencemag.org/Downloadedfrom](https://image.slidesharecdn.com/snuhmedicalai1810103-181010144352/85/updated-18-10-134-320.jpg)
![puted as new data became avail
when his or her score crossed t
dation set, the AUC obtained f
0.81 to 0.85) (Fig. 2). At a spec
of 0.33], TREWScore achieved a s
a median of 28.2 hours (IQR, 10
Identification of patients b
A critical event in the developme
related organ dysfunction (seve
been shown to increase after th
more than two-thirds (68.8%) o
were identified before any sepsi
tients were identified a median
(Fig. 3B).
Comparison of TREWScore
Weevaluatedtheperformanceof
methods for the purpose of provid
use of TREWScore. We first com
to MEWS, a general metric used
of catastrophic deterioration (17
oped for tracking sepsis, MEWS
tion of patients at risk for severe
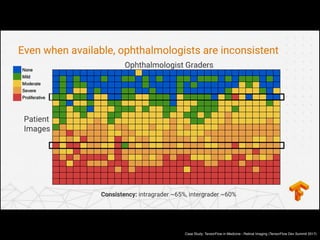
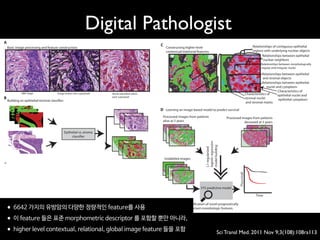
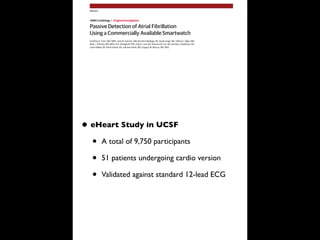
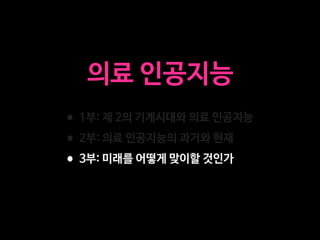
Fig. 2. ROC for detection of septic shock before onset in the validation
set. The ROC curve for TREWScore is shown in blue, with the ROC curve for
MEWS in red. The sensitivity and specificity performance of the routine
screening criteria is indicated by the purple dot. Normal 95% CIs are shown
for TREWScore and MEWS. TPR, true-positive rate; FPR, false-positive rate.
R E S E A R C H A R T I C L E
A targeted real-time early warning score (TREWScore)
for septic shock
AUC=0.83
At a specificity of 0.67,TREWScore achieved a sensitivity of 0.85
and identified patients a median of 28.2 hours before onset.](https://image.slidesharecdn.com/snuhmedicalai1810103-181010144352/85/updated-18-10-135-320.jpg)


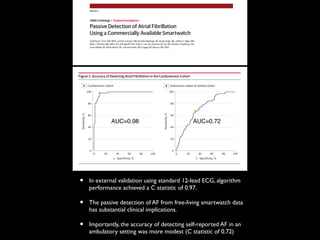
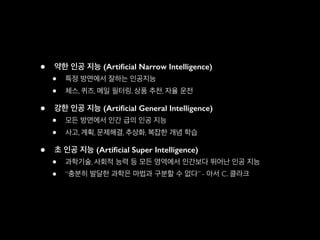
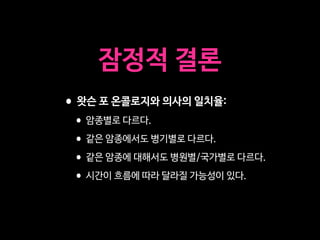
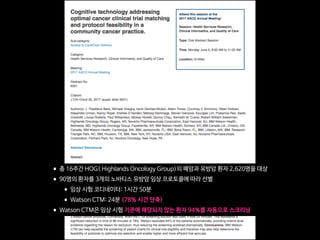
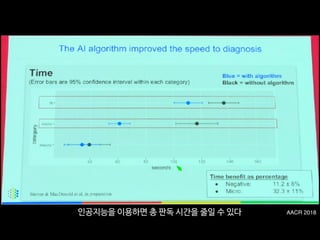
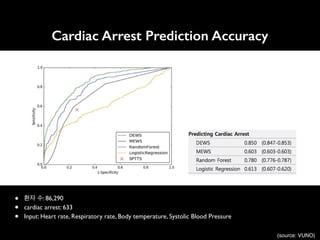
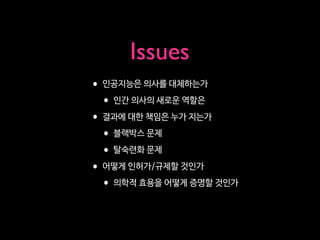
![An Algorithm Based on Deep Learning for Predicting In-Hospital
Cardiac Arrest
Joon-myoung Kwon, MD;* Youngnam Lee, MS;* Yeha Lee, PhD; Seungwoo Lee, BS; Jinsik Park, MD, PhD
Background-—In-hospital cardiac arrest is a major burden to public health, which affects patient safety. Although traditional track-
and-trigger systems are used to predict cardiac arrest early, they have limitations, with low sensitivity and high false-alarm rates.
We propose a deep learning–based early warning system that shows higher performance than the existing track-and-trigger
systems.
Methods and Results-—This retrospective cohort study reviewed patients who were admitted to 2 hospitals from June 2010 to July
2017. A total of 52 131 patients were included. Specifically, a recurrent neural network was trained using data from June 2010 to
January 2017. The result was tested using the data from February to July 2017. The primary outcome was cardiac arrest, and the
secondary outcome was death without attempted resuscitation. As comparative measures, we used the area under the receiver
operating characteristic curve (AUROC), the area under the precision–recall curve (AUPRC), and the net reclassification index.
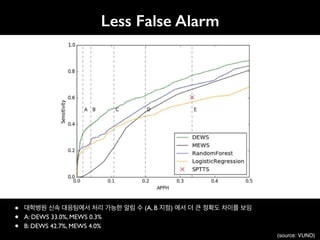
Furthermore, we evaluated sensitivity while varying the number of alarms. The deep learning–based early warning system (AUROC:
0.850; AUPRC: 0.044) significantly outperformed a modified early warning score (AUROC: 0.603; AUPRC: 0.003), a random forest
algorithm (AUROC: 0.780; AUPRC: 0.014), and logistic regression (AUROC: 0.613; AUPRC: 0.007). Furthermore, the deep learning–
based early warning system reduced the number of alarms by 82.2%, 13.5%, and 42.1% compared with the modified early warning
system, random forest, and logistic regression, respectively, at the same sensitivity.
Conclusions-—An algorithm based on deep learning had high sensitivity and a low false-alarm rate for detection of patients with
cardiac arrest in the multicenter study. (J Am Heart Assoc. 2018;7:e008678. DOI: 10.1161/JAHA.118.008678.)
Key Words: artificial intelligence • cardiac arrest • deep learning • machine learning • rapid response system • resuscitation
In-hospital cardiac arrest is a major burden to public health,
which affects patient safety.1–3
More than a half of cardiac
arrests result from respiratory failure or hypovolemic shock,
and 80% of patients with cardiac arrest show signs of
deterioration in the 8 hours before cardiac arrest.4–9
However,
209 000 in-hospital cardiac arrests occur in the United States
each year, and the survival discharge rate for patients with
cardiac arrest is <20% worldwide.10,11
Rapid response systems
(RRSs) have been introduced in many hospitals to detect
cardiac arrest using the track-and-trigger system (TTS).12,13
Two types of TTS are used in RRSs. For the single-parameter
TTS (SPTTS), cardiac arrest is predicted if any single vital sign
(eg, heart rate [HR], blood pressure) is out of the normal
range.14
The aggregated weighted TTS calculates a weighted
score for each vital sign and then finds patients with cardiac
arrest based on the sum of these scores.15
The modified early
warning score (MEWS) is one of the most widely used
approaches among all aggregated weighted TTSs (Table 1)16
;
however, traditional TTSs including MEWS have limitations, with
low sensitivity or high false-alarm rates.14,15,17
Sensitivity and
false-alarm rate interact: Increased sensitivity creates higher
false-alarm rates and vice versa.
Current RRSs suffer from low sensitivity or a high false-
alarm rate. An RRS was used for only 30% of patients before
unplanned intensive care unit admission and was not used for
22.8% of patients, even if they met the criteria.18,19
From the Departments of Emergency Medicine (J.-m.K.) and Cardiology (J.P.), Mediplex Sejong Hospital, Incheon, Korea; VUNO, Seoul, Korea (Youngnam L., Yeha L.,
S.L.).
*Dr Kwon and Mr Youngnam Lee contributed equally to this study.
Correspondence to: Joon-myoung Kwon, MD, Department of Emergency medicine, Mediplex Sejong Hospital, 20, Gyeyangmunhwa-ro, Gyeyang-gu, Incheon 21080,
Korea. E-mail: kwonjm@sejongh.co.kr
Received January 18, 2018; accepted May 31, 2018.
ª 2018 The Authors. Published on behalf of the American Heart Association, Inc., by Wiley. This is an open access article under the terms of the Creative Commons
Attribution-NonCommercial License, which permits use, distribution and reproduction in any medium, provided the original work is properly cited and is not used for
commercial purposes.
DOI: 10.1161/JAHA.118.008678 Journal of the American Heart Association 1
ORIGINAL RESEARCH
byguestonJune28,2018http://jaha.ahajournals.org/Downloadedfrom](https://image.slidesharecdn.com/snuhmedicalai1810103-181010144352/85/updated-18-10-153-320.jpg)


Professor Yoon Sup Choi is a leading expert in digital healthcare and artificial intelligence in Korea. He is a professor at Sungkyunkwan University and the director of the Digital Healthcare Institute. The document provides background information on Professor Choi, including his educational background, positions held, and publications. It also contains endorsements from other academics on his book "Medical Artificial Intelligence", which provides a balanced perspective on the current state and future of medical AI, and will serve as a useful guide for medical students and professionals. The book covers topics like the concepts and applications of medical AI, and its relationship with doctors.


![[DL輪読会]Causality Inspired Representation Learning for Domain Generalization](https://cdn.slidesharecdn.com/ss_thumbnails/20220422lin-220422031920-thumbnail.jpg?width=640&height=640&fit=bounds)


![[365mc] 디지털 헬스케어: 의료의 미래](https://cdn.slidesharecdn.com/ss_thumbnails/365mc-200317140059-thumbnail.jpg?width=640&height=640&fit=bounds)


![[C&C] 의료의 미래 디지털 헬스케어](https://cdn.slidesharecdn.com/ss_thumbnails/cc-200616080105-thumbnail.jpg?width=640&height=640&fit=bounds)
![[KNAPS] 포스트 코로나 시대, 제약 산업과 디지털 헬스케어](https://cdn.slidesharecdn.com/ss_thumbnails/knaps-210128022335-thumbnail.jpg?width=640&height=640&fit=bounds)


![[대한병리학회] 의료 인공지능 101: 병리를 중심으로](https://cdn.slidesharecdn.com/ss_thumbnails/pathology-201106004112-thumbnail.jpg?width=640&height=640&fit=bounds)


![[ASGO 2019] Artificial Intelligence in Medicine](https://cdn.slidesharecdn.com/ss_thumbnails/asgo2019medicalai191010-191010155811-thumbnail.jpg?width=640&height=640&fit=bounds)


