


![EDITORIAL OPEN
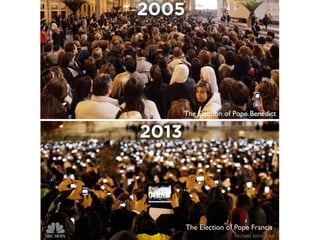
Digital medicine, on its way to being just plain medicine
npj Digital Medicine (2018)1:20175 ; doi:10.1038/
s41746-017-0005-1
There are already nearly 30,000 peer-reviewed English-language
scientific journals, producing an estimated 2.5 million articles a year.1
So why another, and why one focused specifically on digital
medicine?
To answer that question, we need to begin by defining what
“digital medicine” means: using digital tools to upgrade the
practice of medicine to one that is high-definition and far more
individualized. It encompasses our ability to digitize human beings
using biosensors that track our complex physiologic systems, but
also the means to process the vast data generated via algorithms,
cloud computing, and artificial intelligence. It has the potential to
democratize medicine, with smartphones as the hub, enabling
each individual to generate their own real world data and being
far more engaged with their health. Add to this new imaging
tools, mobile device laboratory capabilities, end-to-end digital
clinical trials, telemedicine, and one can see there is a remarkable
array of transformative technology which lays the groundwork for
a new form of healthcare.
As is obvious by its definition, the far-reaching scope of digital
medicine straddles many and widely varied expertise. Computer
scientists, healthcare providers, engineers, behavioral scientists,
ethicists, clinical researchers, and epidemiologists are just some of
the backgrounds necessary to move the field forward. But to truly
accelerate the development of digital medicine solutions in health
requires the collaborative and thoughtful interaction between
individuals from several, if not most of these specialties. That is the
primary goal of npj Digital Medicine: to serve as a cross-cutting
resource for everyone interested in this area, fostering collabora-
tions and accelerating its advancement.
Current systems of healthcare face multiple insurmountable
challenges. Patients are not receiving the kind of care they want
and need, caregivers are dissatisfied with their role, and in most
countries, especially the United States, the cost of care is
unsustainable. We are confident that the development of new
systems of care that take full advantage of the many capabilities
that digital innovations bring can address all of these major issues.
Researchers too, can take advantage of these leading-edge
technologies as they enable clinical research to break free of the
confines of the academic medical center and be brought into the
real world of participants’ lives. The continuous capture of multiple
interconnected streams of data will allow for a much deeper
refinement of our understanding and definition of most pheno-
types, with the discovery of novel signals in these enormous data
sets made possible only through the use of machine learning.
Our enthusiasm for the future of digital medicine is tempered by
the recognition that presently too much of the publicized work in
this field is characterized by irrational exuberance and excessive
hype. Many technologies have yet to be formally studied in a
clinical setting, and for those that have, too many began and
ended with an under-powered pilot program. In addition, there are
more than a few examples of digital “snake oil” with substantial
uptake prior to their eventual discrediting.2
Both of these practices
are barriers to advancing the field of digital medicine.
Our vision for npj Digital Medicine is to provide a reliable,
evidence-based forum for all clinicians, researchers, and even
patients, curious about how digital technologies can transform
every aspect of health management and care. Being open source,
as all medical research should be, allows for the broadest possible
dissemination, which we will strongly encourage, including
through advocating for the publication of preprints
And finally, quite paradoxically, we hope that npj Digital
Medicine is so successful that in the coming years there will no
longer be a need for this journal, or any journal specifically
focused on digital medicine. Because if we are able to meet our
primary goal of accelerating the advancement of digital medicine,
then soon, we will just be calling it medicine. And there are
already several excellent journals for that.
ACKNOWLEDGEMENTS
Supported by the National Institutes of Health (NIH)/National Center for Advancing
Translational Sciences grant UL1TR001114 and a grant from the Qualcomm Foundation.
ADDITIONAL INFORMATION
Competing interests:The authors declare no competing financial interests.
Publisher's note:Springer Nature remains neutral with regard to jurisdictional claims
in published maps and institutional affiliations.
Change history:The original version of this Article had an incorrect Article number
of 5 and an incorrect Publication year of 2017. These errors have now been corrected
in the PDF and HTML versions of the Article.
Steven R. Steinhubl1
and Eric J. Topol1
1
Scripps Translational Science Institute, 3344 North Torrey Pines
Court, Suite 300, La Jolla, CA 92037, USA
Correspondence: Steven R. Steinhubl (steinhub@scripps.edu) or
Eric J. Topol (etopol@scripps.edu)
REFERENCES
1. Ware, M. & Mabe, M. The STM report: an overview of scientific and scholarly journal
publishing 2015 [updated March]. http://digitalcommons.unl.edu/scholcom/92017
(2015).
2. Plante, T. B., Urrea, B. & MacFarlane, Z. T. et al. Validation of the instant blood
pressure smartphone App. JAMA Intern. Med. 176, 700–702 (2016).
Open Access This article is licensed under a Creative Commons
Attribution 4.0 International License, which permits use, sharing,
adaptation, distribution and reproduction in any medium or format, as long as you give
appropriate credit to the original author(s) and the source, provide a link to the Creative
Commons license, and indicate if changes were made. The images or other third party
material in this article are included in the article’s Creative Commons license, unless
indicated otherwise in a credit line to the material. If material is not included in the
article’s Creative Commons license and your intended use is not permitted by statutory
regulation or exceeds the permitted use, you will need to obtain permission directly
from the copyright holder. To view a copy of this license, visit http://creativecommons.
org/licenses/by/4.0/.
© The Author(s) 2018
Received: 19 October 2017 Accepted: 25 October 2017
www.nature.com/npjdigitalmed
Published in partnership with the Scripps Translational Science Institute
디지털 의료의 미래는?
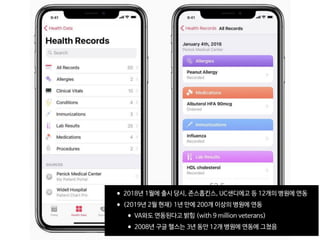
일상적인 의료가 되는 것](https://image.slidesharecdn.com/scl-190627093851/85/slide-17-320.jpg)


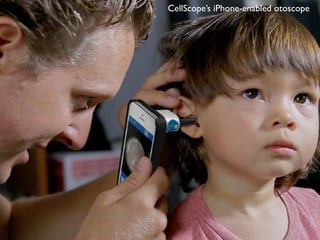


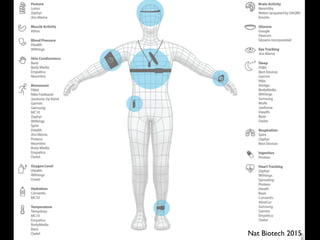
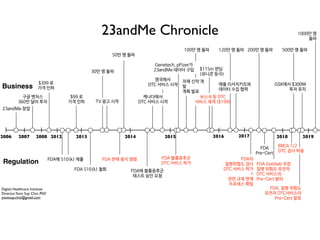
![Fig 1. What can consumer wearables do? Heart rate can be measured with an oximeter built into a ring [3], muscle activity with an electromyographi
sensor embedded into clothing [4], stress with an electodermal sensor incorporated into a wristband [5], and physical activity or sleep patterns via an
accelerometer in a watch [6,7]. In addition, a female’s most fertile period can be identified with detailed body temperature tracking [8], while levels of me
attention can be monitored with a small number of non-gelled electroencephalogram (EEG) electrodes [9]. Levels of social interaction (also known to a
PLOS Medicine 2016](https://image.slidesharecdn.com/scl-190627093851/85/slide-58-320.jpg)


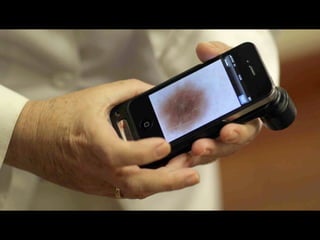
![Copyright 2016 American Medical Association. All rights reserved.
Development and Validation of a Deep Learning Algorithm
for Detection of Diabetic Retinopathy
in Retinal Fundus Photographs
Varun Gulshan, PhD; Lily Peng, MD, PhD; Marc Coram, PhD; Martin C. Stumpe, PhD; Derek Wu, BS; Arunachalam Narayanaswamy, PhD;
Subhashini Venugopalan, MS; Kasumi Widner, MS; Tom Madams, MEng; Jorge Cuadros, OD, PhD; Ramasamy Kim, OD, DNB;
Rajiv Raman, MS, DNB; Philip C. Nelson, BS; Jessica L. Mega, MD, MPH; Dale R. Webster, PhD
IMPORTANCE Deep learning is a family of computational methods that allow an algorithm to
program itself by learning from a large set of examples that demonstrate the desired
behavior, removing the need to specify rules explicitly. Application of these methods to
medical imaging requires further assessment and validation.
OBJECTIVE To apply deep learning to create an algorithm for automated detection of diabetic
retinopathy and diabetic macular edema in retinal fundus photographs.
DESIGN AND SETTING A specific type of neural network optimized for image classification
called a deep convolutional neural network was trained using a retrospective development
data set of 128 175 retinal images, which were graded 3 to 7 times for diabetic retinopathy,
diabetic macular edema, and image gradability by a panel of 54 US licensed ophthalmologists
and ophthalmology senior residents between May and December 2015. The resultant
algorithm was validated in January and February 2016 using 2 separate data sets, both
graded by at least 7 US board-certified ophthalmologists with high intragrader consistency.
EXPOSURE Deep learning–trained algorithm.
MAIN OUTCOMES AND MEASURES The sensitivity and specificity of the algorithm for detecting
referable diabetic retinopathy (RDR), defined as moderate and worse diabetic retinopathy,
referable diabetic macular edema, or both, were generated based on the reference standard
of the majority decision of the ophthalmologist panel. The algorithm was evaluated at 2
operating points selected from the development set, one selected for high specificity and
another for high sensitivity.
RESULTS TheEyePACS-1datasetconsistedof9963imagesfrom4997patients(meanage,54.4
years;62.2%women;prevalenceofRDR,683/8878fullygradableimages[7.8%]);the
Messidor-2datasethad1748imagesfrom874patients(meanage,57.6years;42.6%women;
prevalenceofRDR,254/1745fullygradableimages[14.6%]).FordetectingRDR,thealgorithm
hadanareaunderthereceiveroperatingcurveof0.991(95%CI,0.988-0.993)forEyePACS-1and
0.990(95%CI,0.986-0.995)forMessidor-2.Usingthefirstoperatingcutpointwithhigh
specificity,forEyePACS-1,thesensitivitywas90.3%(95%CI,87.5%-92.7%)andthespecificity
was98.1%(95%CI,97.8%-98.5%).ForMessidor-2,thesensitivitywas87.0%(95%CI,81.1%-
91.0%)andthespecificitywas98.5%(95%CI,97.7%-99.1%).Usingasecondoperatingpoint
withhighsensitivityinthedevelopmentset,forEyePACS-1thesensitivitywas97.5%and
specificitywas93.4%andforMessidor-2thesensitivitywas96.1%andspecificitywas93.9%.
CONCLUSIONS AND RELEVANCE In this evaluation of retinal fundus photographs from adults
with diabetes, an algorithm based on deep machine learning had high sensitivity and
specificity for detecting referable diabetic retinopathy. Further research is necessary to
determine the feasibility of applying this algorithm in the clinical setting and to determine
whether use of the algorithm could lead to improved care and outcomes compared with
current ophthalmologic assessment.
JAMA. doi:10.1001/jama.2016.17216
Published online November 29, 2016.
Editorial
Supplemental content
Author Affiliations: Google Inc,
Mountain View, California (Gulshan,
Peng, Coram, Stumpe, Wu,
Narayanaswamy, Venugopalan,
Widner, Madams, Nelson, Webster);
Department of Computer Science,
University of Texas, Austin
(Venugopalan); EyePACS LLC,
San Jose, California (Cuadros); School
of Optometry, Vision Science
Graduate Group, University of
California, Berkeley (Cuadros);
Aravind Medical Research
Foundation, Aravind Eye Care
System, Madurai, India (Kim); Shri
Bhagwan Mahavir Vitreoretinal
Services, Sankara Nethralaya,
Chennai, Tamil Nadu, India (Raman);
Verily Life Sciences, Mountain View,
California (Mega); Cardiovascular
Division, Department of Medicine,
Brigham and Women’s Hospital and
Harvard Medical School, Boston,
Massachusetts (Mega).
Corresponding Author: Lily Peng,
MD, PhD, Google Research, 1600
Amphitheatre Way, Mountain View,
CA 94043 (lhpeng@google.com).
Research
JAMA | Original Investigation | INNOVATIONS IN HEALTH CARE DELIVERY
(Reprinted) E1
Copyright 2016 American Medical Association. All rights reserved.
Downloaded From: http://jamanetwork.com/ on 12/02/2016
안과
LETTERS
https://doi.org/10.1038/s41591-018-0335-9
1
Guangzhou Women and Children’s Medical Center, Guangzhou Medical University, Guangzhou, China. 2
Institute for Genomic Medicine, Institute of
Engineering in Medicine, and Shiley Eye Institute, University of California, San Diego, La Jolla, CA, USA. 3
Hangzhou YITU Healthcare Technology Co. Ltd,
Hangzhou, China. 4
Department of Thoracic Surgery/Oncology, First Affiliated Hospital of Guangzhou Medical University, China State Key Laboratory and
National Clinical Research Center for Respiratory Disease, Guangzhou, China. 5
Guangzhou Kangrui Co. Ltd, Guangzhou, China. 6
Guangzhou Regenerative
Medicine and Health Guangdong Laboratory, Guangzhou, China. 7
Veterans Administration Healthcare System, San Diego, CA, USA. 8
These authors contributed
equally: Huiying Liang, Brian Tsui, Hao Ni, Carolina C. S. Valentim, Sally L. Baxter, Guangjian Liu. *e-mail: kang.zhang@gmail.com; xiahumin@hotmail.com
Artificial intelligence (AI)-based methods have emerged as
powerful tools to transform medical care. Although machine
learning classifiers (MLCs) have already demonstrated strong
performance in image-based diagnoses, analysis of diverse
and massive electronic health record (EHR) data remains chal-
lenging. Here, we show that MLCs can query EHRs in a manner
similar to the hypothetico-deductive reasoning used by physi-
cians and unearth associations that previous statistical meth-
ods have not found. Our model applies an automated natural
language processing system using deep learning techniques
to extract clinically relevant information from EHRs. In total,
101.6 million data points from 1,362,559 pediatric patient
visits presenting to a major referral center were analyzed to
train and validate the framework. Our model demonstrates
high diagnostic accuracy across multiple organ systems and is
comparable to experienced pediatricians in diagnosing com-
mon childhood diseases. Our study provides a proof of con-
cept for implementing an AI-based system as a means to aid
physicians in tackling large amounts of data, augmenting diag-
nostic evaluations, and to provide clinical decision support in
cases of diagnostic uncertainty or complexity. Although this
impact may be most evident in areas where healthcare provid-
ers are in relative shortage, the benefits of such an AI system
are likely to be universal.
Medical information has become increasingly complex over
time. The range of disease entities, diagnostic testing and biomark-
ers, and treatment modalities has increased exponentially in recent
years. Subsequently, clinical decision-making has also become more
complex and demands the synthesis of decisions from assessment
of large volumes of data representing clinical information. In the
current digital age, the electronic health record (EHR) represents a
massive repository of electronic data points representing a diverse
array of clinical information1–3
. Artificial intelligence (AI) methods
have emerged as potentially powerful tools to mine EHR data to aid
in disease diagnosis and management, mimicking and perhaps even
augmenting the clinical decision-making of human physicians1
.
To formulate a diagnosis for any given patient, physicians fre-
quently use hypotheticodeductive reasoning. Starting with the chief
complaint, the physician then asks appropriately targeted questions
relating to that complaint. From this initial small feature set, the
physician forms a differential diagnosis and decides what features
(historical questions, physical exam findings, laboratory testing,
and/or imaging studies) to obtain next in order to rule in or rule
out the diagnoses in the differential diagnosis set. The most use-
ful features are identified, such that when the probability of one of
the diagnoses reaches a predetermined level of acceptability, the
process is stopped, and the diagnosis is accepted. It may be pos-
sible to achieve an acceptable level of certainty of the diagnosis with
only a few features without having to process the entire feature set.
Therefore, the physician can be considered a classifier of sorts.
In this study, we designed an AI-based system using machine
learning to extract clinically relevant features from EHR notes to
mimic the clinical reasoning of human physicians. In medicine,
machine learning methods have already demonstrated strong per-
formance in image-based diagnoses, notably in radiology2
, derma-
tology4
, and ophthalmology5–8
, but analysis of EHR data presents
a number of difficult challenges. These challenges include the vast
quantity of data, high dimensionality, data sparsity, and deviations
Evaluation and accurate diagnoses of pediatric
diseases using artificial intelligence
Huiying Liang1,8
, Brian Y. Tsui 2,8
, Hao Ni3,8
, Carolina C. S. Valentim4,8
, Sally L. Baxter 2,8
,
Guangjian Liu1,8
, Wenjia Cai 2
, Daniel S. Kermany1,2
, Xin Sun1
, Jiancong Chen2
, Liya He1
, Jie Zhu1
,
Pin Tian2
, Hua Shao2
, Lianghong Zheng5,6
, Rui Hou5,6
, Sierra Hewett1,2
, Gen Li1,2
, Ping Liang3
,
Xuan Zang3
, Zhiqi Zhang3
, Liyan Pan1
, Huimin Cai5,6
, Rujuan Ling1
, Shuhua Li1
, Yongwang Cui1
,
Shusheng Tang1
, Hong Ye1
, Xiaoyan Huang1
, Waner He1
, Wenqing Liang1
, Qing Zhang1
, Jianmin Jiang1
,
Wei Yu1
, Jianqun Gao1
, Wanxing Ou1
, Yingmin Deng1
, Qiaozhen Hou1
, Bei Wang1
, Cuichan Yao1
,
Yan Liang1
, Shu Zhang1
, Yaou Duan2
, Runze Zhang2
, Sarah Gibson2
, Charlotte L. Zhang2
, Oulan Li2
,
Edward D. Zhang2
, Gabriel Karin2
, Nathan Nguyen2
, Xiaokang Wu1,2
, Cindy Wen2
, Jie Xu2
, Wenqin Xu2
,
Bochu Wang2
, Winston Wang2
, Jing Li1,2
, Bianca Pizzato2
, Caroline Bao2
, Daoman Xiang1
, Wanting He1,2
,
Suiqin He2
, Yugui Zhou1,2
, Weldon Haw2,7
, Michael Goldbaum2
, Adriana Tremoulet2
, Chun-Nan Hsu 2
,
Hannah Carter2
, Long Zhu3
, Kang Zhang 1,2,7
* and Huimin Xia 1
*
NATURE MEDICINE | www.nature.com/naturemedicine
소아청소년과
ARTICLES
https://doi.org/10.1038/s41591-018-0177-5
1
Applied Bioinformatics Laboratories, New York University School of Medicine, New York, NY, USA. 2
Skirball Institute, Department of Cell Biology,
New York University School of Medicine, New York, NY, USA. 3
Department of Pathology, New York University School of Medicine, New York, NY, USA.
4
School of Mechanical Engineering, National Technical University of Athens, Zografou, Greece. 5
Institute for Systems Genetics, New York University School
of Medicine, New York, NY, USA. 6
Department of Biochemistry and Molecular Pharmacology, New York University School of Medicine, New York, NY,
USA. 7
Center for Biospecimen Research and Development, New York University, New York, NY, USA. 8
Department of Population Health and the Center for
Healthcare Innovation and Delivery Science, New York University School of Medicine, New York, NY, USA. 9
These authors contributed equally to this work:
Nicolas Coudray, Paolo Santiago Ocampo. *e-mail: narges.razavian@nyumc.org; aristotelis.tsirigos@nyumc.org
A
ccording to the American Cancer Society and the Cancer
Statistics Center (see URLs), over 150,000 patients with lung
cancer succumb to the disease each year (154,050 expected
for 2018), while another 200,000 new cases are diagnosed on a
yearly basis (234,030 expected for 2018). It is one of the most widely
spread cancers in the world because of not only smoking, but also
exposure to toxic chemicals like radon, asbestos and arsenic. LUAD
and LUSC are the two most prevalent types of non–small cell lung
cancer1
, and each is associated with discrete treatment guidelines. In
the absence of definitive histologic features, this important distinc-
tion can be challenging and time-consuming, and requires confir-
matory immunohistochemical stains.
Classification of lung cancer type is a key diagnostic process
because the available treatment options, including conventional
chemotherapy and, more recently, targeted therapies, differ for
LUAD and LUSC2
. Also, a LUAD diagnosis will prompt the search
for molecular biomarkers and sensitizing mutations and thus has
a great impact on treatment options3,4
. For example, epidermal
growth factor receptor (EGFR) mutations, present in about 20% of
LUAD, and anaplastic lymphoma receptor tyrosine kinase (ALK)
rearrangements, present in<5% of LUAD5
, currently have tar-
geted therapies approved by the Food and Drug Administration
(FDA)6,7
. Mutations in other genes, such as KRAS and tumor pro-
tein P53 (TP53) are very common (about 25% and 50%, respec-
tively) but have proven to be particularly challenging drug targets
so far5,8
. Lung biopsies are typically used to diagnose lung cancer
type and stage. Virtual microscopy of stained images of tissues is
typically acquired at magnifications of 20×to 40×, generating very
large two-dimensional images (10,000 to>100,000 pixels in each
dimension) that are oftentimes challenging to visually inspect in
an exhaustive manner. Furthermore, accurate interpretation can be
difficult, and the distinction between LUAD and LUSC is not always
clear, particularly in poorly differentiated tumors; in this case, ancil-
lary studies are recommended for accurate classification9,10
. To assist
experts, automatic analysis of lung cancer whole-slide images has
been recently studied to predict survival outcomes11
and classifica-
tion12
. For the latter, Yu et al.12
combined conventional thresholding
and image processing techniques with machine-learning methods,
such as random forest classifiers, support vector machines (SVM) or
Naive Bayes classifiers, achieving an AUC of ~0.85 in distinguishing
normal from tumor slides, and ~0.75 in distinguishing LUAD from
LUSC slides. More recently, deep learning was used for the classi-
fication of breast, bladder and lung tumors, achieving an AUC of
0.83 in classification of lung tumor types on tumor slides from The
Cancer Genome Atlas (TCGA)13
. Analysis of plasma DNA values
was also shown to be a good predictor of the presence of non–small
cell cancer, with an AUC of ~0.94 (ref. 14
) in distinguishing LUAD
from LUSC, whereas the use of immunochemical markers yields an
AUC of ~0.94115
.
Here, we demonstrate how the field can further benefit from deep
learning by presenting a strategy based on convolutional neural
networks (CNNs) that not only outperforms methods in previously
Classification and mutation prediction from
non–small cell lung cancer histopathology
images using deep learning
Nicolas Coudray 1,2,9
, Paolo Santiago Ocampo3,9
, Theodore Sakellaropoulos4
, Navneet Narula3
,
Matija Snuderl3
, David Fenyö5,6
, Andre L. Moreira3,7
, Narges Razavian 8
* and Aristotelis Tsirigos 1,3
*
Visual inspection of histopathology slides is one of the main methods used by pathologists to assess the stage, type and sub-
type of lung tumors. Adenocarcinoma (LUAD) and squamous cell carcinoma (LUSC) are the most prevalent subtypes of lung
cancer, and their distinction requires visual inspection by an experienced pathologist. In this study, we trained a deep con-
volutional neural network (inception v3) on whole-slide images obtained from The Cancer Genome Atlas to accurately and
automatically classify them into LUAD, LUSC or normal lung tissue. The performance of our method is comparable to that of
pathologists, with an average area under the curve (AUC) of 0.97. Our model was validated on independent datasets of frozen
tissues, formalin-fixed paraffin-embedded tissues and biopsies. Furthermore, we trained the network to predict the ten most
commonly mutated genes in LUAD. We found that six of them—STK11, EGFR, FAT1, SETBP1, KRAS and TP53—can be pre-
dicted from pathology images, with AUCs from 0.733 to 0.856 as measured on a held-out population. These findings suggest
that deep-learning models can assist pathologists in the detection of cancer subtype or gene mutations. Our approach can be
applied to any cancer type, and the code is available at https://github.com/ncoudray/DeepPATH.
NATURE MEDICINE | www.nature.com/naturemedicine
병리과병리과병리과병리과병리과병리과병리과
ARTICLES
https://doi.org/10.1038/s41551-018-0301-3
1
Sichuan Academy of Medical Sciences & Sichuan Provincial People’s Hospital, Chengdu, China. 2
Shanghai Wision AI Co., Ltd, Shanghai, China. 3
Beth Israel
Deaconess Medical Center and Harvard Medical School, Center for Advanced Endoscopy, Boston , MA, USA. *e-mail: gary.samsph@gmail.com
C
olonoscopy is the gold-standard screening test for colorectal
cancer1–3
, one of the leading causes of cancer death in both the
United States4,5
and China6
. Colonoscopy can reduce the risk
of death from colorectal cancer through the detection of tumours
at an earlier, more treatable stage as well as through the removal of
precancerous adenomas3,7
. Conversely, failure to detect adenomas
may lead to the development of interval cancer. Evidence has shown
that each 1.0% increase in adenoma detection rate (ADR) leads to a
3.0% decrease in the risk of interval colorectal cancer8
.
Although more than 14million colonoscopies are performed
in the United States annually2
, the adenoma miss rate (AMR) is
estimated to be 6–27%9
. Certain polyps may be missed more fre-
quently, including smaller polyps10,11
, flat polyps12
and polyps in the
left colon13
. There are two independent reasons why a polyp may
be missed during colonoscopy: (i) it was never in the visual field or
(ii) it was in the visual field but not recognized. Several hardware
innovations have sought to address the first problem by improv-
ing visualization of the colonic lumen, for instance by providing a
larger, panoramic camera view, or by flattening colonic folds using a
distal-cap attachment. The problem of unrecognized polyps within
the visual field has been more difficult to address14
. Several studies
have shown that observation of the video monitor by either nurses
or gastroenterology trainees may increase polyp detection by up
to 30%15–17
. Ideally, a real-time automatic polyp-detection system
could serve as a similarly effective second observer that could draw
the endoscopist’s eye, in real time, to concerning lesions, effec-
tively creating an ‘extra set of eyes’ on all aspects of the video data
with fidelity. Although automatic polyp detection in colonoscopy
videos has been an active research topic for the past 20 years, per-
formance levels close to that of the expert endoscopist18–20
have not
been achieved. Early work in automatic polyp detection has focused
on applying deep-learning techniques to polyp detection, but most
published works are small in scale, with small development and/or
training validation sets19,20
.
Here, we report the development and validation of a deep-learn-
ing algorithm, integrated with a multi-threaded processing system,
for the automatic detection of polyps during colonoscopy. We vali-
dated the system in two image studies and two video studies. Each
study contained two independent validation datasets.
Results
We developed a deep-learning algorithm using 5,545colonoscopy
images from colonoscopy reports of 1,290patients that underwent
a colonoscopy examination in the Endoscopy Center of Sichuan
Provincial People’s Hospital between January 2007 and December
2015. Out of the 5,545images used, 3,634images contained polyps
(65.54%) and 1,911 images did not contain polyps (34.46%). For
algorithm training, experienced endoscopists annotated the pres-
ence of each polyp in all of the images in the development data-
set. We validated the algorithm on four independent datasets.
DatasetsA and B were used for image analysis, and datasetsC and D
were used for video analysis.
DatasetA contained 27,113colonoscopy images from colo-
noscopy reports of 1,138consecutive patients who underwent a
colonoscopy examination in the Endoscopy Center of Sichuan
Provincial People’s Hospital between January and December 2016
and who were found to have at least one polyp. Out of the 27,113
images, 5,541images contained polyps (20.44%) and 21,572images
did not contain polyps (79.56%). All polyps were confirmed histo-
logically after biopsy. DatasetB is a public database (CVC-ClinicDB;
Development and validation of a deep-learning
algorithm for the detection of polyps during
colonoscopy
Pu Wang1
, Xiao Xiao2
, Jeremy R. Glissen Brown3
, Tyler M. Berzin 3
, Mengtian Tu1
, Fei Xiong1
,
Xiao Hu1
, Peixi Liu1
, Yan Song1
, Di Zhang1
, Xue Yang1
, Liangping Li1
, Jiong He2
, Xin Yi2
, Jingjia Liu2
and
Xiaogang Liu 1
*
The detection and removal of precancerous polyps via colonoscopy is the gold standard for the prevention of colon cancer.
However, the detection rate of adenomatous polyps can vary significantly among endoscopists. Here, we show that a machine-
learningalgorithmcandetectpolypsinclinicalcolonoscopies,inrealtimeandwithhighsensitivityandspecificity.Wedeveloped
the deep-learning algorithm by using data from 1,290 patients, and validated it on newly collected 27,113 colonoscopy images
from 1,138 patients with at least one detected polyp (per-image-sensitivity, 94.38%; per-image-specificity, 95.92%; area under
the receiver operating characteristic curve, 0.984), on a public database of 612 polyp-containing images (per-image-sensitiv-
ity, 88.24%), on 138 colonoscopy videos with histologically confirmed polyps (per-image-sensitivity of 91.64%; per-polyp-sen-
sitivity, 100%), and on 54 unaltered full-range colonoscopy videos without polyps (per-image-specificity, 95.40%). By using a
multi-threaded processing system, the algorithm can process at least 25 frames per second with a latency of 76.80±5.60ms
in real-time video analysis. The software may aid endoscopists while performing colonoscopies, and help assess differences in
polyp and adenoma detection performance among endoscopists.
NATURE BIOMEDICA L ENGINEERING | VOL 2 | OCTOBER 2018 | 741–748 | www.nature.com/natbiomedeng 741
소화기내과
1Wang P, et al. Gut 2019;0:1–7. doi:10.1136/gutjnl-2018-317500
Endoscopy
ORIGINAL ARTICLE
Real-time automatic detection system increases
colonoscopic polyp and adenoma detection rates: a
prospective randomised controlled study
Pu Wang, 1
Tyler M Berzin, 2
Jeremy Romek Glissen Brown, 2
Shishira Bharadwaj,2
Aymeric Becq,2
Xun Xiao,1
Peixi Liu,1
Liangping Li,1
Yan Song,1
Di Zhang,1
Yi Li,1
Guangre Xu,1
Mengtian Tu,1
Xiaogang Liu 1
To cite: Wang P, Berzin TM,
Glissen Brown JR, et al. Gut
Epub ahead of print: [please
include Day Month Year].
doi:10.1136/
gutjnl-2018-317500
► Additional material is
published online only.To view
please visit the journal online
(http://dx.doi.org/10.1136/
gutjnl-2018-317500).
1
Department of
Gastroenterology, Sichuan
Academy of Medical Sciences
& Sichuan Provincial People’s
Hospital, Chengdu, China
2
Center for Advanced
Endoscopy, Beth Israel
Deaconess Medical Center and
Harvard Medical School, Boston,
Massachusetts, USA
Correspondence to
Xiaogang Liu, Department
of Gastroenterology Sichuan
Academy of Medical Sciences
and Sichuan Provincial People’s
Hospital, Chengdu, China;
Gary.samsph@gmail.com
Received 30 August 2018
Revised 4 February 2019
Accepted 13 February 2019
© Author(s) (or their
employer(s)) 2019. Re-use
permitted under CC BY-NC. No
commercial re-use. See rights
and permissions. Published
by BMJ.
ABSTRACT
Objective The effect of colonoscopy on colorectal
cancer mortality is limited by several factors, among them
a certain miss rate, leading to limited adenoma detection
rates (ADRs).We investigated the effect of an automatic
polyp detection system based on deep learning on polyp
detection rate and ADR.
Design In an open, non-blinded trial, consecutive
patients were prospectively randomised to undergo
diagnostic colonoscopy with or without assistance of a
real-time automatic polyp detection system providing
a simultaneous visual notice and sound alarm on polyp
detection.The primary outcome was ADR.
Results Of 1058 patients included, 536 were
randomised to standard colonoscopy, and 522 were
randomised to colonoscopy with computer-aided
diagnosis.The artificial intelligence (AI) system
significantly increased ADR (29.1%vs20.3%, p<0.001)
and the mean number of adenomas per patient
(0.53vs0.31, p<0.001).This was due to a higher number
of diminutive adenomas found (185vs102; p<0.001),
while there was no statistical difference in larger
adenomas (77vs58, p=0.075). In addition, the number
of hyperplastic polyps was also significantly increased
(114vs52, p<0.001).
Conclusions In a low prevalent ADR population, an
automatic polyp detection system during colonoscopy
resulted in a significant increase in the number of
diminutive adenomas detected, as well as an increase in
the rate of hyperplastic polyps.The cost–benefit ratio of
such effects has to be determined further.
Trial registration number ChiCTR-DDD-17012221;
Results.
INTRODUCTION
Colorectal cancer (CRC) is the second and third-
leading causes of cancer-related deaths in men and
women respectively.1
Colonoscopy is the gold stan-
dard for screening CRC.2 3
Screening colonoscopy
has allowed for a reduction in the incidence and
mortality of CRC via the detection and removal
of adenomatous polyps.4–8
Additionally, there is
evidence that with each 1.0% increase in adenoma
detection rate (ADR), there is an associated 3.0%
decrease in the risk of interval CRC.9 10
However,
polyps can be missed, with reported miss rates of
up to 27% due to both polyp and operator charac-
teristics.11 12
Unrecognised polyps within the visual field is
an important problem to address.11
Several studies
have shown that assistance by a second observer
increases the polyp detection rate (PDR), but such a
strategy remains controversial in terms of increasing
the ADR.13–15
Ideally, a real-time automatic polyp detec-
tion system, with performance close to that of
expert endoscopists, could assist the endosco-
pist in detecting lesions that might correspond to
adenomas in a more consistent and reliable way
Significance of this study
What is already known on this subject?
► Colorectal adenoma detection rate (ADR)
is regarded as a main quality indicator of
(screening) colonoscopy and has been shown
to correlate with interval cancers. Reducing
adenoma miss rates by increasing ADR has
been a goal of many studies focused on
imaging techniques and mechanical methods.
► Artificial intelligence has been recently
introduced for polyp and adenoma detection
as well as differentiation and has shown
promising results in preliminary studies.
What are the new findings?
► This represents the first prospective randomised
controlled trial examining an automatic polyp
detection during colonoscopy and shows an
increase of ADR by 50%, from 20% to 30%.
► This effect was mainly due to a higher rate of
small adenomas found.
► The detection rate of hyperplastic polyps was
also significantly increased.
How might it impact on clinical practice in the
foreseeable future?
► Automatic polyp and adenoma detection could
be the future of diagnostic colonoscopy in order
to achieve stable high adenoma detection rates.
► However, the effect on ultimate outcome is
still unclear, and further improvements such as
polyp differentiation have to be implemented.
on17March2019byguest.Protectedbycopyright.http://gut.bmj.com/Gut:firstpublishedas10.1136/gutjnl-2018-317500on27February2019.Downloadedfrom
소화기내과
Downloadedfromhttps://journals.lww.com/ajspbyBhDMf5ePHKav1zEoum1tQfN4a+kJLhEZgbsIHo4XMi0hCywCX1AWnYQp/IlQrHD3MyLIZIvnCFZVJ56DGsD590P5lh5KqE20T/dBX3x9CoM=on10/14/2018
Downloadedfromhttps://journals.lww.com/ajspbyBhDMf5ePHKav1zEoum1tQfN4a+kJLhEZgbsIHo4XMi0hCywCX1AWnYQp/IlQrHD3MyLIZIvnCFZVJ56DGsD590P5lh5KqE20T/dBX3x9CoM=on10/14/2018
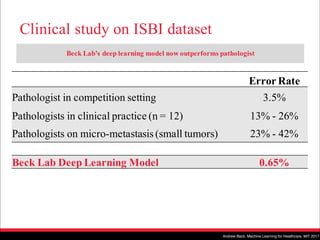
Impact of Deep Learning Assistance on the
Histopathologic Review of Lymph Nodes for Metastatic
Breast Cancer
David F. Steiner, MD, PhD,* Robert MacDonald, PhD,* Yun Liu, PhD,* Peter Truszkowski, MD,*
Jason D. Hipp, MD, PhD, FCAP,* Christopher Gammage, MS,* Florence Thng, MS,†
Lily Peng, MD, PhD,* and Martin C. Stumpe, PhD*
Abstract: Advances in the quality of whole-slide images have set the
stage for the clinical use of digital images in anatomic pathology.
Along with advances in computer image analysis, this raises the
possibility for computer-assisted diagnostics in pathology to improve
histopathologic interpretation and clinical care. To evaluate the
potential impact of digital assistance on interpretation of digitized
slides, we conducted a multireader multicase study utilizing our deep
learning algorithm for the detection of breast cancer metastasis in
lymph nodes. Six pathologists reviewed 70 digitized slides from lymph
node sections in 2 reader modes, unassisted and assisted, with a wash-
out period between sessions. In the assisted mode, the deep learning
algorithm was used to identify and outline regions with high like-
lihood of containing tumor. Algorithm-assisted pathologists demon-
strated higher accuracy than either the algorithm or the pathologist
alone. In particular, algorithm assistance significantly increased the
sensitivity of detection for micrometastases (91% vs. 83%, P=0.02).
In addition, average review time per image was significantly shorter
with assistance than without assistance for both micrometastases (61
vs. 116 s, P=0.002) and negative images (111 vs. 137 s, P=0.018).
Lastly, pathologists were asked to provide a numeric score regarding
the difficulty of each image classification. On the basis of this score,
pathologists considered the image review of micrometastases to be
significantly easier when interpreted with assistance (P=0.0005).
Utilizing a proof of concept assistant tool, this study demonstrates the
potential of a deep learning algorithm to improve pathologist accu-
racy and efficiency in a digital pathology workflow.
Key Words: artificial intelligence, machine learning, digital pathology,
breast cancer, computer aided detection
(Am J Surg Pathol 2018;00:000–000)
The regulatory approval and gradual implementation of
whole-slide scanners has enabled the digitization of glass
slides for remote consults and archival purposes.1 Digitiza-
tion alone, however, does not necessarily improve the con-
sistency or efficiency of a pathologist’s primary workflow. In
fact, image review on a digital medium can be slightly
slower than on glass, especially for pathologists with limited
digital pathology experience.2 However, digital pathology
and image analysis tools have already demonstrated po-
tential benefits, including the potential to reduce inter-reader
variability in the evaluation of breast cancer HER2 status.3,4
Digitization also opens the door for assistive tools based on
Artificial Intelligence (AI) to improve efficiency and con-
sistency, decrease fatigue, and increase accuracy.5
Among AI technologies, deep learning has demon-
strated strong performance in many automated image-rec-
ognition applications.6–8 Recently, several deep learning–
based algorithms have been developed for the detection of
breast cancer metastases in lymph nodes as well as for other
applications in pathology.9,10 Initial findings suggest that
some algorithms can even exceed a pathologist’s sensitivity
for detecting individual cancer foci in digital images. How-
ever, this sensitivity gain comes at the cost of increased false
positives, potentially limiting the utility of such algorithms for
automated clinical use.11 In addition, deep learning algo-
rithms are inherently limited to the task for which they have
been specifically trained. While we have begun to understand
the strengths of these algorithms (such as exhaustive search)
and their weaknesses (sensitivity to poor optical focus, tumor
mimics; manuscript under review), the potential clinical util-
ity of such algorithms has not been thoroughly examined.
While an accurate algorithm alone will not necessarily aid
pathologists or improve clinical interpretation, these benefits
may be achieved through thoughtful and appropriate in-
tegration of algorithm predictions into the clinical workflow.8
From the *Google AI Healthcare; and †Verily Life Sciences, Mountain
View, CA.
D.F.S., R.M., and Y.L. are co-first authors (equal contribution).
Work done as part of the Google Brain Healthcare Technology Fellowship
(D.F.S. and P.T.).
Conflicts of Interest and Source of Funding: D.F.S., R.M., Y.L., P.T.,
J.D.H., C.G., F.T., L.P., M.C.S. are employees of Alphabet and have
Alphabet stock.
Correspondence: David F. Steiner, MD, PhD, Google AI Healthcare,
1600 Amphitheatre Way, Mountain View, CA 94043
(e-mail: davesteiner@google.com).
Supplemental Digital Content is available for this article. Direct URL citations
appear in the printed text and are provided in the HTML and PDF
versions of this article on the journal’s website, www.ajsp.com.
Copyright © 2018 The Author(s). Published by Wolters Kluwer Health,
Inc. This is an open-access article distributed under the terms of the
Creative Commons Attribution-Non Commercial-No Derivatives
License 4.0 (CCBY-NC-ND), where it is permissible to download and
share the work provided it is properly cited. The work cannot be
changed in any way or used commercially without permission from
the journal.
ORIGINAL ARTICLE
Am J Surg Pathol Volume 00, Number 00, ’’ 2018 www.ajsp.com | 1
병리과
S E P S I S
A targeted real-time early warning score (TREWScore)
for septic shock
Katharine E. Henry,1
David N. Hager,2
Peter J. Pronovost,3,4,5
Suchi Saria1,3,5,6
*
Sepsis is a leading cause of death in the United States, with mortality highest among patients who develop septic
shock. Early aggressive treatment decreases morbidity and mortality. Although automated screening tools can detect
patients currently experiencing severe sepsis and septic shock, none predict those at greatest risk of developing
shock. We analyzed routinely available physiological and laboratory data from intensive care unit patients and devel-
oped “TREWScore,” a targeted real-time early warning score that predicts which patients will develop septic shock.
TREWScore identified patients before the onset of septic shock with an area under the ROC (receiver operating
characteristic) curve (AUC) of 0.83 [95% confidence interval (CI), 0.81 to 0.85]. At a specificity of 0.67, TREWScore
achieved a sensitivity of 0.85 and identified patients a median of 28.2 [interquartile range (IQR), 10.6 to 94.2] hours
before onset. Of those identified, two-thirds were identified before any sepsis-related organ dysfunction. In compar-
ison, the Modified Early Warning Score, which has been used clinically for septic shock prediction, achieved a lower
AUC of 0.73 (95% CI, 0.71 to 0.76). A routine screening protocol based on the presence of two of the systemic inflam-
matory response syndrome criteria, suspicion of infection, and either hypotension or hyperlactatemia achieved a low-
er sensitivity of 0.74 at a comparable specificity of 0.64. Continuous sampling of data from the electronic health
records and calculation of TREWScore may allow clinicians to identify patients at risk for septic shock and provide
earlier interventions that would prevent or mitigate the associated morbidity and mortality.
INTRODUCTION
Seven hundred fifty thousand patients develop severe sepsis and septic
shock in the United States each year. More than half of them are
admitted to an intensive care unit (ICU), accounting for 10% of all
ICU admissions, 20 to 30% of hospital deaths, and $15.4 billion in an-
nual health care costs (1–3). Several studies have demonstrated that
morbidity, mortality, and length of stay are decreased when severe sep-
sis and septic shock are identified and treated early (4–8). In particular,
one study showed that mortality from septic shock increased by 7.6%
with every hour that treatment was delayed after the onset of hypo-
tension (9).
More recent studies comparing protocolized care, usual care, and
early goal-directed therapy (EGDT) for patients with septic shock sug-
gest that usual care is as effective as EGDT (10–12). Some have inter-
preted this to mean that usual care has improved over time and reflects
important aspects of EGDT, such as early antibiotics and early ag-
gressive fluid resuscitation (13). It is likely that continued early identi-
fication and treatment will further improve outcomes. However, the
best approach to managing patients at high risk of developing septic
shock before the onset of severe sepsis or shock has not been studied.
Methods that can identify ahead of time which patients will later expe-
rience septic shock are needed to further understand, study, and im-
prove outcomes in this population.
General-purpose illness severity scoring systems such as the Acute
Physiology and Chronic Health Evaluation (APACHE II), Simplified
Acute Physiology Score (SAPS II), SequentialOrgan Failure Assessment
(SOFA) scores, Modified Early Warning Score (MEWS), and Simple
Clinical Score (SCS) have been validated to assess illness severity and
risk of death among septic patients (14–17). Although these scores
are useful for predicting general deterioration or mortality, they typical-
ly cannot distinguish with high sensitivity and specificity which patients
are at highest risk of developing a specific acute condition.
The increased use of electronic health records (EHRs), which can be
queried in real time, has generated interest in automating tools that
identify patients at risk for septic shock (18–20). A number of “early
warning systems,” “track and trigger” initiatives, “listening applica-
tions,” and “sniffers” have been implemented to improve detection
andtimelinessof therapy forpatients with severe sepsis andseptic shock
(18, 20–23). Although these tools have been successful at detecting pa-
tients currently experiencing severe sepsis or septic shock, none predict
which patients are at highest risk of developing septic shock.
The adoption of the Affordable Care Act has added to the growing
excitement around predictive models derived from electronic health
data in a variety of applications (24), including discharge planning
(25), risk stratification (26, 27), and identification of acute adverse
events (28, 29). For septic shock in particular, promising work includes
that of predicting septic shock using high-fidelity physiological signals
collected directly from bedside monitors (30, 31), inferring relationships
between predictors of septic shock using Bayesian networks (32), and
using routine measurements for septic shock prediction (33–35). No
current prediction models that use only data routinely stored in the
EHR predict septic shock with high sensitivity and specificity many
hours before onset. Moreover, when learning predictive risk scores, cur-
rent methods (34, 36, 37) often have not accounted for the censoring
effects of clinical interventions on patient outcomes (38). For instance,
a patient with severe sepsis who received fluids and never developed
septic shock would be treated as a negative case, despite the possibility
that he or she might have developed septic shock in the absence of such
treatment and therefore could be considered a positive case up until the
1
Department of Computer Science, Johns Hopkins University, Baltimore, MD 21218, USA.
2
Division of Pulmonary and Critical Care Medicine, Department of Medicine, School of
Medicine, Johns Hopkins University, Baltimore, MD 21205, USA. 3
Armstrong Institute for
Patient Safety and Quality, Johns Hopkins University, Baltimore, MD 21202, USA. 4
Department
of Anesthesiology and Critical Care Medicine, School of Medicine, Johns Hopkins University,
Baltimore, MD 21202, USA. 5
Department of Health Policy and Management, Bloomberg
School of Public Health, Johns Hopkins University, Baltimore, MD 21205, USA. 6
Department
of Applied Math and Statistics, Johns Hopkins University, Baltimore, MD 21218, USA.
*Corresponding author. E-mail: ssaria@cs.jhu.edu
R E S E A R C H A R T I C L E
www.ScienceTranslationalMedicine.org 5 August 2015 Vol 7 Issue 299 299ra122 1
onNovember3,2016http://stm.sciencemag.org/Downloadedfrom
An Algorithm Based on Deep Learning for Predicting In-Hospital
Cardiac Arrest
Joon-myoung Kwon, MD;* Youngnam Lee, MS;* Yeha Lee, PhD; Seungwoo Lee, BS; Jinsik Park, MD, PhD
Background-—In-hospital cardiac arrest is a major burden to public health, which affects patient safety. Although traditional track-
and-trigger systems are used to predict cardiac arrest early, they have limitations, with low sensitivity and high false-alarm rates.
We propose a deep learning–based early warning system that shows higher performance than the existing track-and-trigger
systems.
Methods and Results-—This retrospective cohort study reviewed patients who were admitted to 2 hospitals from June 2010 to July
2017. A total of 52 131 patients were included. Specifically, a recurrent neural network was trained using data from June 2010 to
January 2017. The result was tested using the data from February to July 2017. The primary outcome was cardiac arrest, and the
secondary outcome was death without attempted resuscitation. As comparative measures, we used the area under the receiver
operating characteristic curve (AUROC), the area under the precision–recall curve (AUPRC), and the net reclassification index.
Furthermore, we evaluated sensitivity while varying the number of alarms. The deep learning–based early warning system (AUROC:
0.850; AUPRC: 0.044) significantly outperformed a modified early warning score (AUROC: 0.603; AUPRC: 0.003), a random forest
algorithm (AUROC: 0.780; AUPRC: 0.014), and logistic regression (AUROC: 0.613; AUPRC: 0.007). Furthermore, the deep learning–
based early warning system reduced the number of alarms by 82.2%, 13.5%, and 42.1% compared with the modified early warning
system, random forest, and logistic regression, respectively, at the same sensitivity.
Conclusions-—An algorithm based on deep learning had high sensitivity and a low false-alarm rate for detection of patients with
cardiac arrest in the multicenter study. (J Am Heart Assoc. 2018;7:e008678. DOI: 10.1161/JAHA.118.008678.)
Key Words: artificial intelligence • cardiac arrest • deep learning • machine learning • rapid response system • resuscitation
In-hospital cardiac arrest is a major burden to public health,
which affects patient safety.1–3
More than a half of cardiac
arrests result from respiratory failure or hypovolemic shock,
and 80% of patients with cardiac arrest show signs of
deterioration in the 8 hours before cardiac arrest.4–9
However,
209 000 in-hospital cardiac arrests occur in the United States
each year, and the survival discharge rate for patients with
cardiac arrest is 20% worldwide.10,11
Rapid response systems
(RRSs) have been introduced in many hospitals to detect
cardiac arrest using the track-and-trigger system (TTS).12,13
Two types of TTS are used in RRSs. For the single-parameter
TTS (SPTTS), cardiac arrest is predicted if any single vital sign
(eg, heart rate [HR], blood pressure) is out of the normal
range.14
The aggregated weighted TTS calculates a weighted
score for each vital sign and then finds patients with cardiac
arrest based on the sum of these scores.15
The modified early
warning score (MEWS) is one of the most widely used
approaches among all aggregated weighted TTSs (Table 1)16
;
however, traditional TTSs including MEWS have limitations, with
low sensitivity or high false-alarm rates.14,15,17
Sensitivity and
false-alarm rate interact: Increased sensitivity creates higher
false-alarm rates and vice versa.
Current RRSs suffer from low sensitivity or a high false-
alarm rate. An RRS was used for only 30% of patients before
unplanned intensive care unit admission and was not used for
22.8% of patients, even if they met the criteria.18,19
From the Departments of Emergency Medicine (J.-m.K.) and Cardiology (J.P.), Mediplex Sejong Hospital, Incheon, Korea; VUNO, Seoul, Korea (Youngnam L., Yeha L.,
S.L.).
*Dr Kwon and Mr Youngnam Lee contributed equally to this study.
Correspondence to: Joon-myoung Kwon, MD, Department of Emergency medicine, Mediplex Sejong Hospital, 20, Gyeyangmunhwa-ro, Gyeyang-gu, Incheon 21080,
Korea. E-mail: kwonjm@sejongh.co.kr
Received January 18, 2018; accepted May 31, 2018.
ª 2018 The Authors. Published on behalf of the American Heart Association, Inc., by Wiley. This is an open access article under the terms of the Creative Commons
Attribution-NonCommercial License, which permits use, distribution and reproduction in any medium, provided the original work is properly cited and is not used for
commercial purposes.
DOI: 10.1161/JAHA.118.008678 Journal of the American Heart Association 1
ORIGINAL RESEARCH
byguestonJune28,2018http://jaha.ahajournals.org/Downloadedfrom
감염내과 심장내과
BRIEF COMMUNICATION OPEN
Digital biomarkers of cognitive function
Paul Dagum1
To identify digital biomarkers associated with cognitive function, we analyzed human–computer interaction from 7 days of
smartphone use in 27 subjects (ages 18–34) who received a gold standard neuropsychological assessment. For several
neuropsychological constructs (working memory, memory, executive function, language, and intelligence), we found a family of
digital biomarkers that predicted test scores with high correlations (p 10−4
). These preliminary results suggest that passive
measures from smartphone use could be a continuous ecological surrogate for laboratory-based neuropsychological assessment.
npj Digital Medicine (2018)1:10 ; doi:10.1038/s41746-018-0018-4
INTRODUCTION
By comparison to the functional metrics available in other
disciplines, conventional measures of neuropsychiatric disorders
have several challenges. First, they are obtrusive, requiring a
subject to break from their normal routine, dedicating time and
often travel. Second, they are not ecological and require subjects
to perform a task outside of the context of everyday behavior.
Third, they are episodic and provide sparse snapshots of a patient
only at the time of the assessment. Lastly, they are poorly scalable,
taxing limited resources including space and trained staff.
In seeking objective and ecological measures of cognition, we
attempted to develop a method to measure memory and
executive function not in the laboratory but in the moment,
day-to-day. We used human–computer interaction on smart-
phones to identify digital biomarkers that were correlated with
neuropsychological performance.
RESULTS
In 2014, 27 participants (ages 27.1 ± 4.4 years, education
14.1 ± 2.3 years, M:F 8:19) volunteered for neuropsychological
assessment and a test of the smartphone app. Smartphone
human–computer interaction data from the 7 days following
the neuropsychological assessment showed a range of correla-
tions with the cognitive scores. Table 1 shows the correlation
between each neurocognitive test and the cross-validated
predictions of the supervised kernel PCA constructed from
the biomarkers for that test. Figure 1 shows each participant
test score and the digital biomarker prediction for (a) digits
backward, (b) symbol digit modality, (c) animal fluency,
(d) Wechsler Memory Scale-3rd Edition (WMS-III) logical
memory (delayed free recall), (e) brief visuospatial memory test
(delayed free recall), and (f) Wechsler Adult Intelligence Scale-
4th Edition (WAIS-IV) block design. Construct validity of the
predictions was determined using pattern matching that
computed a correlation of 0.87 with p 10−59
between the
covariance matrix of the predictions and the covariance matrix
of the tests.
Table 1. Fourteen neurocognitive assessments covering five cognitive
domains and dexterity were performed by a neuropsychologist.
Shown are the group mean and standard deviation, range of score,
and the correlation between each test and the cross-validated
prediction constructed from the digital biomarkers for that test
Cognitive predictions
Mean (SD) Range R (predicted),
p-value
Working memory
Digits forward 10.9 (2.7) 7–15 0.71 ± 0.10, 10−4
Digits backward 8.3 (2.7) 4–14 0.75 ± 0.08, 10−5
Executive function
Trail A 23.0 (7.6) 12–39 0.70 ± 0.10, 10−4
Trail B 53.3 (13.1) 37–88 0.82 ± 0.06, 10−6
Symbol digit modality 55.8 (7.7) 43–67 0.70 ± 0.10, 10−4
Language
Animal fluency 22.5 (3.8) 15–30 0.67 ± 0.11, 10−4
FAS phonemic fluency 42 (7.1) 27–52 0.63 ± 0.12, 10−3
Dexterity
Grooved pegboard test
(dominant hand)
62.7 (6.7) 51–75 0.73 ± 0.09, 10−4
Memory
California verbal learning test
(delayed free recall)
14.1 (1.9) 9–16 0.62 ± 0.12, 10−3
WMS-III logical memory
(delayed free recall)
29.4 (6.2) 18–42 0.81 ± 0.07, 10−6
Brief visuospatial memory test
(delayed free recall)
10.2 (1.8) 5–12 0.77 ± 0.08, 10−5
Intelligence scale
WAIS-IV block design 46.1(12.8) 12–61 0.83 ± 0.06, 10−6
WAIS-IV matrix reasoning 22.1(3.3) 12–26 0.80 ± 0.07, 10−6
WAIS-IV vocabulary 40.6(4.0) 31–50 0.67 ± 0.11, 10−4
Received: 5 October 2017 Revised: 3 February 2018 Accepted: 7 February 2018
1
Mindstrong Health, 248 Homer Street, Palo Alto, CA 94301, USA
Correspondence: Paul Dagum (paul@mindstronghealth.com)
www.nature.com/npjdigitalmed
정신의학과
P R E C I S I O N M E D I C I N E
Identification of type 2 diabetes subgroups through
topological analysis of patient similarity
Li Li,1
Wei-Yi Cheng,1
Benjamin S. Glicksberg,1
Omri Gottesman,2
Ronald Tamler,3
Rong Chen,1
Erwin P. Bottinger,2
Joel T. Dudley1,4
*
Type 2 diabetes (T2D) is a heterogeneous complex disease affecting more than 29 million Americans alone with a
rising prevalence trending toward steady increases in the coming decades. Thus, there is a pressing clinical need to
improve early prevention and clinical management of T2D and its complications. Clinicians have understood that
patients who carry the T2D diagnosis have a variety of phenotypes and susceptibilities to diabetes-related compli-
cations. We used a precision medicine approach to characterize the complexity of T2D patient populations based
on high-dimensional electronic medical records (EMRs) and genotype data from 11,210 individuals. We successfully
identified three distinct subgroups of T2D from topology-based patient-patient networks. Subtype 1 was character-
ized by T2D complications diabetic nephropathy and diabetic retinopathy; subtype 2 was enriched for cancer ma-
lignancy and cardiovascular diseases; and subtype 3 was associated most strongly with cardiovascular diseases,
neurological diseases, allergies, and HIV infections. We performed a genetic association analysis of the emergent
T2D subtypes to identify subtype-specific genetic markers and identified 1279, 1227, and 1338 single-nucleotide
polymorphisms (SNPs) that mapped to 425, 322, and 437 unique genes specific to subtypes 1, 2, and 3, respec-
tively. By assessing the human disease–SNP association for each subtype, the enriched phenotypes and
biological functions at the gene level for each subtype matched with the disease comorbidities and clinical dif-
ferences that we identified through EMRs. Our approach demonstrates the utility of applying the precision
medicine paradigm in T2D and the promise of extending the approach to the study of other complex, multi-
factorial diseases.
INTRODUCTION
Type 2 diabetes (T2D) is a complex, multifactorial disease that has
emerged as an increasing prevalent worldwide health concern asso-
ciated with high economic and physiological burdens. An estimated
29.1 million Americans (9.3% of the population) were estimated to
have some form of diabetes in 2012—up 13% from 2010—with T2D
representing up to 95% of all diagnosed cases (1, 2). Risk factors for
T2D include obesity, family history of diabetes, physical inactivity, eth-
nicity, and advanced age (1, 2). Diabetes and its complications now
rank among the leading causes of death in the United States (2). In fact,
diabetes is the leading cause of nontraumatic foot amputation, adult
blindness, and need for kidney dialysis, and multiplies risk for myo-
cardial infarction, peripheral artery disease, and cerebrovascular disease
(3–6). The total estimated direct medical cost attributable to diabetes in
the United States in 2012 was $176 billion, with an estimated $76 billion
attributable to hospital inpatient care alone. There is a great need to im-
prove understanding of T2D and its complex factors to facilitate pre-
vention, early detection, and improvements in clinical management.
A more precise characterization of T2D patient populations can en-
hance our understanding of T2D pathophysiology (7, 8). Current
clinical definitions classify diabetes into three major subtypes: type 1 dia-
betes (T1D), T2D, and maturity-onset diabetes of the young. Other sub-
types based on phenotype bridge the gap between T1D and T2D, for
example, latent autoimmune diabetes in adults (LADA) (7) and ketosis-
prone T2D. The current categories indicate that the traditional definition of
diabetes, especially T2D, might comprise additional subtypes with dis-
tinct clinical characteristics. A recent analysis of the longitudinal Whitehall
II cohort study demonstrated improved assessment of cardiovascular
risks when subgrouping T2D patients according to glucose concentration
criteria (9). Genetic association studies reveal that the genetic architec-
ture of T2D is profoundly complex (10–12). Identified T2D-associated
risk variants exhibit allelic heterogeneity and directional differentiation
among populations (13, 14). The apparent clinical and genetic com-
plexity and heterogeneity of T2D patient populations suggest that there
are opportunities to refine the current, predominantly symptom-based,
definition of T2D into additional subtypes (7).
Because etiological and pathophysiological differences exist among
T2D patients, we hypothesize that a data-driven analysis of a clinical
population could identify new T2D subtypes and factors. Here, we de-
velop a data-driven, topology-based approach to (i) map the complexity
of patient populations using clinical data from electronic medical re-
cords (EMRs) and (ii) identify new, emergent T2D patient subgroups
with subtype-specific clinical and genetic characteristics. We apply this
approachtoadatasetcomprisingmatchedEMRsandgenotypedatafrom
more than 11,000 individuals. Topological analysis of these data revealed
three distinct T2D subtypes that exhibited distinct patterns of clinical
characteristics and disease comorbidities. Further, we identified genetic
markers associated with each T2D subtype and performed gene- and
pathway-level analysis of subtype genetic associations. Biological and
phenotypic features enriched in the genetic analysis corroborated clinical
disparities observed among subgroups. Our findings suggest that data-
driven,topologicalanalysisofpatientco
내분비내과
LETTER
Derma o og - eve c a ca on o k n cancer
w h deep neura ne work
피부과
FOCUS LETTERS
W
W
W
W
W
Ca d o og s eve a hy hm a de ec on and
c ass ca on n ambu a o y e ec oca d og ams
us ng a deep neu a ne wo k
M m
M
FOCUS LETTERS
심장내과
D p a n ng nab obu a m n and on o
human b a o y a n v o a on
산부인과
O G NA A
W on o On o og nd b e n e e men
e ommend on g eemen w h n e pe
mu d p n umo bo d
종양내과
D m
m
B D m OHCA
m Kw MD K H MD M H M K m MD
M M K m MD M M L m MD M K H K m
MD D MD D MD D R K C
MD D B H O MD D
D m Em M M H
K
D C C C M H
K
T w
A D C D m
M C C M H
G m w G R K
Tw w
C A K H MD D C
D m M C C M
H K G m w G
R K T E m
m @ m m
A
A m O OHCA m
m m w w
T m
m DCA
M T w m K OHCA w
A
CCEPTED
M
A
N
U
SCRIPT
응급의학과](https://image.slidesharecdn.com/scl-190627093851/85/slide-134-320.jpg)


![This copy is for personal use only.
To order printed copies, contact reprints@rsna.org
This copy is for personal use only.
To order printed copies, contact reprints@rsna.org
ORIGINAL RESEARCH • THORACIC IMAGING
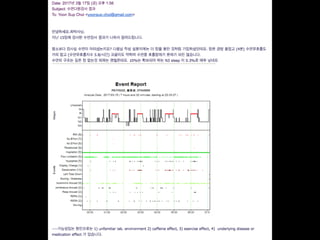
hest radiography, one of the most common diagnos- intraobserver agreements because of its limited spatial reso-
Development and Validation of Deep
Learning–based Automatic Detection
Algorithm for Malignant Pulmonary Nodules
on Chest Radiographs
Ju Gang Nam, MD* • Sunggyun Park, PhD* • Eui Jin Hwang, MD • Jong Hyuk Lee, MD • Kwang-Nam Jin, MD,
PhD • KunYoung Lim, MD, PhD • Thienkai HuyVu, MD, PhD • Jae Ho Sohn, MD • Sangheum Hwang, PhD • Jin
Mo Goo, MD, PhD • Chang Min Park, MD, PhD
From the Department of Radiology and Institute of Radiation Medicine, Seoul National University Hospital and College of Medicine, 101 Daehak-ro, Jongno-gu, Seoul
03080, Republic of Korea (J.G.N., E.J.H., J.M.G., C.M.P.); Lunit Incorporated, Seoul, Republic of Korea (S.P.); Department of Radiology, Armed Forces Seoul Hospital,
Seoul, Republic of Korea (J.H.L.); Department of Radiology, Seoul National University Boramae Medical Center, Seoul, Republic of Korea (K.N.J.); Department of
Radiology, National Cancer Center, Goyang, Republic of Korea (K.Y.L.); Department of Radiology and Biomedical Imaging, University of California, San Francisco,
San Francisco, Calif (T.H.V., J.H.S.); and Department of Industrial Information Systems Engineering, Seoul National University of Science and Technology, Seoul,
Republic of Korea (S.H.). Received January 30, 2018; revision requested March 20; revision received July 29; accepted August 6. Address correspondence to C.M.P.
(e-mail: cmpark.morphius@gmail.com).
Study supported by SNUH Research Fund and Lunit (06–2016–3000) and by Seoul Research and Business Development Program (FI170002).
*J.G.N. and S.P. contributed equally to this work.
Conflicts of interest are listed at the end of this article.
Radiology 2018; 00:1–11 • https://doi.org/10.1148/radiol.2018180237 • Content codes:
Purpose: To develop and validate a deep learning–based automatic detection algorithm (DLAD) for malignant pulmonary nodules
on chest radiographs and to compare its performance with physicians including thoracic radiologists.
Materials and Methods: For this retrospective study, DLAD was developed by using 43292 chest radiographs (normal radiograph–
to–nodule radiograph ratio, 34067:9225) in 34676 patients (healthy-to-nodule ratio, 30784:3892; 19230 men [mean age, 52.8
years; age range, 18–99 years]; 15446 women [mean age, 52.3 years; age range, 18–98 years]) obtained between 2010 and 2015,
which were labeled and partially annotated by 13 board-certified radiologists, in a convolutional neural network. Radiograph clas-
sification and nodule detection performances of DLAD were validated by using one internal and four external data sets from three
South Korean hospitals and one U.S. hospital. For internal and external validation, radiograph classification and nodule detection
performances of DLAD were evaluated by using the area under the receiver operating characteristic curve (AUROC) and jackknife
alternative free-response receiver-operating characteristic (JAFROC) figure of merit (FOM), respectively. An observer performance
test involving 18 physicians, including nine board-certified radiologists, was conducted by using one of the four external validation
data sets. Performances of DLAD, physicians, and physicians assisted with DLAD were evaluated and compared.
Results: According to one internal and four external validation data sets, radiograph classification and nodule detection perfor-
mances of DLAD were a range of 0.92–0.99 (AUROC) and 0.831–0.924 (JAFROC FOM), respectively. DLAD showed a higher
AUROC and JAFROC FOM at the observer performance test than 17 of 18 and 15 of 18 physicians, respectively (P , .05), and
all physicians showed improved nodule detection performances with DLAD (mean JAFROC FOM improvement, 0.043; range,
0.006–0.190; P , .05).
Conclusion: This deep learning–based automatic detection algorithm outperformed physicians in radiograph classification and nod-
ule detection performance for malignant pulmonary nodules on chest radiographs, and it enhanced physicians’ performances when
used as a second reader.
©RSNA, 2018
Online supplemental material is available for this article.
• 43,292 chest PA (normal:nodule=34,067:9225)
• labeled/annotated by 13 board-certified radiologists.
• DLAD were validated 1 internal + 4 external datasets
• 서울대병원 / 보라매병원 / 국립암센터 / UCSF
• Classification / Lesion localization
• 인공지능 vs. 의사 vs. 인공지능+의사
• 다양한 수준의 의사와 비교
• Non-radiology / radiology residents
• Board-certified radiologist / Thoracic radiologists](https://image.slidesharecdn.com/scl-190627093851/85/slide-152-320.jpg)


![Fig 1. What can consumer wearables do? Heart rate can be measured with an oximeter built into a ring [3], muscle activity with an electromyographi
sensor embedded into clothing [4], stress with an electodermal sensor incorporated into a wristband [5], and physical activity or sleep patterns via an
accelerometer in a watch [6,7]. In addition, a female’s most fertile period can be identified with detailed body temperature tracking [8], while levels of me
attention can be monitored with a small number of non-gelled electroencephalogram (EEG) electrodes [9]. Levels of social interaction (also known to a
PLOS Medicine 2016](https://image.slidesharecdn.com/scl-190627093851/85/slide-174-320.jpg)


![S E P S I S
A targeted real-time early warning score (TREWScore)
for septic shock
Katharine E. Henry,1
David N. Hager,2
Peter J. Pronovost,3,4,5
Suchi Saria1,3,5,6
*
Sepsis is a leading cause of death in the United States, with mortality highest among patients who develop septic
shock. Early aggressive treatment decreases morbidity and mortality. Although automated screening tools can detect
patients currently experiencing severe sepsis and septic shock, none predict those at greatest risk of developing
shock. We analyzed routinely available physiological and laboratory data from intensive care unit patients and devel-
oped “TREWScore,” a targeted real-time early warning score that predicts which patients will develop septic shock.
TREWScore identified patients before the onset of septic shock with an area under the ROC (receiver operating
characteristic) curve (AUC) of 0.83 [95% confidence interval (CI), 0.81 to 0.85]. At a specificity of 0.67, TREWScore
achieved a sensitivity of 0.85 and identified patients a median of 28.2 [interquartile range (IQR), 10.6 to 94.2] hours
before onset. Of those identified, two-thirds were identified before any sepsis-related organ dysfunction. In compar-
ison, the Modified Early Warning Score, which has been used clinically for septic shock prediction, achieved a lower
AUC of 0.73 (95% CI, 0.71 to 0.76). A routine screening protocol based on the presence of two of the systemic inflam-
matory response syndrome criteria, suspicion of infection, and either hypotension or hyperlactatemia achieved a low-
er sensitivity of 0.74 at a comparable specificity of 0.64. Continuous sampling of data from the electronic health
records and calculation of TREWScore may allow clinicians to identify patients at risk for septic shock and provide
earlier interventions that would prevent or mitigate the associated morbidity and mortality.
INTRODUCTION
Seven hundred fifty thousand patients develop severe sepsis and septic
shock in the United States each year. More than half of them are
admitted to an intensive care unit (ICU), accounting for 10% of all
ICU admissions, 20 to 30% of hospital deaths, and $15.4 billion in an-
nual health care costs (1–3). Several studies have demonstrated that
morbidity, mortality, and length of stay are decreased when severe sep-
sis and septic shock are identified and treated early (4–8). In particular,
one study showed that mortality from septic shock increased by 7.6%
with every hour that treatment was delayed after the onset of hypo-
tension (9).
More recent studies comparing protocolized care, usual care, and
early goal-directed therapy (EGDT) for patients with septic shock sug-
gest that usual care is as effective as EGDT (10–12). Some have inter-
preted this to mean that usual care has improved over time and reflects
important aspects of EGDT, such as early antibiotics and early ag-
gressive fluid resuscitation (13). It is likely that continued early identi-
fication and treatment will further improve outcomes. However, the
Acute Physiology Score (SAPS II), SequentialOrgan Failure Assessment
(SOFA) scores, Modified Early Warning Score (MEWS), and Simple
Clinical Score (SCS) have been validated to assess illness severity and
risk of death among septic patients (14–17). Although these scores
are useful for predicting general deterioration or mortality, they typical-
ly cannot distinguish with high sensitivity and specificity which patients
are at highest risk of developing a specific acute condition.
The increased use of electronic health records (EHRs), which can be
queried in real time, has generated interest in automating tools that
identify patients at risk for septic shock (18–20). A number of “early
warning systems,” “track and trigger” initiatives, “listening applica-
tions,” and “sniffers” have been implemented to improve detection
andtimelinessof therapy forpatients with severe sepsis andseptic shock
(18, 20–23). Although these tools have been successful at detecting pa-
tients currently experiencing severe sepsis or septic shock, none predict
which patients are at highest risk of developing septic shock.
The adoption of the Affordable Care Act has added to the growing
excitement around predictive models derived from electronic health
R E S E A R C H A R T I C L E
onNovember3,2016http://stm.sciencemag.org/Downloadedfrom](https://image.slidesharecdn.com/scl-190627093851/85/slide-177-320.jpg)
![puted as new data became avail
when his or her score crossed t
dation set, the AUC obtained f
0.81 to 0.85) (Fig. 2). At a spec
of 0.33], TREWScore achieved a s
a median of 28.2 hours (IQR, 10
Identification of patients b
A critical event in the developme
related organ dysfunction (seve
been shown to increase after th
more than two-thirds (68.8%) o
were identified before any sepsi
tients were identified a median
(Fig. 3B).
Comparison of TREWScore
Weevaluatedtheperformanceof
methods for the purpose of provid
use of TREWScore. We first com
to MEWS, a general metric used
of catastrophic deterioration (17
oped for tracking sepsis, MEWS
tion of patients at risk for severe
Fig. 2. ROC for detection of septic shock before onset in the validation
set. The ROC curve for TREWScore is shown in blue, with the ROC curve for
MEWS in red. The sensitivity and specificity performance of the routine
screening criteria is indicated by the purple dot. Normal 95% CIs are shown
for TREWScore and MEWS. TPR, true-positive rate; FPR, false-positive rate.
R E S E A R C H A R T I C L E
A targeted real-time early warning score (TREWScore)
for septic shock
AUC=0.83
At a specificity of 0.67, TREWScore achieved a sensitivity of 0.85
and identified patients a median of 28.2 hours before onset.](https://image.slidesharecdn.com/scl-190627093851/85/slide-178-320.jpg)


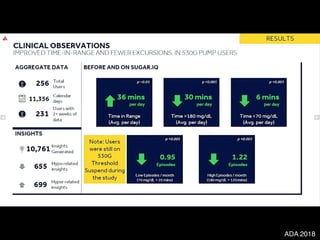


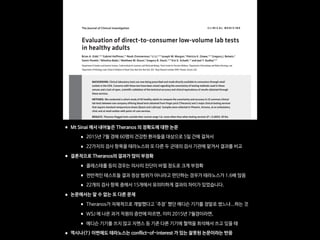


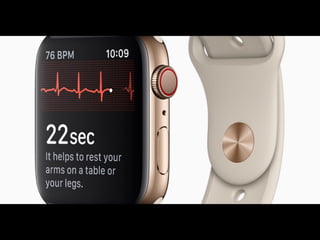


The document discusses the future of healthcare and digital healthcare. It introduces Professor Yoon Sup Choi, the director of the Digital Healthcare Institute at Sungkyunkwan University. It also discusses artificial intelligence in medicine and how AI is revolutionizing the traditionally conservative medical system. However, the fast development and wide influence of medical AI is difficult for modern medical experts to understand. The document provides case studies and insights into the current state and future of medical AI.
![[365mc] 디지털 헬스케어: 의료의 미래](https://cdn.slidesharecdn.com/ss_thumbnails/365mc-200317140059-thumbnail.jpg?width=640&height=640&fit=bounds)


![[메조미디어] 고객전환을 유도하는 리타겟팅 광고_2015.04](https://cdn.slidesharecdn.com/ss_thumbnails/2015-150413011452-conversion-gate01-thumbnail.jpg?width=640&height=640&fit=bounds)


![[C&C] 의료의 미래 디지털 헬스케어](https://cdn.slidesharecdn.com/ss_thumbnails/cc-200616080105-thumbnail.jpg?width=640&height=640&fit=bounds)


![[KNAPS] 포스트 코로나 시대, 제약 산업과 디지털 헬스케어](https://cdn.slidesharecdn.com/ss_thumbnails/knaps-210128022335-thumbnail.jpg?width=640&height=640&fit=bounds)


![[대한병리학회] 의료 인공지능 101: 병리를 중심으로](https://cdn.slidesharecdn.com/ss_thumbnails/pathology-201106004112-thumbnail.jpg?width=640&height=640&fit=bounds)

![[ASGO 2019] Artificial Intelligence in Medicine](https://cdn.slidesharecdn.com/ss_thumbnails/asgo2019medicalai191010-191010155811-thumbnail.jpg?width=640&height=640&fit=bounds)


