


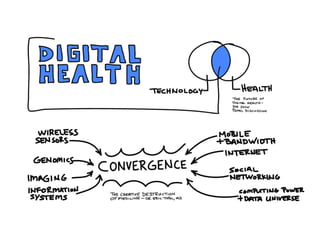


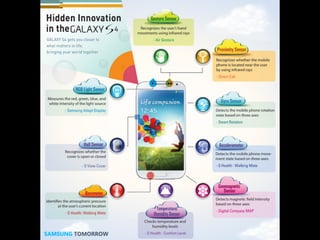


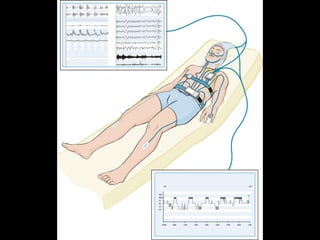


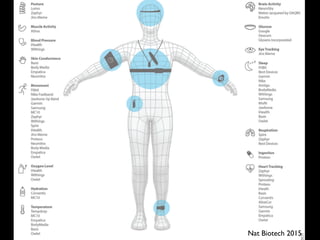
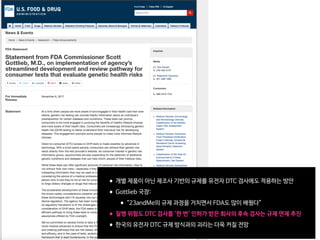
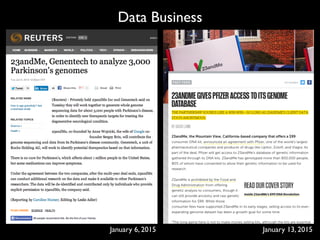
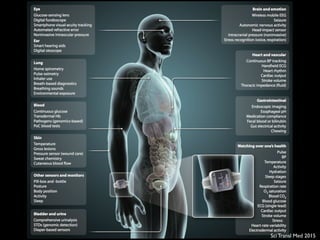
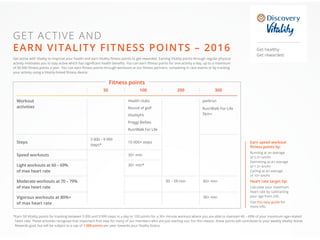
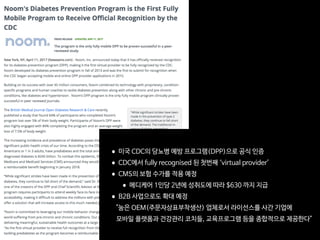
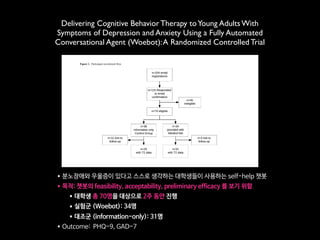
![Fig 1. What can consumer wearables do? Heart rate can be measured with an oximeter built into a ring [3], muscle activity with an electromyographi
sensor embedded into clothing [4], stress with an electodermal sensor incorporated into a wristband [5], and physical activity or sleep patterns via an
accelerometer in a watch [6,7]. In addition, a female’s most fertile period can be identified with detailed body temperature tracking [8], while levels of me
attention can be monitored with a small number of non-gelled electroencephalogram (EEG) electrodes [9]. Levels of social interaction (also known to a
PLOS Medicine 2016](https://image.slidesharecdn.com/digital-health-and-the-future-of-insurance2019-05-190530020936/85/2019-5-60-320.jpg)


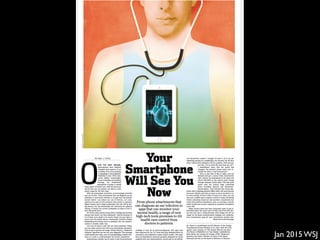
![ARTICLE OPEN
Scalable and accurate deep learning with electronic health
records
Alvin Rajkomar 1,2
, Eyal Oren1
, Kai Chen1
, Andrew M. Dai1
, Nissan Hajaj1
, Michaela Hardt1
, Peter J. Liu1
, Xiaobing Liu1
, Jake Marcus1
,
Mimi Sun1
, Patrik Sundberg1
, Hector Yee1
, Kun Zhang1
, Yi Zhang1
, Gerardo Flores1
, Gavin E. Duggan1
, Jamie Irvine1
, Quoc Le1
,
Kurt Litsch1
, Alexander Mossin1
, Justin Tansuwan1
, De Wang1
, James Wexler1
, Jimbo Wilson1
, Dana Ludwig2
, Samuel L. Volchenboum3
,
Katherine Chou1
, Michael Pearson1
, Srinivasan Madabushi1
, Nigam H. Shah4
, Atul J. Butte2
, Michael D. Howell1
, Claire Cui1
,
Greg S. Corrado1
and Jeffrey Dean1
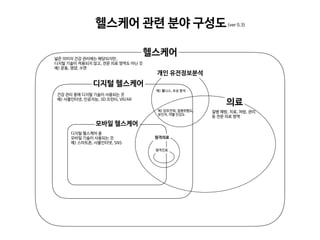
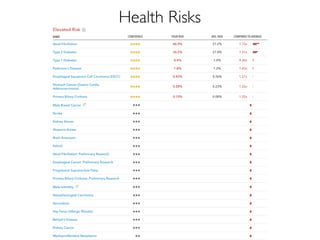
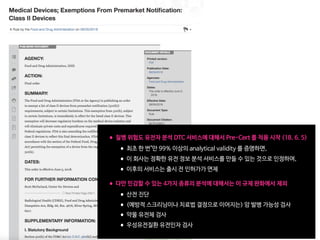
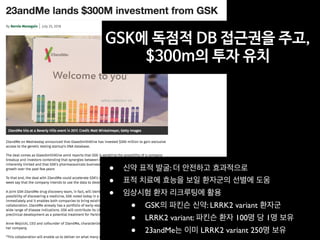
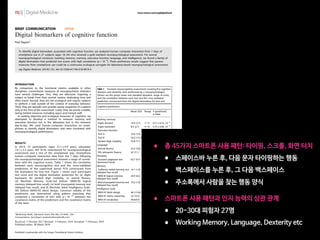
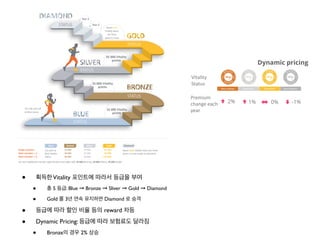
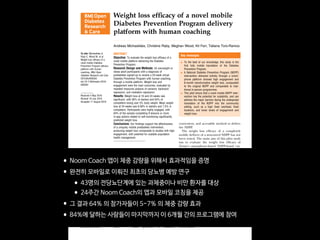
Predictive modeling with electronic health record (EHR) data is anticipated to drive personalized medicine and improve healthcare
quality. Constructing predictive statistical models typically requires extraction of curated predictor variables from normalized EHR
data, a labor-intensive process that discards the vast majority of information in each patient’s record. We propose a representation
of patients’ entire raw EHR records based on the Fast Healthcare Interoperability Resources (FHIR) format. We demonstrate that
deep learning methods using this representation are capable of accurately predicting multiple medical events from multiple
centers without site-specific data harmonization. We validated our approach using de-identified EHR data from two US academic
medical centers with 216,221 adult patients hospitalized for at least 24 h. In the sequential format we propose, this volume of EHR
data unrolled into a total of 46,864,534,945 data points, including clinical notes. Deep learning models achieved high accuracy for
tasks such as predicting: in-hospital mortality (area under the receiver operator curve [AUROC] across sites 0.93–0.94), 30-day
unplanned readmission (AUROC 0.75–0.76), prolonged length of stay (AUROC 0.85–0.86), and all of a patient’s final discharge
diagnoses (frequency-weighted AUROC 0.90). These models outperformed traditional, clinically-used predictive models in all cases.
We believe that this approach can be used to create accurate and scalable predictions for a variety of clinical scenarios. In a case
study of a particular prediction, we demonstrate that neural networks can be used to identify relevant information from the
patient’s chart.
npj Digital Medicine (2018)1:18 ; doi:10.1038/s41746-018-0029-1
INTRODUCTION
The promise of digital medicine stems in part from the hope that,
by digitizing health data, we might more easily leverage computer
information systems to understand and improve care. In fact,
routinely collected patient healthcare data are now approaching
the genomic scale in volume and complexity.1
Unfortunately,
most of this information is not yet used in the sorts of predictive
statistical models clinicians might use to improve care delivery. It
is widely suspected that use of such efforts, if successful, could
provide major benefits not only for patient safety and quality but
also in reducing healthcare costs.2–6
In spite of the richness and potential of available data, scaling
the development of predictive models is difficult because, for
traditional predictive modeling techniques, each outcome to be
predicted requires the creation of a custom dataset with specific
variables.7
It is widely held that 80% of the effort in an analytic
model is preprocessing, merging, customizing, and cleaning
datasets,8,9
not analyzing them for insights. This profoundly limits
the scalability of predictive models.
Another challenge is that the number of potential predictor
variables in the electronic health record (EHR) may easily number
in the thousands, particularly if free-text notes from doctors,
nurses, and other providers are included. Traditional modeling
approaches have dealt with this complexity simply by choosing a
very limited number of commonly collected variables to consider.7
This is problematic because the resulting models may produce
imprecise predictions: false-positive predictions can overwhelm
physicians, nurses, and other providers with false alarms and
concomitant alert fatigue,10
which the Joint Commission identified
as a national patient safety priority in 2014.11
False-negative
predictions can miss significant numbers of clinically important
events, leading to poor clinical outcomes.11,12
Incorporating the
entire EHR, including clinicians’ free-text notes, offers some hope
of overcoming these shortcomings but is unwieldy for most
predictive modeling techniques.
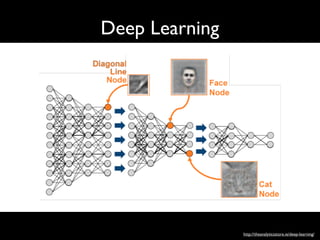
Recent developments in deep learning and artificial neural
networks may allow us to address many of these challenges and
unlock the information in the EHR. Deep learning emerged as the
preferred machine learning approach in machine perception
problems ranging from computer vision to speech recognition,
but has more recently proven useful in natural language
processing, sequence prediction, and mixed modality data
settings.13–17
These systems are known for their ability to handle
large volumes of relatively messy data, including errors in labels
Received: 26 January 2018 Revised: 14 March 2018 Accepted: 26 March 2018
1
Google Inc, Mountain View, CA, USA; 2
University of California, San Francisco, San Francisco, CA, USA; 3
University of Chicago Medicine, Chicago, IL, USA and 4
Stanford University,
Stanford, CA, USA
Correspondence: Alvin Rajkomar (alvinrajkomar@google.com)
These authors contributed equally: Alvin Rajkomar, Eyal Oren
www.nature.com/npjdigitalmed
Published in partnership with the Scripps Translational Science Institute
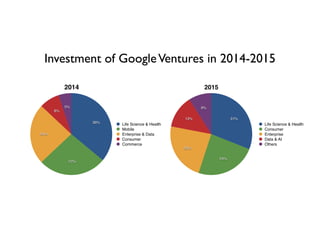
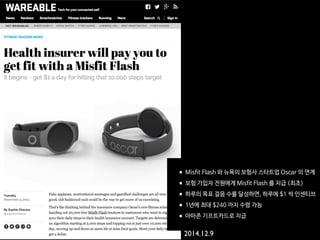
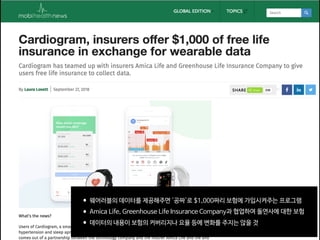
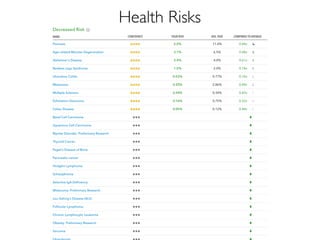
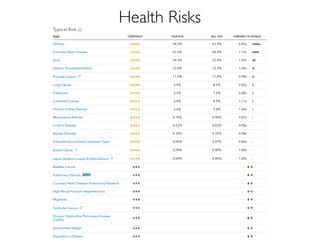
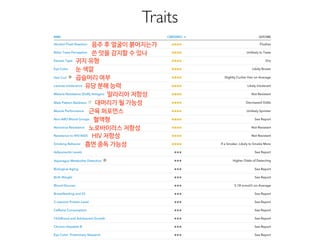
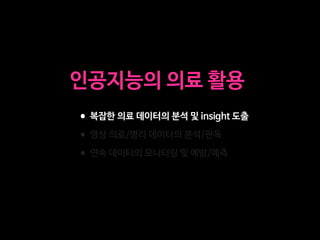
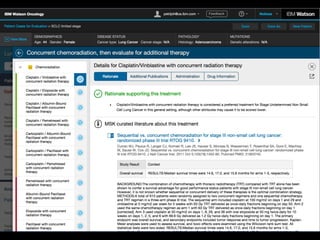
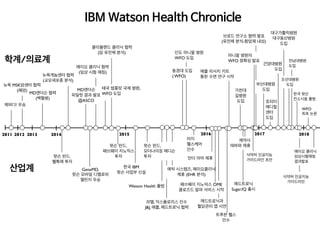
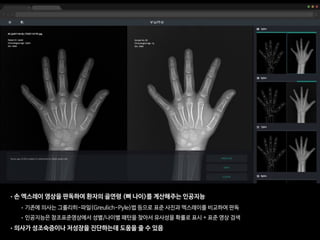
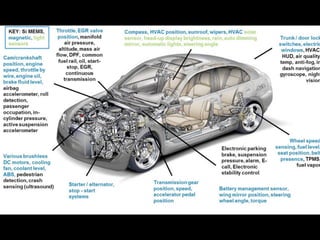
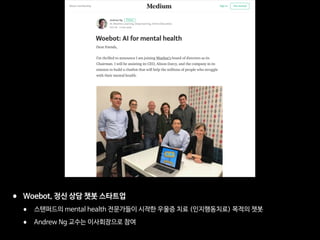
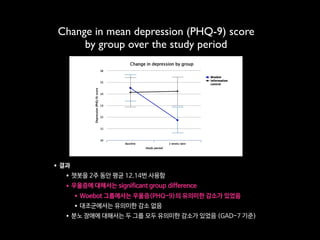
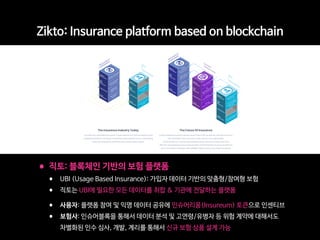
•2018년 1월 구글이 전자의무기록(EMR)을 분석하여, 환자 치료 결과를 예측하는 인공지능 발표
•환자가 입원 중에 사망할 것인지
•장기간 입원할 것인지
•퇴원 후에 30일 내에 재입원할 것인지
•퇴원 시의 진단명
•이번 연구의 특징: 확장성
•과거 다른 연구와 달리 EMR의 일부 데이터를 pre-processing 하지 않고,
•전체 EMR 를 통채로 모두 분석하였음: UCSF, UCM (시카고 대학병원)
•특히, 비정형 데이터인 의사의 진료 노트도 분석
Nat Digi Med 2018](https://image.slidesharecdn.com/digital-health-and-the-future-of-insurance2019-05-190530020936/85/2019-5-199-320.jpg)

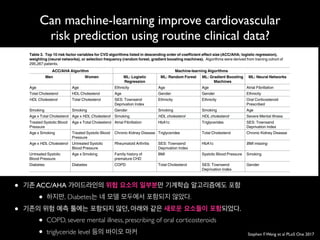
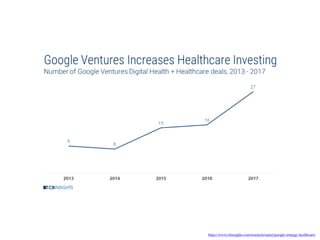
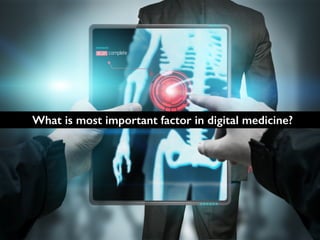
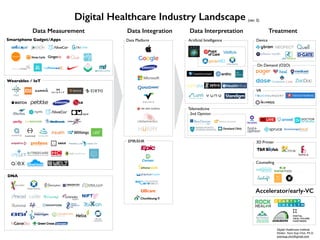
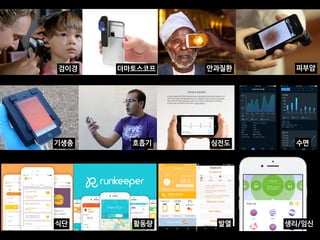
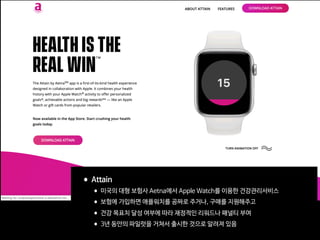
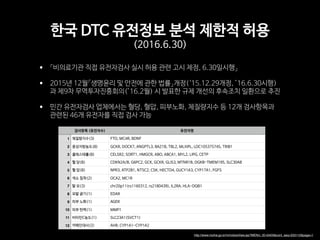
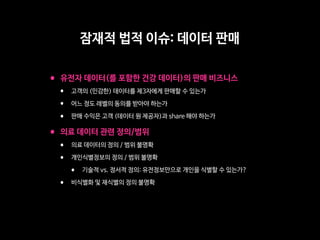
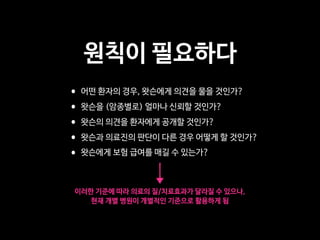
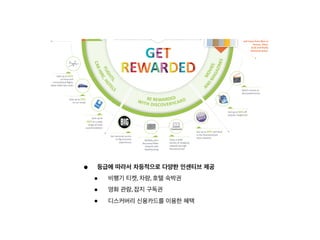
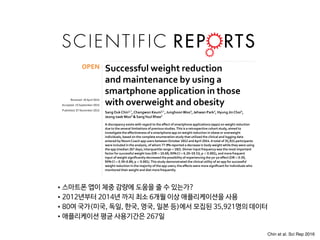
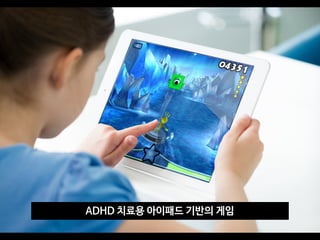
![Can machine-learning improve cardiovascular
risk prediction using routine clinical data?
Stephen F.Weng et al PLoS One 2017
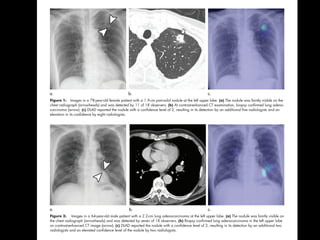
correctly predicted compared to the baseline ACC/AHA model ranged from 191 non-cases for
the random forest algorithm to 355 non-cases for the neural networks. Full details on classifi-
cation analysis can be found in S2 Table.
Discussion
Compared to an established AHA/ACC risk prediction algorithm, we found all machine-
learning algorithms tested were better at identifying individuals who will develop CVD and
those that will not. Unlike established approaches to risk prediction, the machine-learning
methods used were not limited to a small set of risk factors, and incorporated more pre-exist-
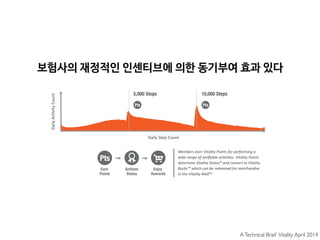
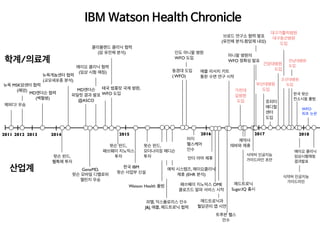
Table 4. Performance of the machine-learning (ML) algorithms predicting 10-year cardiovascular disease (CVD) risk derived from applying train-
ing algorithms on the validation cohort of 82,989 patients. Higher c-statistics results in better algorithm discrimination. The baseline (BL) ACC/AHA
10-year risk prediction algorithm is provided for comparative purposes.
Algorithms AUC c-statistic Standard Error* 95% Confidence
Interval
Absolute Change from Baseline
LCL UCL
BL: ACC/AHA 0.728 0.002 0.723 0.735 —
ML: Random Forest 0.745 0.003 0.739 0.750 +1.7%
ML: Logistic Regression 0.760 0.003 0.755 0.766 +3.2%
ML: Gradient Boosting Machines 0.761 0.002 0.755 0.766 +3.3%
ML: Neural Networks 0.764 0.002 0.759 0.769 +3.6%
*Standard error estimated by jack-knife procedure [30]
https://doi.org/10.1371/journal.pone.0174944.t004
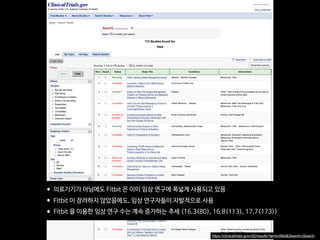
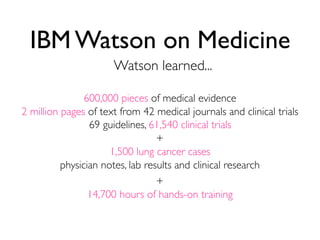
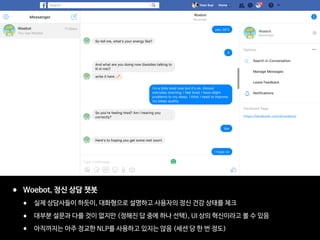
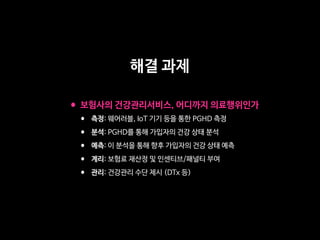
Can machine-learning improve cardiovascular risk prediction using routine clinical data?
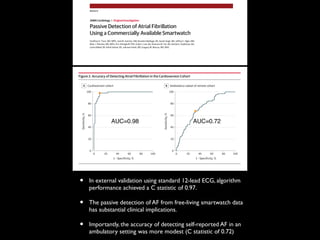
• 네 가지 기계학습 모델 모두 기존의 ACC/AHA 가이드라인 대비 더 정확했다.
• Neural Networks 이 AUC=0.764 로 가장 정확했다.
• “이 모델을 활용했더라면 355 명의 추가적인 cardiovascular event 를 예방했을 것”
• Deep Learning 을 활용하면 정확도는 더 높아질 수 있을 것
• Genetic information 등의 추가적인 risk factor 를 활용해볼 수 있다.](https://image.slidesharecdn.com/digital-health-and-the-future-of-insurance2019-05-190530020936/85/2019-5-203-320.jpg)


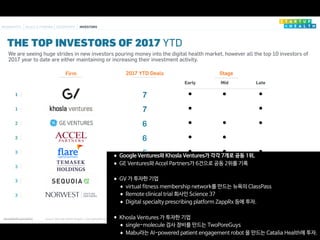
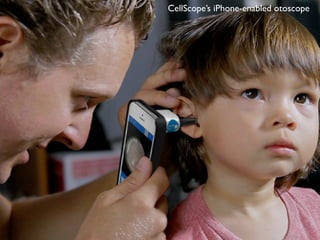
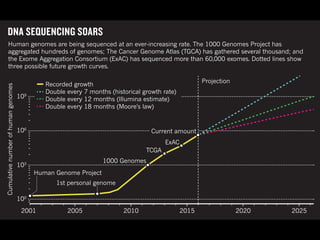
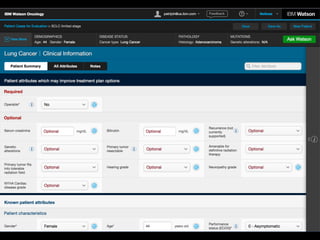
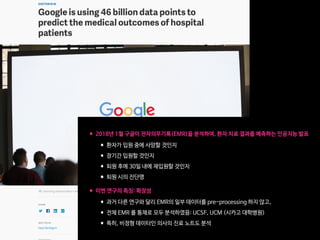
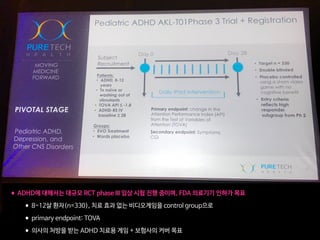
![Fig 1. What can consumer wearables do? Heart rate can be measured with an oximeter built into a ring [3], muscle activity with an electromyographi
sensor embedded into clothing [4], stress with an electodermal sensor incorporated into a wristband [5], and physical activity or sleep patterns via an
accelerometer in a watch [6,7]. In addition, a female’s most fertile period can be identified with detailed body temperature tracking [8], while levels of me
attention can be monitored with a small number of non-gelled electroencephalogram (EEG) electrodes [9]. Levels of social interaction (also known to a
PLOS Medicine 2016](https://image.slidesharecdn.com/digital-health-and-the-future-of-insurance2019-05-190530020936/85/2019-5-216-320.jpg)


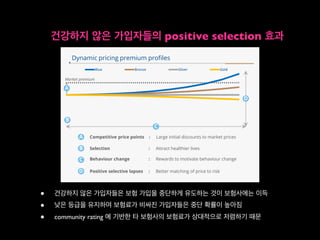


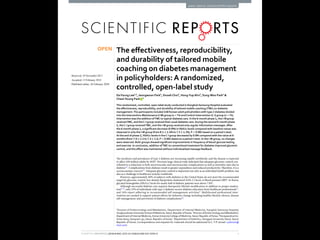
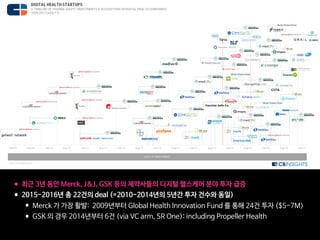
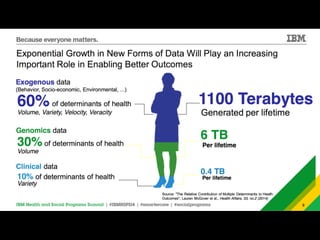
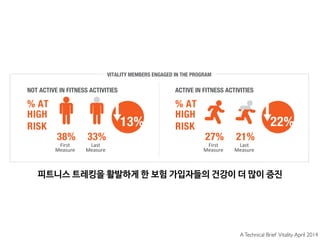
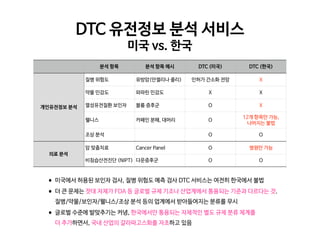
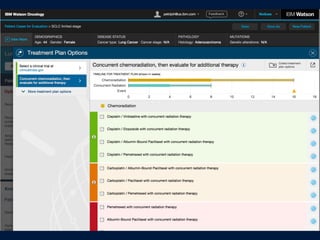
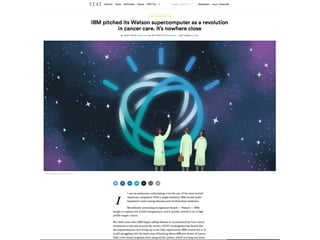
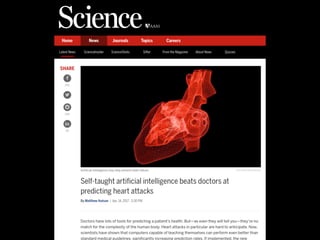
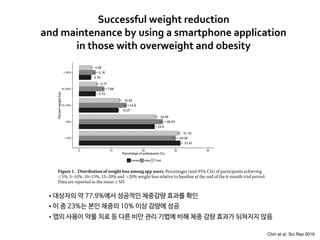
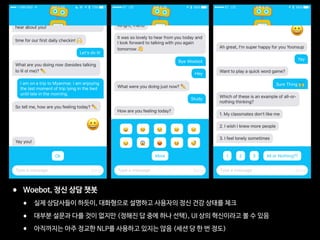
![The Effect of a Smartphone-Based,
Patient-Centered Diabetes Care
System in Patients With Type 2
Diabetes: A Randomized,
Controlled Trial for 24 Weeks
https://doi.org/10.2337/dc17-2197
OBJECTIVE
Thisstudyevaluatedtheefficacyofasmartphone-based,patient-centered diabetes
care system (mDiabetes) for type 2 diabetes that contains comprehensive modules
forglucosemonitoring,diet,physicalactivity,andaclinicaldecisionsupportsystem.
RESEARCH DESIGN AND METHODS
We conducted a 24-week, multicenter, randomized controlled trial with adult
patients with inadequately controlled type 2 diabetes. The patients were randomly
assigned to the mDiabetes group or the paper logbook (pLogbook) group. The
primary end point was the difference of the change in HbA1c from baseline between
the two groups.
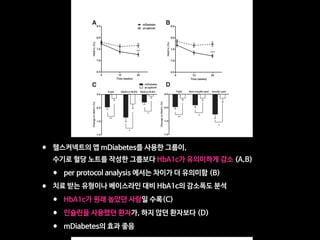
RESULTS
HbA1c reductionfrombaselinewasgreaterinthemDiabetesgroup(20.4060.09%,
n = 90) than in the pLogbook group (20.06 6 0.10%, n = 82). The difference of
adjusted mean changes was 0.35% (95% CI 0.14–0.55, P = 0.001). The proportion
of patients whose HbA1c fell below 7.0% (53 mmol/mol) was 41.1% for the mDia-
betes group and 20.7% for the pLogbook group (odds ratio [OR] 2.01, 95% CI 1.24–
3.25, P = 0.003). The percentage of patients who attained HbA1c levels below 7.0%
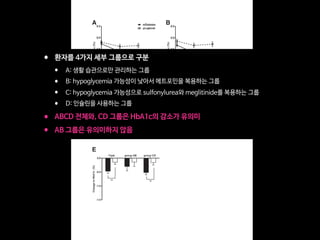
(53 mmol/mol) without hypoglycemia was 31.1% in the mDiabetes group and
17.1% in the pLogbook group (OR 1.82, 95% CI 1.03–3.21, P = 0.024). There was no
difference in the event numbers of severe hyperglycemia and hypoglycemia be-
tween the two groups.
CONCLUSIONS
The implementation of the mDiabetes for patients with inadequately controlled
type 2 diabetes resulted in a significant reduction in HbA1c levels, with tolerable
safety profiles.
Diabetes is a chronic disease requiring lifelong management with lifestyle modifi-
cation, medication, or both; therefore, diabetes self-management education and
adherence to the treatment plans are considered key components in the manage-
ment of diabetes (1). As information technology (IT) advances, medical services us-
ing IT devices, such as mobile health care (mHealth) systems, have been developed
to aid chronic disease management. Currently, ;259,000 mHealth applications are
1
International Healthcare Center, Seoul National
University Hospital, Seoul, Korea
2
Department of Internal Medicine, Seoul Na-
tional University College of Medicine, Seoul,
Korea
3
Department of Internal Medicine, Boramae
Medical Center, Seoul, Korea
4
Department of Internal Medicine, Seoul Na-
tional University Bundang Hospital, Seongnam,
Korea
Correspondingauthor:YoungMinCho,ymchomd@
snu.ac.kr.
Received 19 October 2017 and accepted 1
October 2019.
Clinical trial reg. no. NCT02451631, clinicaltrials
.gov.
This article contains Supplementary Data online
at http://care.diabetesjournals.org/lookup/suppl/
doi:10.2337/dc17-2197/-/DC1.
© 2018 by the American Diabetes Association.
Readers may use this article as long as the work
is properly cited, the use is educational and not
for profit, and the work is not altered. More infor-
mation is available at http://www.diabetesjournals
.org/content/license.
Eun Ky Kim,1,2
Soo Heon Kwak,2
Hye Seung Jung,2
Bo Kyung Koo,2,3
Min Kyong Moon,2,3
Soo Lim,2,4
Hak Chul Jang,2,4
Kyong Soo Park,2
and
Young Min Cho2
Diabetes Care 1
CLINCARE/EDUCATION/NUTRITION/PSYCHOSOCIAL
Diabetes Care Publish Ahead of Print, published online October 30, 2018
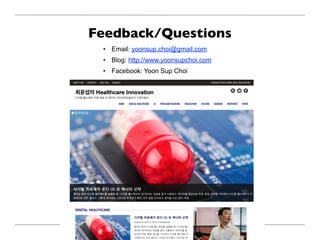
• 헬스커넥트의 당뇨 관리 앱이 2형 당뇨의 관리에 효과가 있음을 증명
• 총 환자 172명 (실험군: 대조군=90:82), 24주, multi-center, RCT](https://image.slidesharecdn.com/digital-health-and-the-future-of-insurance2019-05-190530020936/85/2019-5-250-320.jpg)


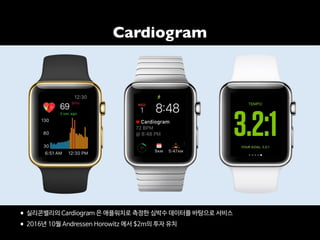
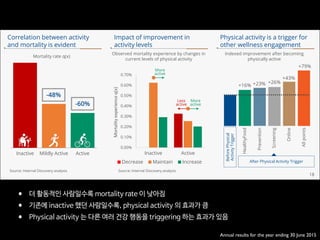
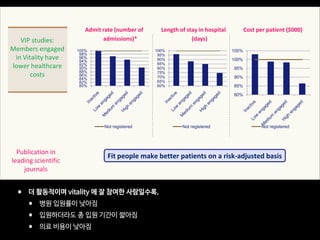
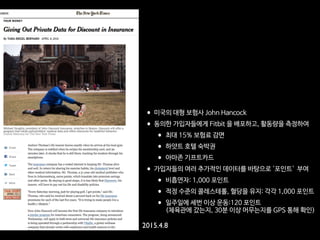
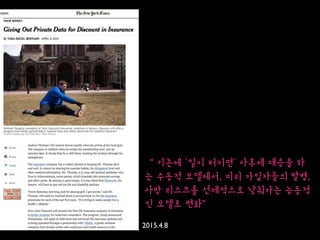
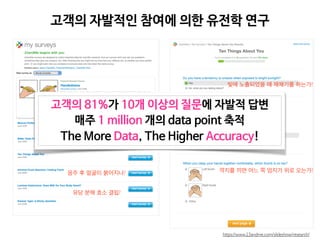
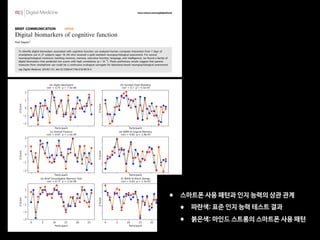
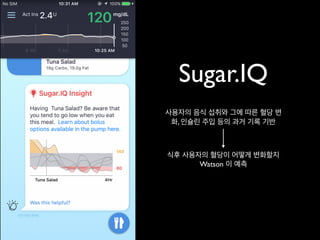
Professor Yoon Sup Choi discusses the future of digital healthcare and insurance. He argues that the rapid development and widespread impact of medical artificial intelligence is challenging for traditionally specialized medical professionals to understand. However, this book provides a good guide by clearly explaining concepts of medical AI, its applications, and relationships with doctors. The book also analyzes perspectives on various medical AI developments, uses, and possibilities in a balanced manner.

![[365mc] 디지털 헬스케어: 의료의 미래](https://cdn.slidesharecdn.com/ss_thumbnails/365mc-200317140059-thumbnail.jpg?width=640&height=640&fit=bounds)

![[KNAPS] 포스트 코로나 시대, 제약 산업과 디지털 헬스케어](https://cdn.slidesharecdn.com/ss_thumbnails/knaps-210128022335-thumbnail.jpg?width=640&height=640&fit=bounds)


![[메조미디어] MZ세대 건강관리 트렌드 리포트](https://cdn.slidesharecdn.com/ss_thumbnails/ssmezzomediamz202205-220513051830-fb2d3f81-thumbnail.jpg?width=640&height=640&fit=bounds)
![[메조미디어 X CJ AI CENTER] AI를 통한 개인맞춤형 서비스 트렌드](https://cdn.slidesharecdn.com/ss_thumbnails/mezzomedia202303-230627015754-209d5b1b-thumbnail.jpg?width=640&height=640&fit=bounds)


![[메조미디어] 젊게 사는 시니어, YOLD 세대 리포트](https://cdn.slidesharecdn.com/ss_thumbnails/ssyold220811-220812054842-34cdf9f5-thumbnail.jpg?width=640&height=640&fit=bounds)
![[메조미디어] 숏폼 마케팅 가이드](https://cdn.slidesharecdn.com/ss_thumbnails/random-230131083356-d1f1cd80-thumbnail.jpg?width=640&height=640&fit=bounds)

![[메조미디어] Z세대의 금융 트렌드, 자이낸스 리포트](https://cdn.slidesharecdn.com/ss_thumbnails/ssmezzomedia202303-230228014232-eeef6be2-thumbnail.jpg?width=640&height=640&fit=bounds)
![[메조미디어] 2023 상반기 미디어 이슈 결산](https://cdn.slidesharecdn.com/ss_thumbnails/ssmezzomedia2023-230725012308-864b7a19-thumbnail.jpg?width=640&height=640&fit=bounds)

![[모비데이즈] 디지털 트렌드 2022 유통_편의점.pdf](https://cdn.slidesharecdn.com/ss_thumbnails/2022-221004060826-8584287e-thumbnail.jpg?width=640&height=640&fit=bounds)


![[C&C] 의료의 미래 디지털 헬스케어](https://cdn.slidesharecdn.com/ss_thumbnails/cc-200616080105-thumbnail.jpg?width=640&height=640&fit=bounds)


![[NAVER D2SF][TMS2019] 휴이노](https://cdn.slidesharecdn.com/ss_thumbnails/trackb03huinnofinweb-191113095606-thumbnail.jpg?width=640&height=640&fit=bounds)


![[대한병리학회] 의료 인공지능 101: 병리를 중심으로](https://cdn.slidesharecdn.com/ss_thumbnails/pathology-201106004112-thumbnail.jpg?width=640&height=640&fit=bounds)


![[ASGO 2019] Artificial Intelligence in Medicine](https://cdn.slidesharecdn.com/ss_thumbnails/asgo2019medicalai191010-191010155811-thumbnail.jpg?width=640&height=640&fit=bounds)


