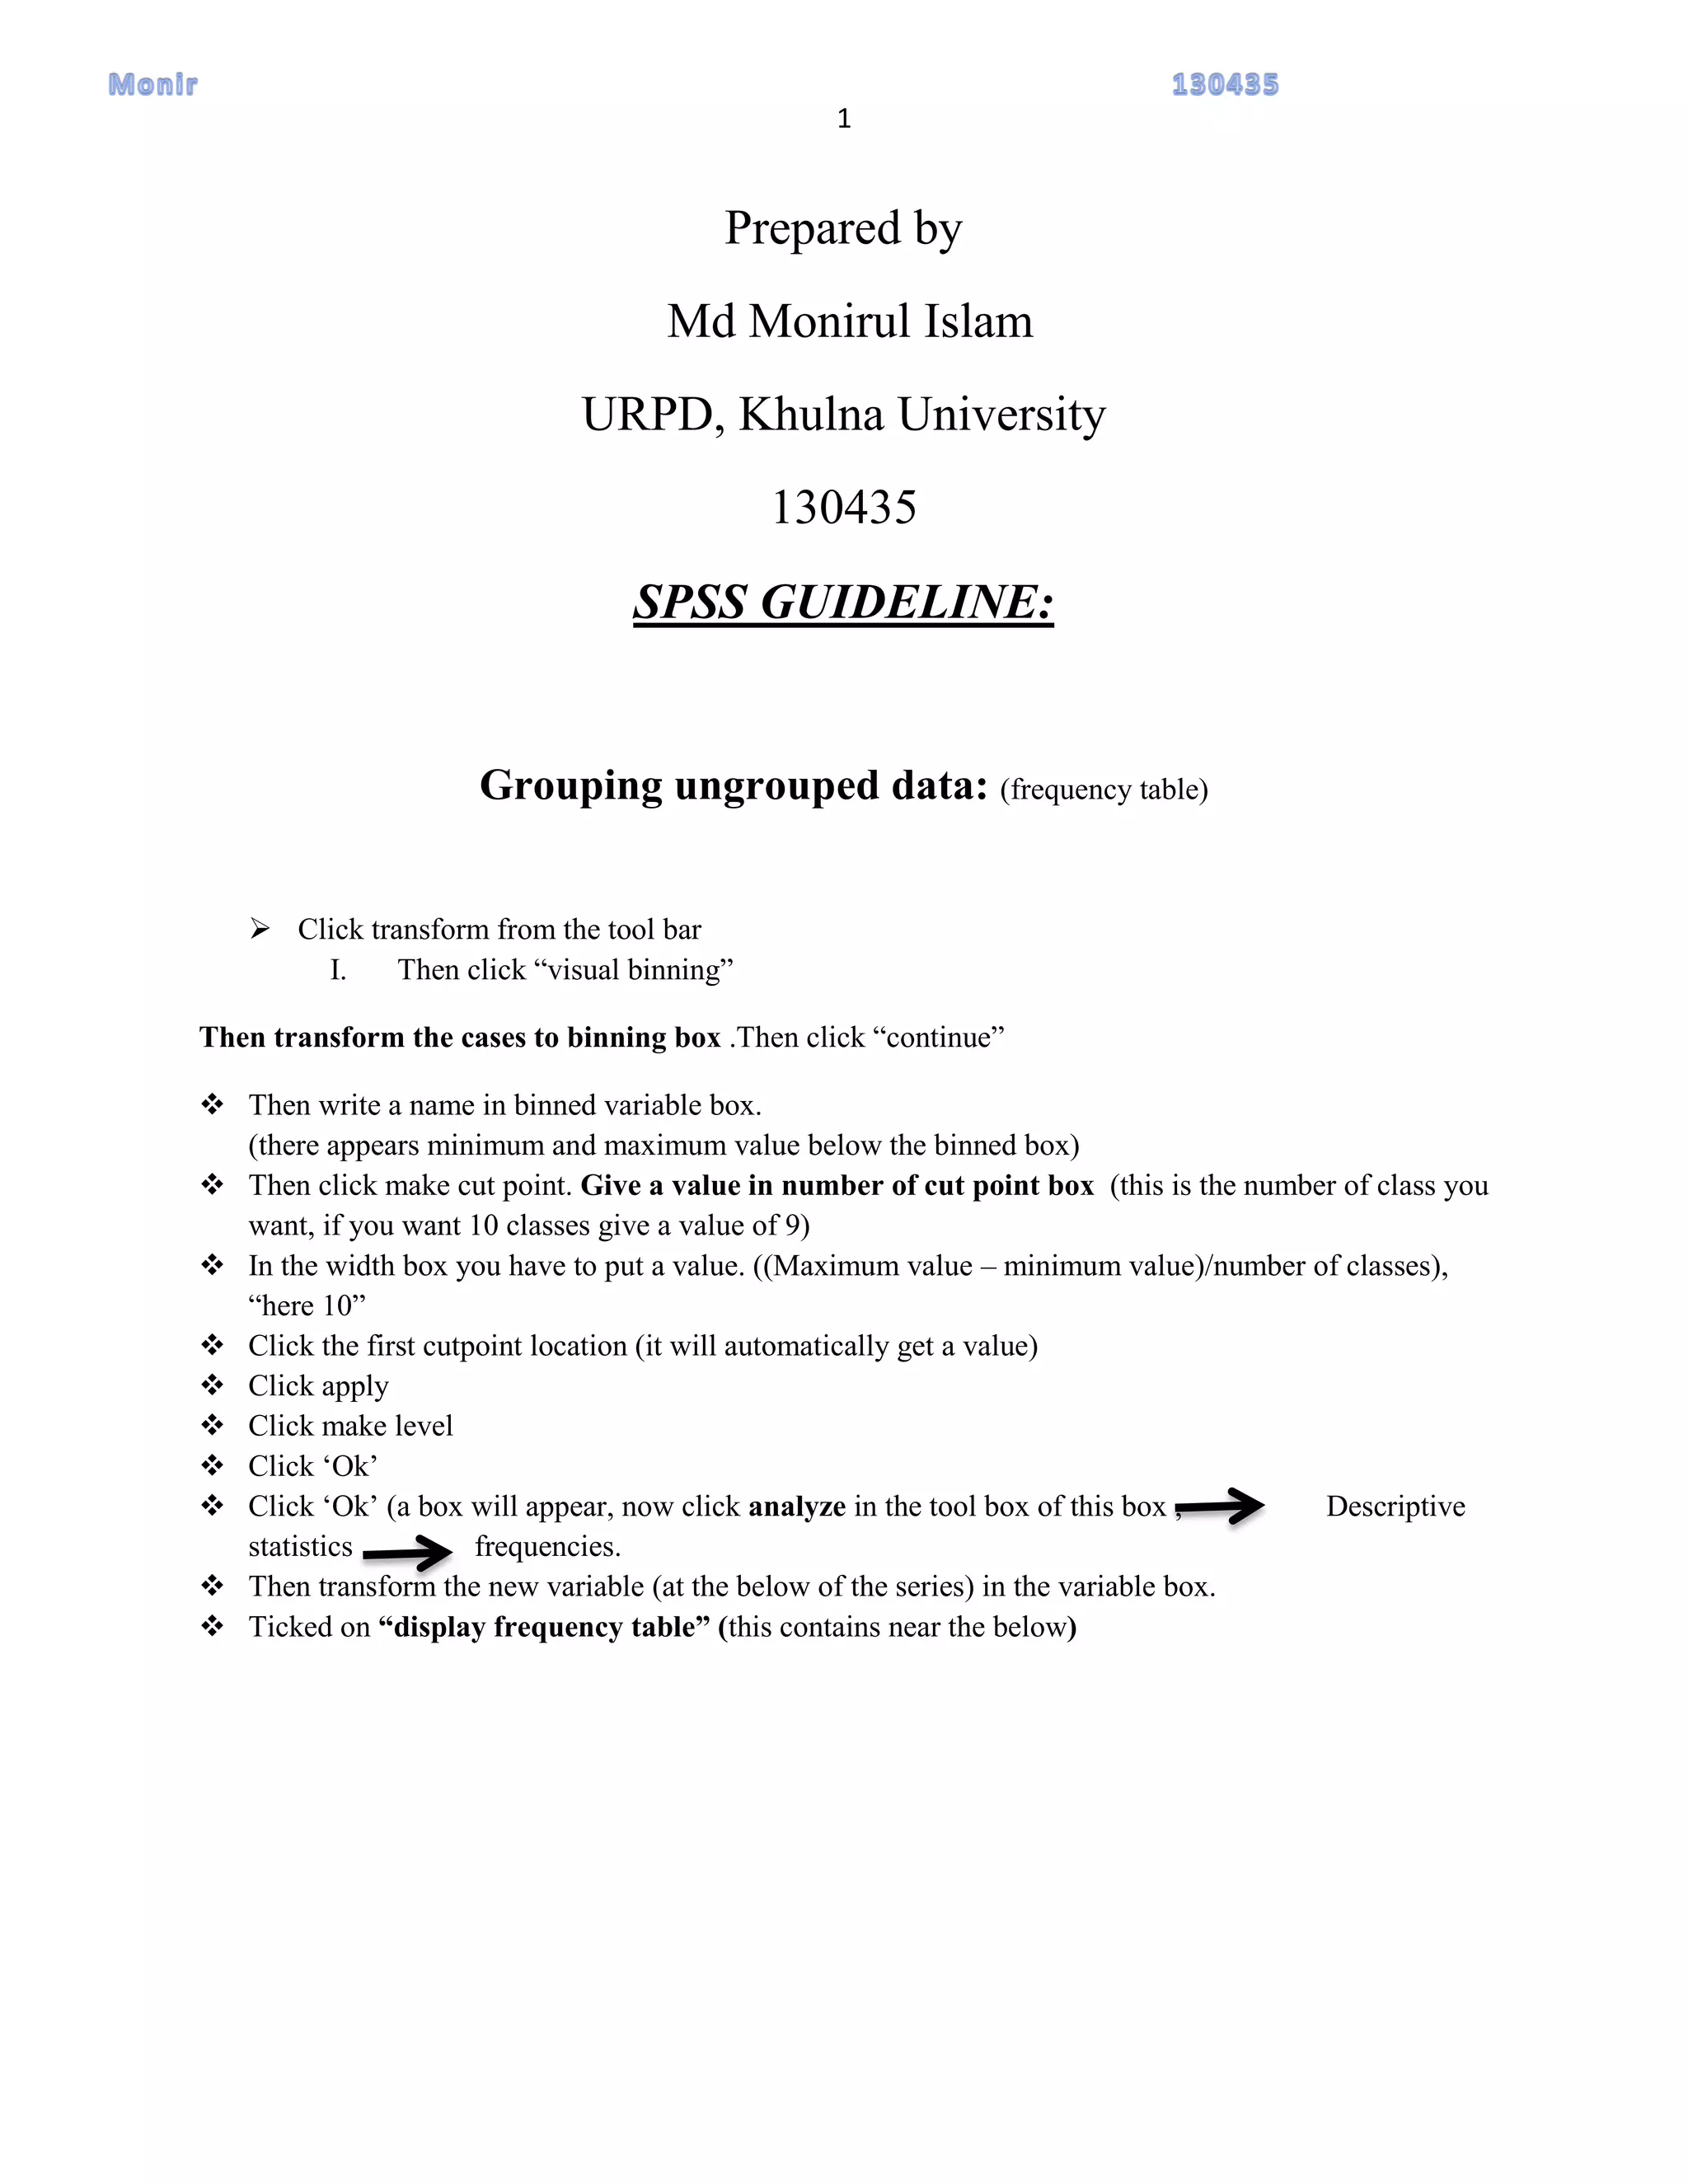
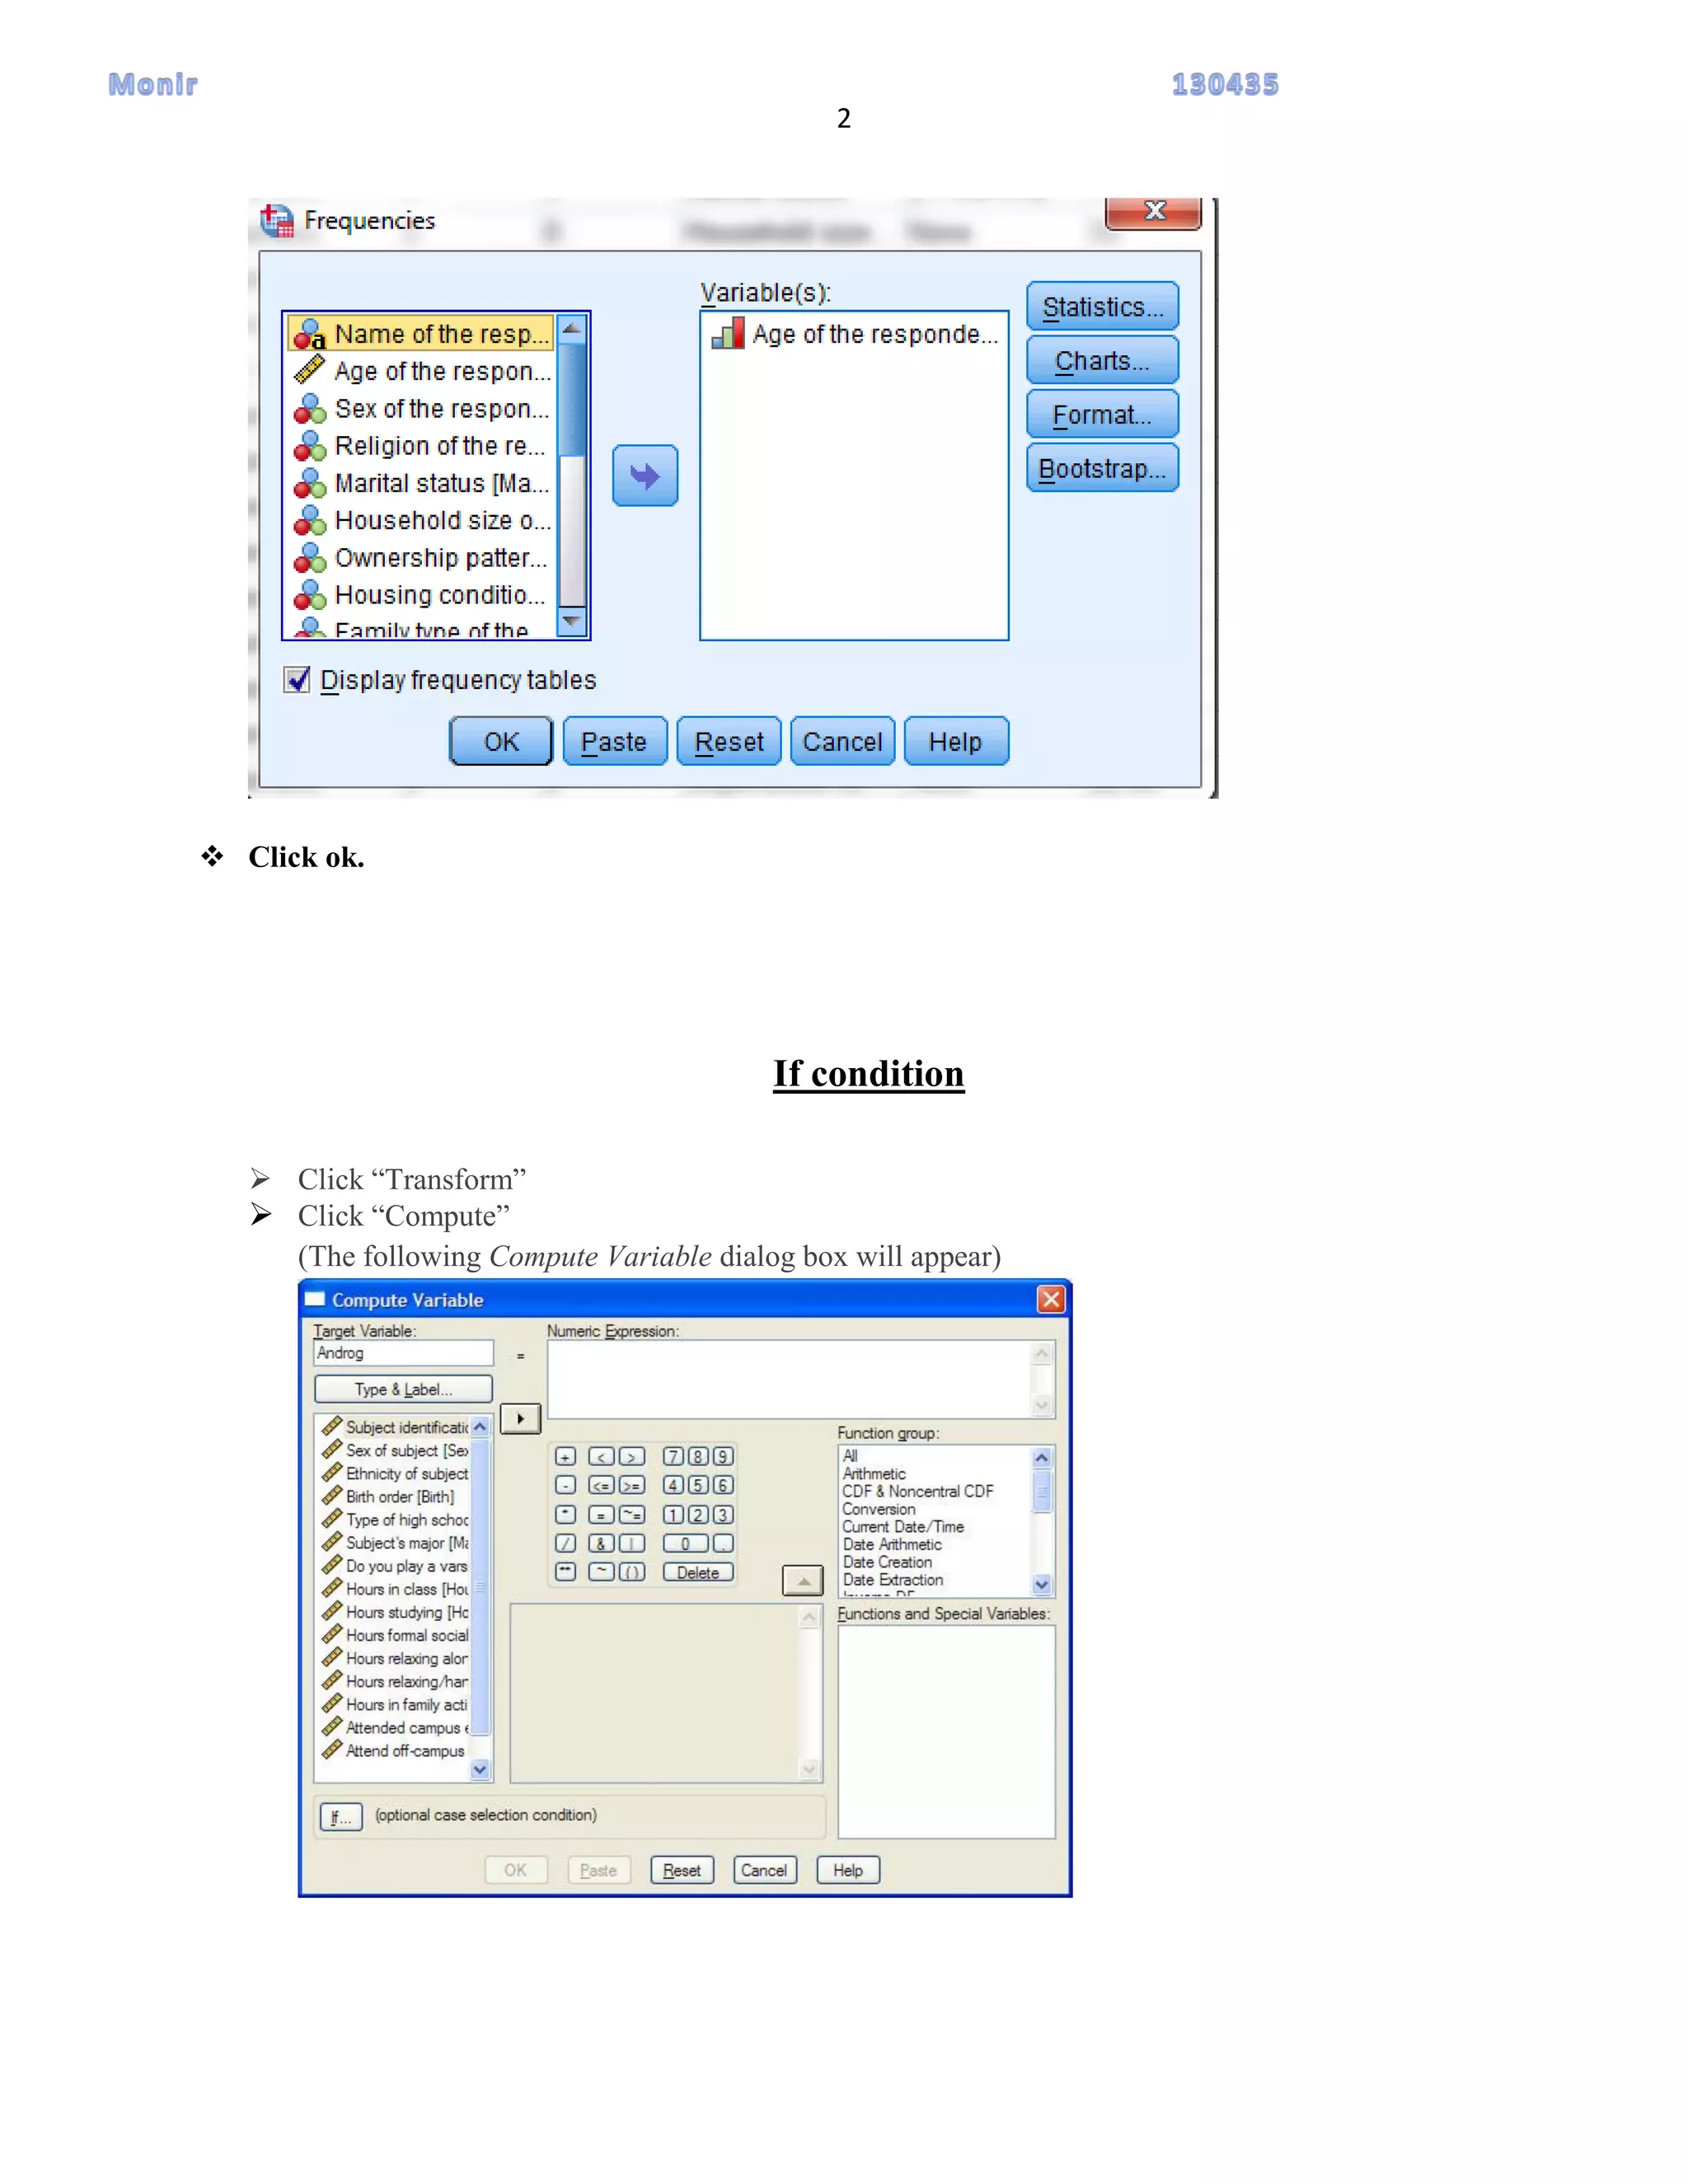
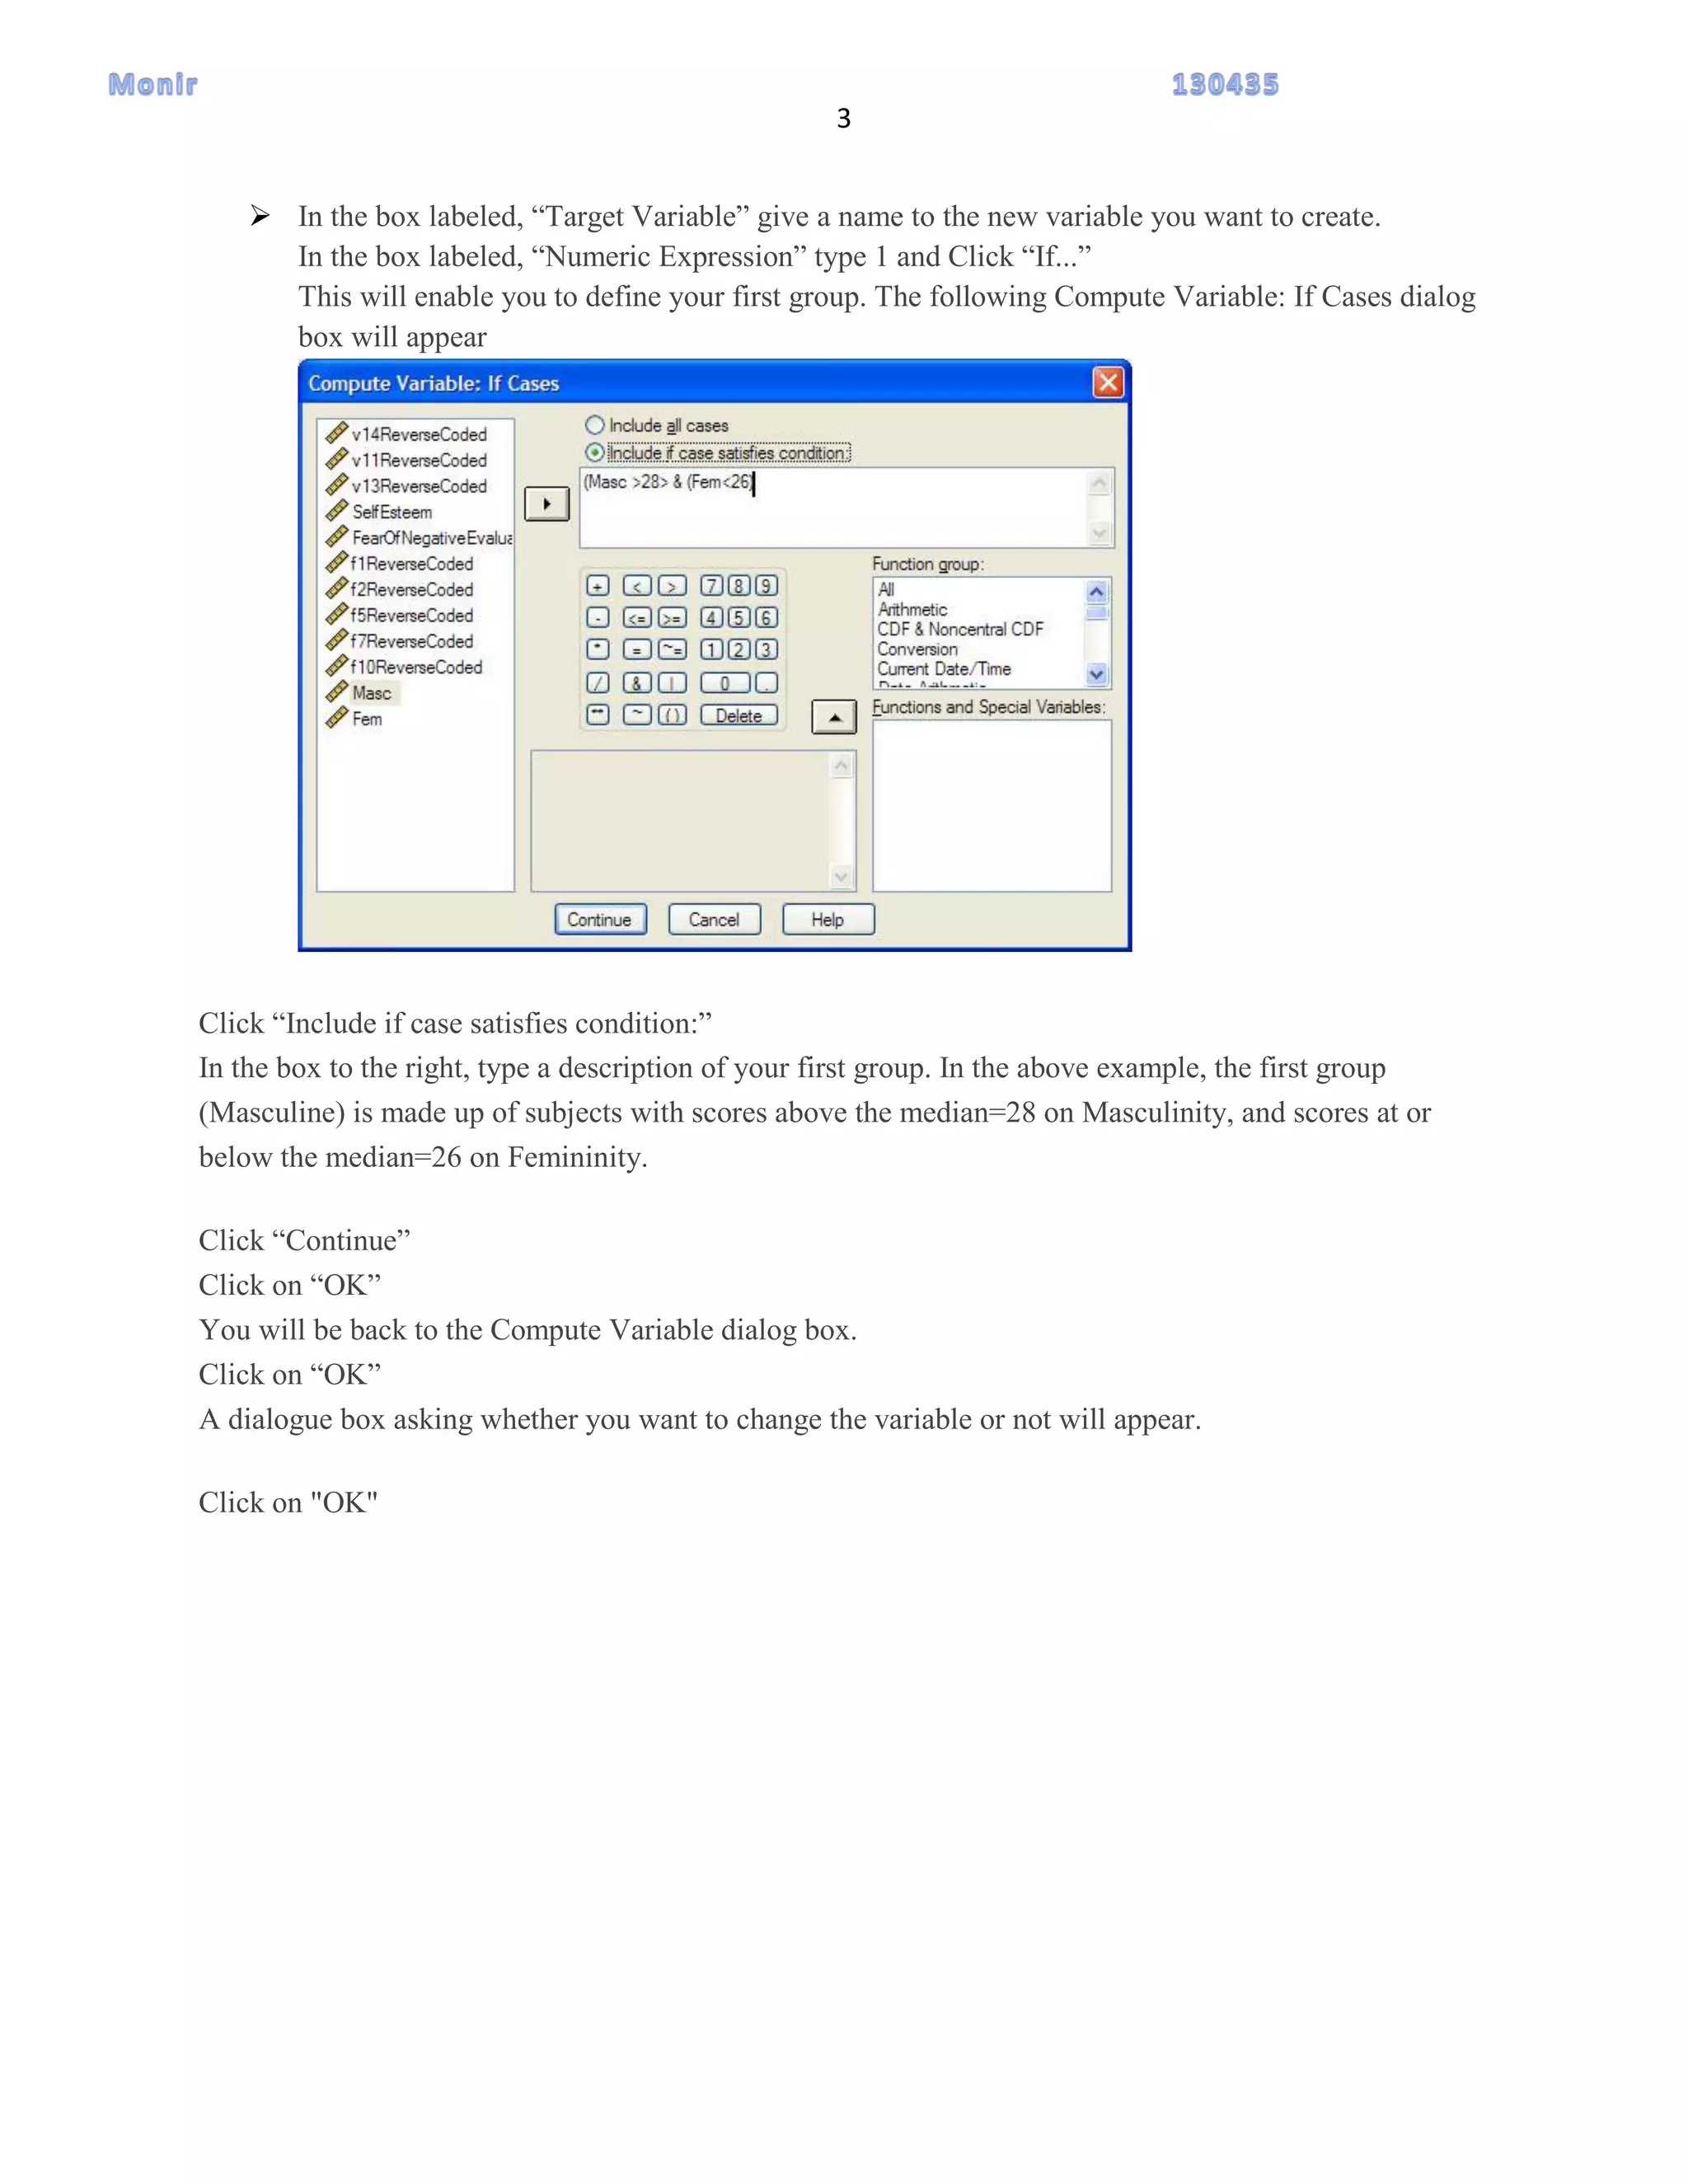
SlideShare a Scribd company logo
1
Prepared by
Md Monirul Islam
URPD, Khulna University
130435
SPSS GUIDELINE:
Grouping ungrouped data: (frequency table)
 Click transform from the tool bar
I. Then click “visual binning”
Then transform the cases to binning box .Then click “continue”
 Then write a name in binned variable box.
(there appears minimum and maximum value below the binned box)
 Then click make cut point. Give a value in number of cut point box (this is the number of class you
want, if you want 10 classes give a value of 9)
 In the width box you have to put a value. ((Maximum value – minimum value)/number of classes),
“here 10”
 Click the first cutpoint location (it will automatically get a value)
 Click apply
 Click make level
 Click „Ok‟
 Click „Ok‟ (a box will appear, now click analyze in the tool box of this box , Descriptive
statistics frequencies.
 Then transform the new variable (at the below of the series) in the variable box.
 Ticked on “display frequency table” (this contains near the below)
2
 Click ok.
If condition
 Click “Transform”
 Click “Compute”
(The following Compute Variable dialog box will appear)
3
 In the box labeled, “Target Variable” give a name to the new variable you want to create.
In the box labeled, “Numeric Expression” type 1 and Click “If...”
This will enable you to define your first group. The following Compute Variable: If Cases dialog
box will appear
Click “Include if case satisfies condition:”
In the box to the right, type a description of your first group. In the above example, the first group
(Masculine) is made up of subjects with scores above the median=28 on Masculinity, and scores at or
below the median=26 on Femininity.
Click “Continue”
Click on “OK”
You will be back to the Compute Variable dialog box.
Click on “OK”
A dialogue box asking whether you want to change the variable or not will appear.
Click on "OK"

More Related Content

Viewers also liked

20100928150918 lecture 14 (analysis of data)
20100928150918 lecture 14 (analysis of data)20100928150918 lecture 14 (analysis of data)
20100928150918 lecture 14 (analysis of data)
peningla
 
Ch21 22 data analysis and interpretation
Ch21 22 data analysis and interpretationCh21 22 data analysis and interpretation
Ch21 22 data analysis and interpretation
Jay Tanna
 
Frequency distribution1
Frequency distribution1Frequency distribution1
Frequency distribution1
Noufal Naheem kk
 
Difference between grouped and ungrouped data
Difference between grouped and ungrouped dataDifference between grouped and ungrouped data
Difference between grouped and ungrouped data
Atiq Rehman
 
Population and sample mean
Population and sample meanPopulation and sample mean
Population and sample mean
Avjinder (Avi) Kaler
 
Presentation of Data and Frequency Distribution
Presentation of Data and Frequency DistributionPresentation of Data and Frequency Distribution
Presentation of Data and Frequency Distribution
Elain Cruz
 
Chapter 2: Frequency Distribution and Graphs
Chapter 2: Frequency Distribution and GraphsChapter 2: Frequency Distribution and Graphs
Chapter 2: Frequency Distribution and Graphs
Mong Mara
 

Viewers also liked (7)

20100928150918 lecture 14 (analysis of data)
20100928150918 lecture 14 (analysis of data)20100928150918 lecture 14 (analysis of data)
20100928150918 lecture 14 (analysis of data)
 
Ch21 22 data analysis and interpretation
Ch21 22 data analysis and interpretationCh21 22 data analysis and interpretation
Ch21 22 data analysis and interpretation
 
Frequency distribution1
Frequency distribution1Frequency distribution1
Frequency distribution1
 
Difference between grouped and ungrouped data
Difference between grouped and ungrouped dataDifference between grouped and ungrouped data
Difference between grouped and ungrouped data
 
Population and sample mean
Population and sample meanPopulation and sample mean
Population and sample mean
 
Presentation of Data and Frequency Distribution
Presentation of Data and Frequency DistributionPresentation of Data and Frequency Distribution
Presentation of Data and Frequency Distribution
 
Chapter 2: Frequency Distribution and Graphs
Chapter 2: Frequency Distribution and GraphsChapter 2: Frequency Distribution and Graphs
Chapter 2: Frequency Distribution and Graphs
 

Similar to Spss guideline

(Manual spss)
(Manual spss)(Manual spss)
(Manual spss)
Enas Ahmed
 
SPSS How to use Spss software
SPSS How to use Spss softwareSPSS How to use Spss software
SPSS How to use Spss software
Debashis Baidya
 
SPSS PRESENTATION.PPT.pptx
SPSS PRESENTATION.PPT.pptxSPSS PRESENTATION.PPT.pptx
SPSS PRESENTATION.PPT.pptx
BMmugal
 
111249-140817070204-phpapp02.pdf
111249-140817070204-phpapp02.pdf111249-140817070204-phpapp02.pdf
111249-140817070204-phpapp02.pdf
BMmugal
 
spss intro.ppt
spss intro.pptspss intro.ppt
spss intro.ppt
KENNEDY GITHAIGA
 
Spss lecture notes
Spss lecture notesSpss lecture notes
Spss lecture notes
David mbwiga
 
Recode Age Variable in SPSS
Recode  Age  Variable in SPSSRecode  Age  Variable in SPSS
Recode Age Variable in SPSS
Ruth M Tappin
 
Introduction To SPSS
Introduction To SPSSIntroduction To SPSS
Introduction To SPSS
ThankGod Damion Okpe
 
Easy Pivot Tutorial June 2020
Easy Pivot Tutorial June 2020Easy Pivot Tutorial June 2020
Easy Pivot Tutorial June 2020
Adhi Wikantyoso
 
This image appears when a project instruction has changed to accommo.docx
This image appears when a project instruction has changed to accommo.docxThis image appears when a project instruction has changed to accommo.docx
This image appears when a project instruction has changed to accommo.docx
juan1826
 
Excel Solver(By Mahsa Rezaei)
Excel Solver(By Mahsa Rezaei)Excel Solver(By Mahsa Rezaei)
Excel Solver(By Mahsa Rezaei)
mahsa rezaei
 
Software packages for statistical analysis - SPSS
Software packages for statistical analysis - SPSSSoftware packages for statistical analysis - SPSS
Software packages for statistical analysis - SPSS
ANAND BALAJI
 
MS Access 2010 tutorial 5
MS Access 2010 tutorial 5MS Access 2010 tutorial 5
MS Access 2010 tutorial 5
Khalfan Alshuaili
 
Software application for qs material standard rate
Software application for qs   material  standard rateSoftware application for qs   material  standard rate
Software application for qs material standard rate
Farah Sham
 
Ms access
Ms accessMs access
Ms access
navidhiman
 
De vry math 399 all ilabs latest 2016 november
De vry math 399 all ilabs latest 2016 novemberDe vry math 399 all ilabs latest 2016 november
De vry math 399 all ilabs latest 2016 november
lenasour
 
Ansys tutorial1
Ansys tutorial1Ansys tutorial1
Ansys tutorial1
Indra Septiawan
 
Spss notes
Spss notesSpss notes
Spss notes
sitifatimahcheosmi
 
Data management through spss
Data management through spssData management through spss
Data management through spss
APPOLINAIRE BIZIMANA
 
Creating a Normative Group
Creating a Normative GroupCreating a Normative Group
Creating a Normative Group
atsumagaysay
 

Similar to Spss guideline (20)

(Manual spss)
(Manual spss)(Manual spss)
(Manual spss)
 
SPSS How to use Spss software
SPSS How to use Spss softwareSPSS How to use Spss software
SPSS How to use Spss software
 
SPSS PRESENTATION.PPT.pptx
SPSS PRESENTATION.PPT.pptxSPSS PRESENTATION.PPT.pptx
SPSS PRESENTATION.PPT.pptx
 
111249-140817070204-phpapp02.pdf
111249-140817070204-phpapp02.pdf111249-140817070204-phpapp02.pdf
111249-140817070204-phpapp02.pdf
 
spss intro.ppt
spss intro.pptspss intro.ppt
spss intro.ppt
 
Spss lecture notes
Spss lecture notesSpss lecture notes
Spss lecture notes
 
Recode Age Variable in SPSS
Recode  Age  Variable in SPSSRecode  Age  Variable in SPSS
Recode Age Variable in SPSS
 
Introduction To SPSS
Introduction To SPSSIntroduction To SPSS
Introduction To SPSS
 
Easy Pivot Tutorial June 2020
Easy Pivot Tutorial June 2020Easy Pivot Tutorial June 2020
Easy Pivot Tutorial June 2020
 
This image appears when a project instruction has changed to accommo.docx
This image appears when a project instruction has changed to accommo.docxThis image appears when a project instruction has changed to accommo.docx
This image appears when a project instruction has changed to accommo.docx
 
Excel Solver(By Mahsa Rezaei)
Excel Solver(By Mahsa Rezaei)Excel Solver(By Mahsa Rezaei)
Excel Solver(By Mahsa Rezaei)
 
Software packages for statistical analysis - SPSS
Software packages for statistical analysis - SPSSSoftware packages for statistical analysis - SPSS
Software packages for statistical analysis - SPSS
 
MS Access 2010 tutorial 5
MS Access 2010 tutorial 5MS Access 2010 tutorial 5
MS Access 2010 tutorial 5
 
Software application for qs material standard rate
Software application for qs   material  standard rateSoftware application for qs   material  standard rate
Software application for qs material standard rate
 
Ms access
Ms accessMs access
Ms access
 
De vry math 399 all ilabs latest 2016 november
De vry math 399 all ilabs latest 2016 novemberDe vry math 399 all ilabs latest 2016 november
De vry math 399 all ilabs latest 2016 november
 
Ansys tutorial1
Ansys tutorial1Ansys tutorial1
Ansys tutorial1
 
Spss notes
Spss notesSpss notes
Spss notes
 
Data management through spss
Data management through spssData management through spss
Data management through spss
 
Creating a Normative Group
Creating a Normative GroupCreating a Normative Group
Creating a Normative Group
 

Spss guideline

  • 1. 1 Prepared by Md Monirul Islam URPD, Khulna University 130435 SPSS GUIDELINE: Grouping ungrouped data: (frequency table)  Click transform from the tool bar I. Then click “visual binning” Then transform the cases to binning box .Then click “continue”  Then write a name in binned variable box. (there appears minimum and maximum value below the binned box)  Then click make cut point. Give a value in number of cut point box (this is the number of class you want, if you want 10 classes give a value of 9)  In the width box you have to put a value. ((Maximum value – minimum value)/number of classes), “here 10”  Click the first cutpoint location (it will automatically get a value)  Click apply  Click make level  Click „Ok‟  Click „Ok‟ (a box will appear, now click analyze in the tool box of this box , Descriptive statistics frequencies.  Then transform the new variable (at the below of the series) in the variable box.  Ticked on “display frequency table” (this contains near the below)
  • 2. 2  Click ok. If condition  Click “Transform”  Click “Compute” (The following Compute Variable dialog box will appear)
  • 3. 3  In the box labeled, “Target Variable” give a name to the new variable you want to create. In the box labeled, “Numeric Expression” type 1 and Click “If...” This will enable you to define your first group. The following Compute Variable: If Cases dialog box will appear Click “Include if case satisfies condition:” In the box to the right, type a description of your first group. In the above example, the first group (Masculine) is made up of subjects with scores above the median=28 on Masculinity, and scores at or below the median=26 on Femininity. Click “Continue” Click on “OK” You will be back to the Compute Variable dialog box. Click on “OK” A dialogue box asking whether you want to change the variable or not will appear. Click on "OK"