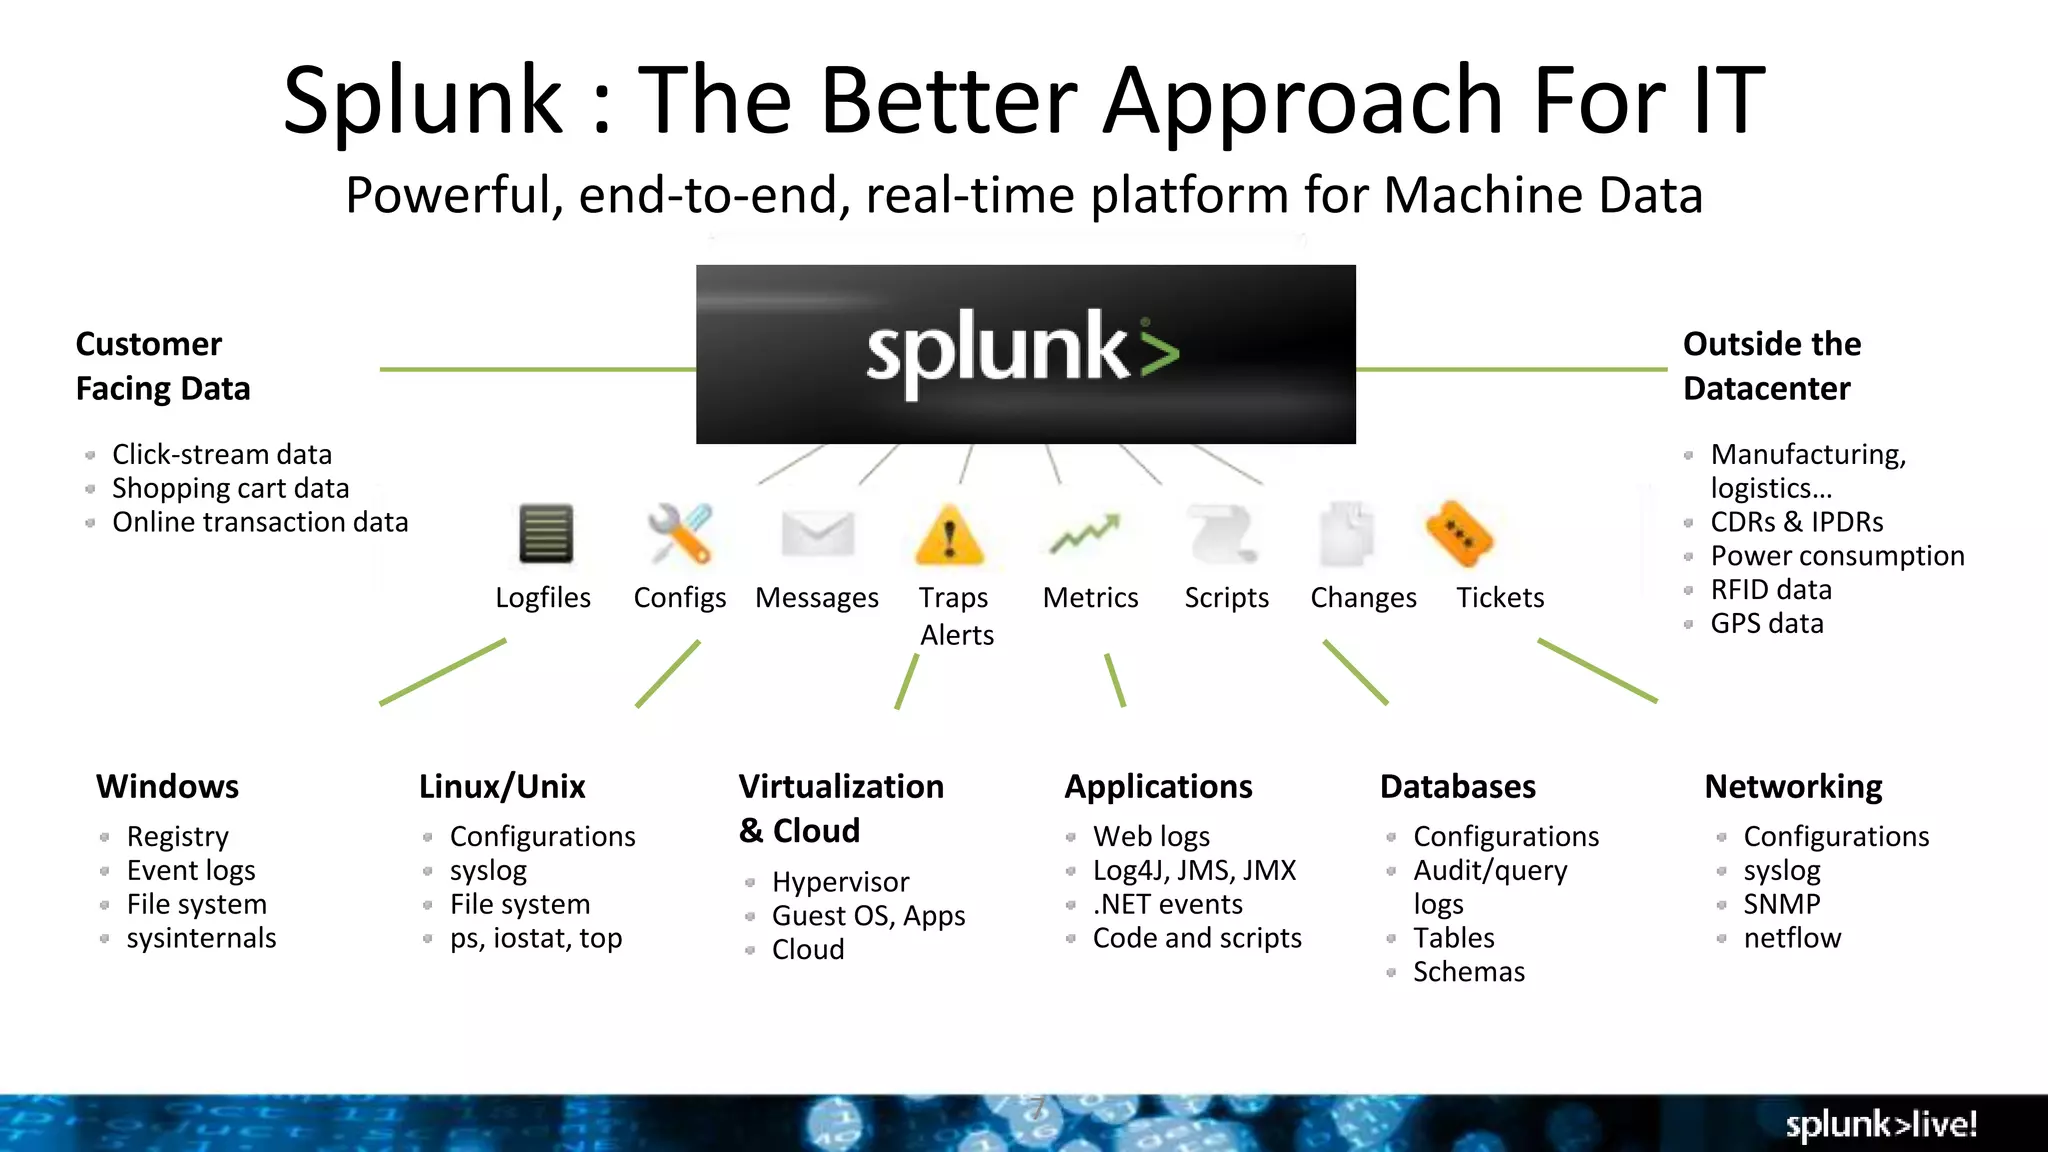
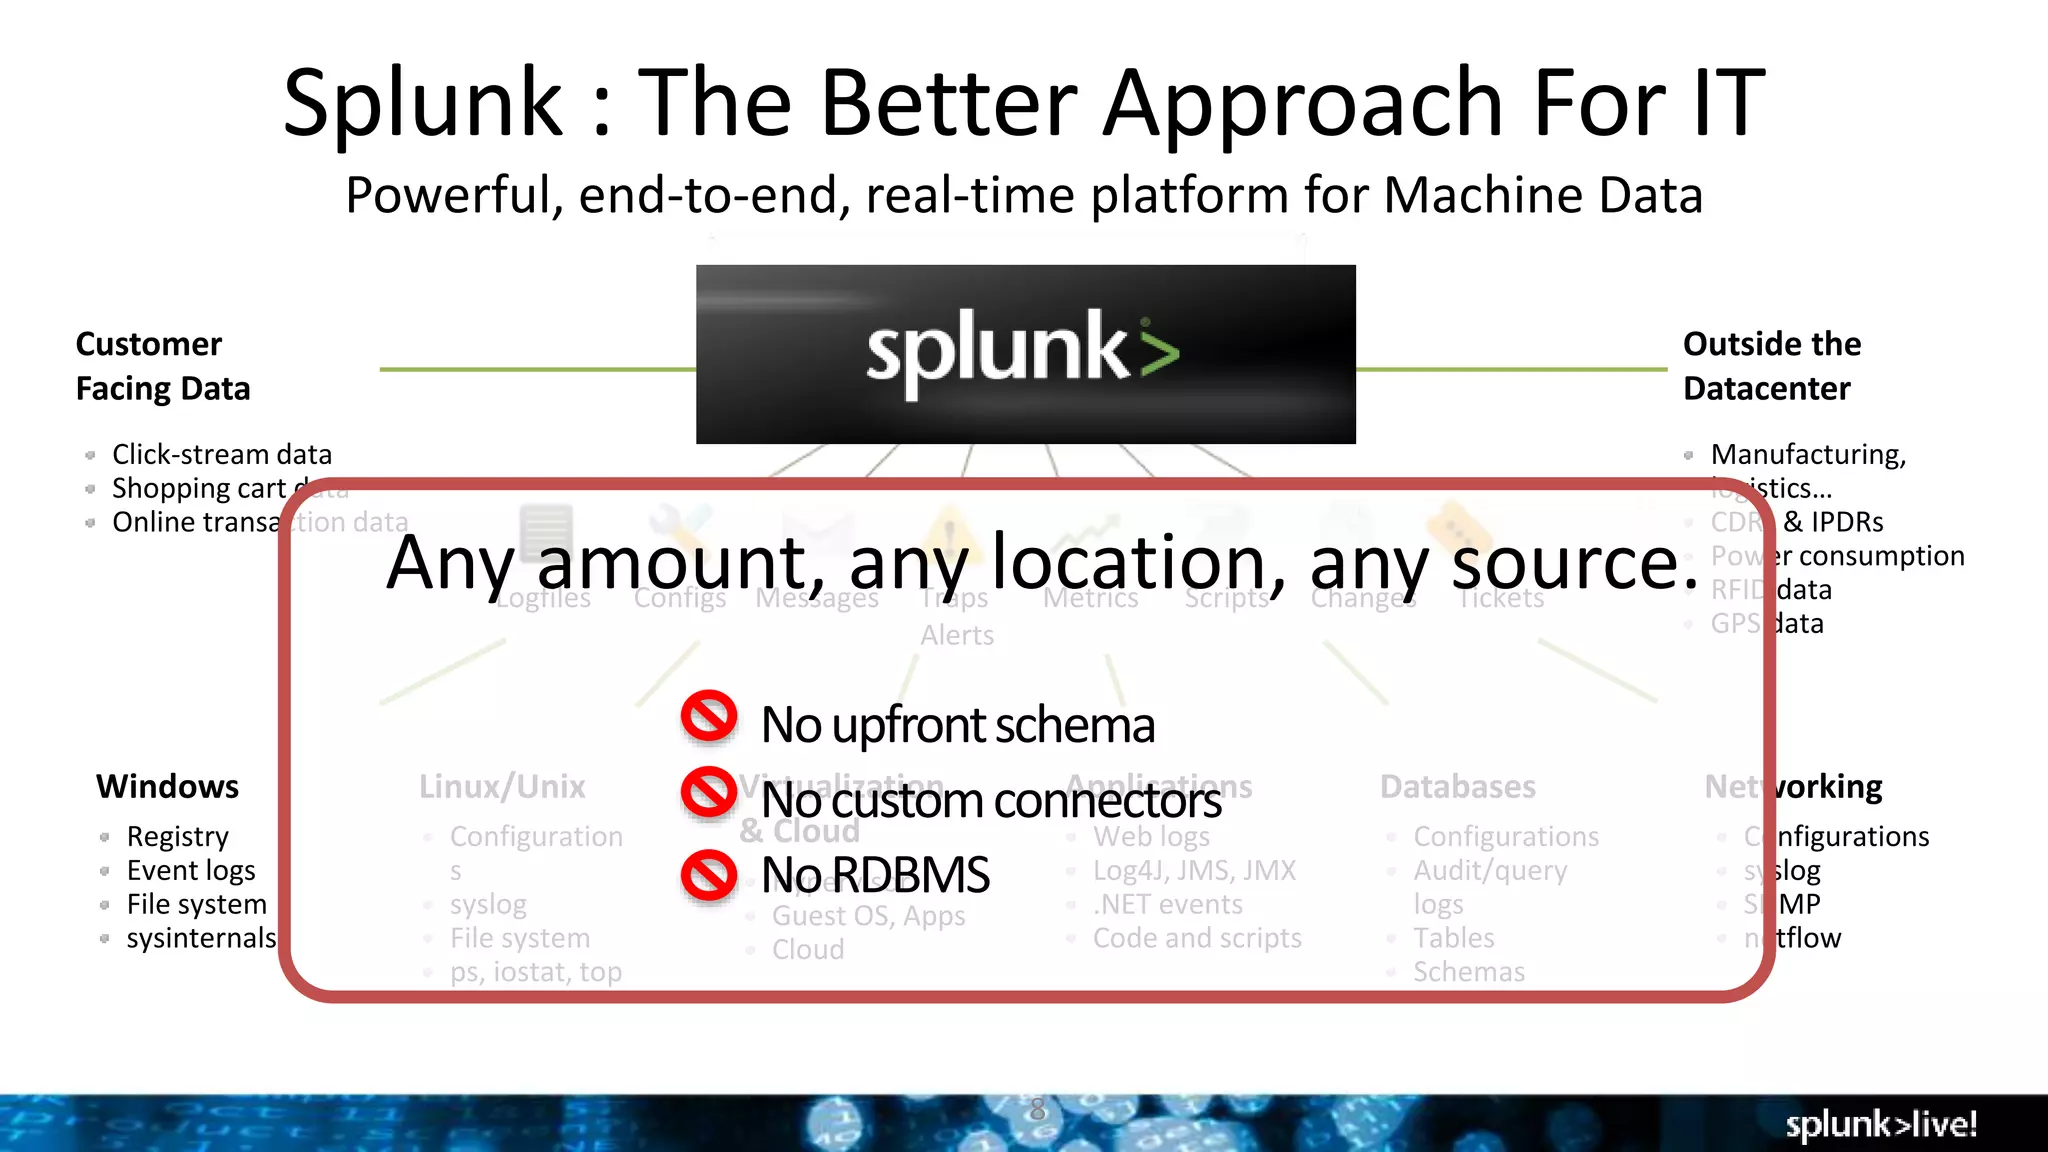
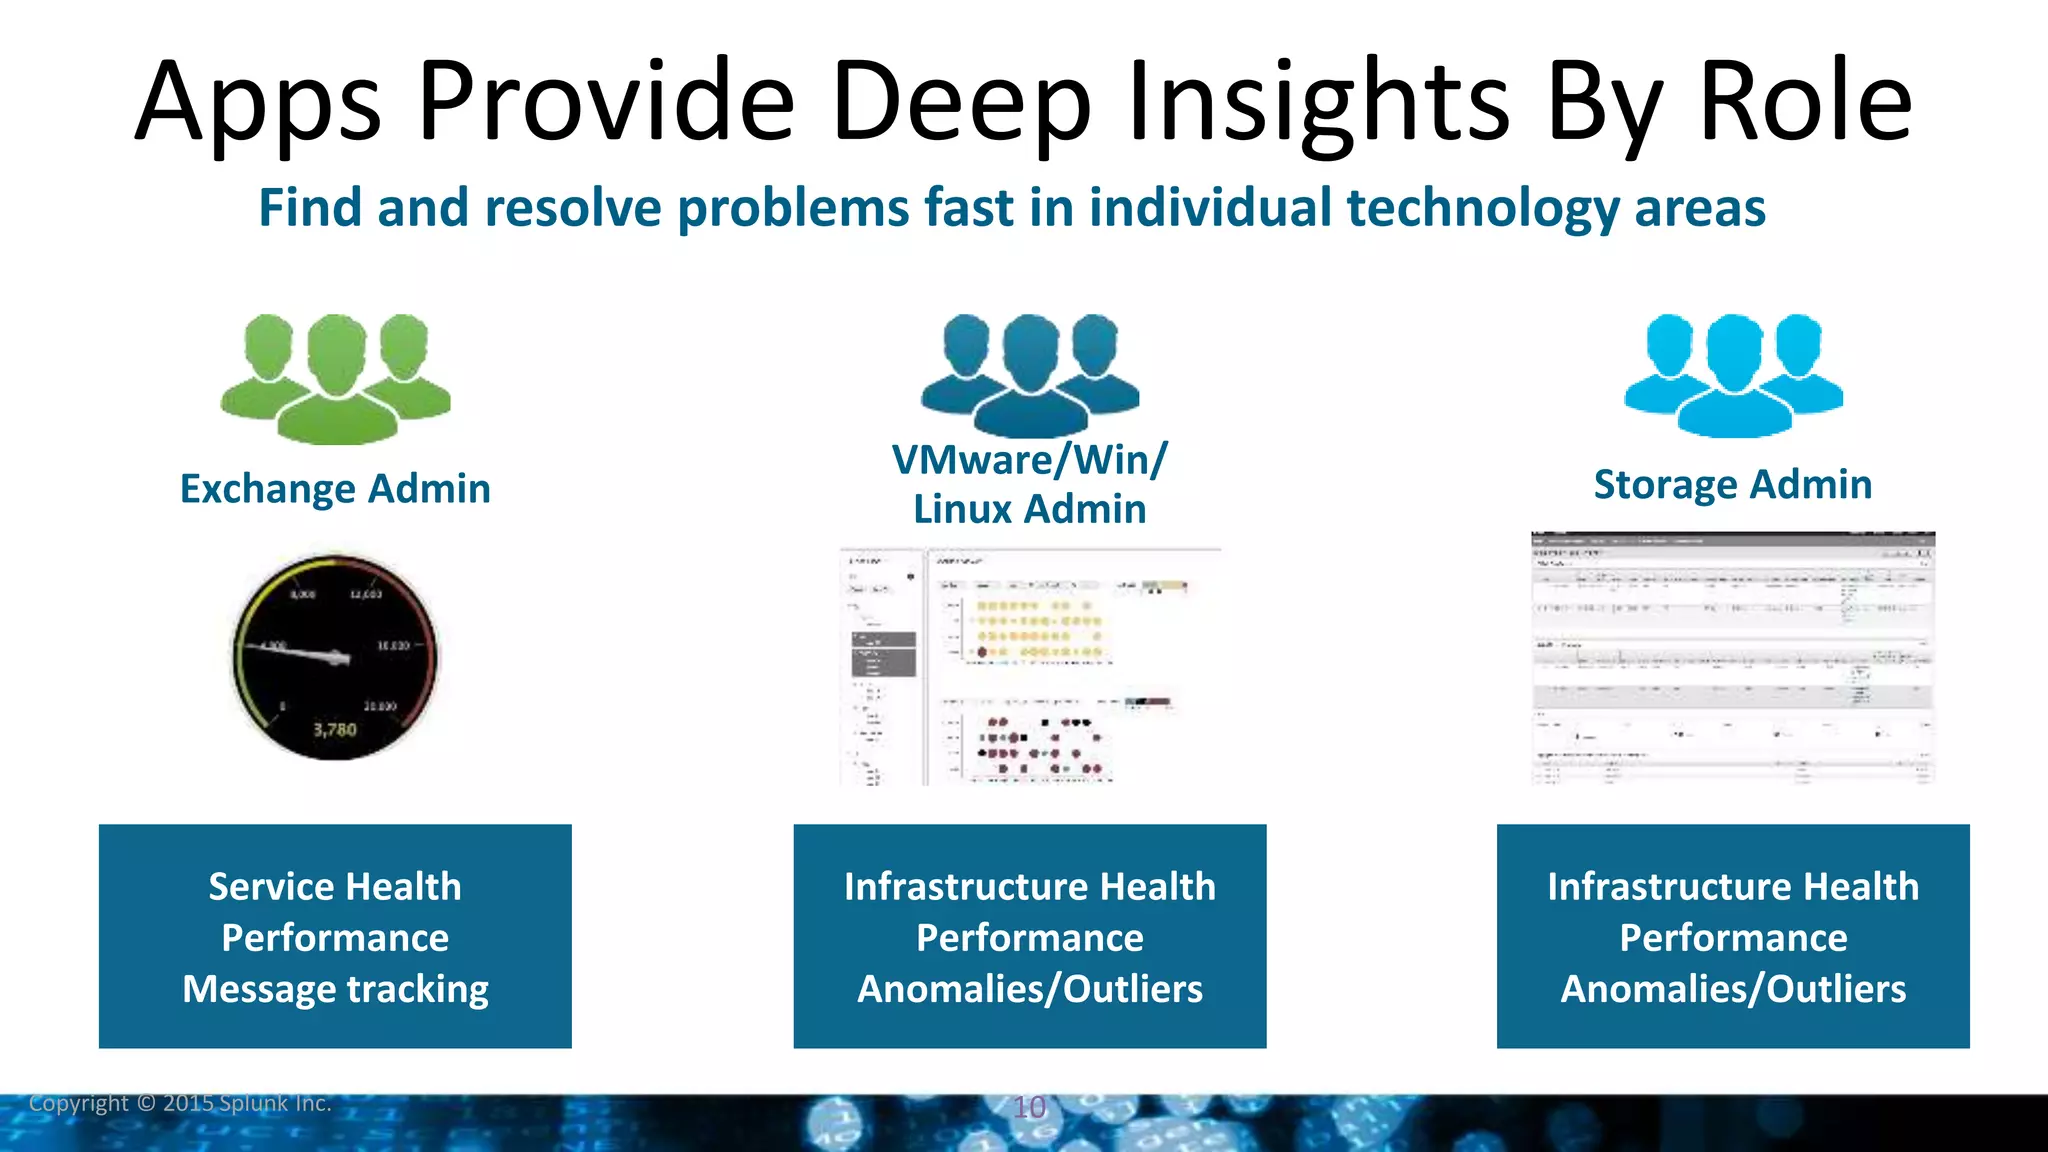
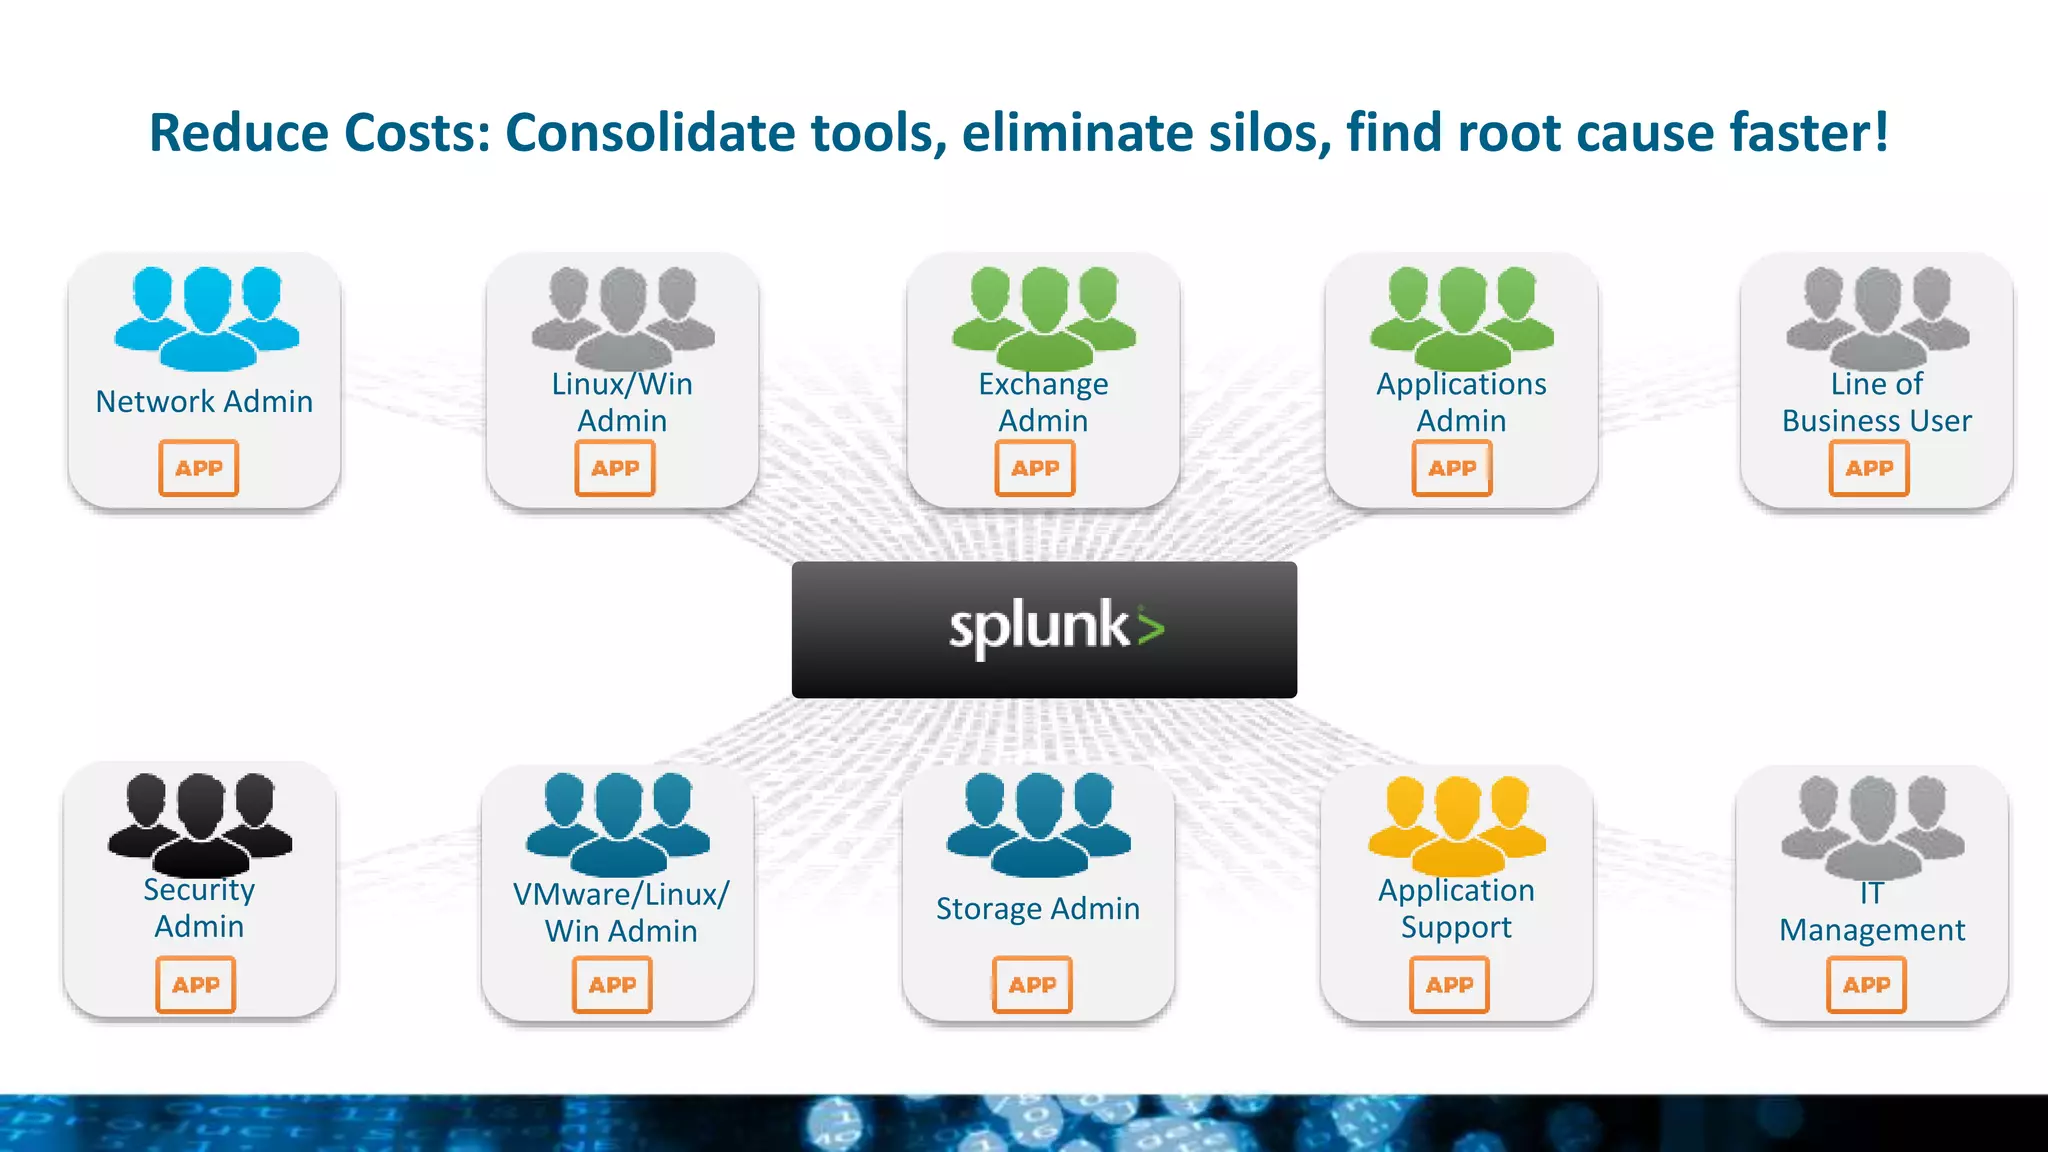
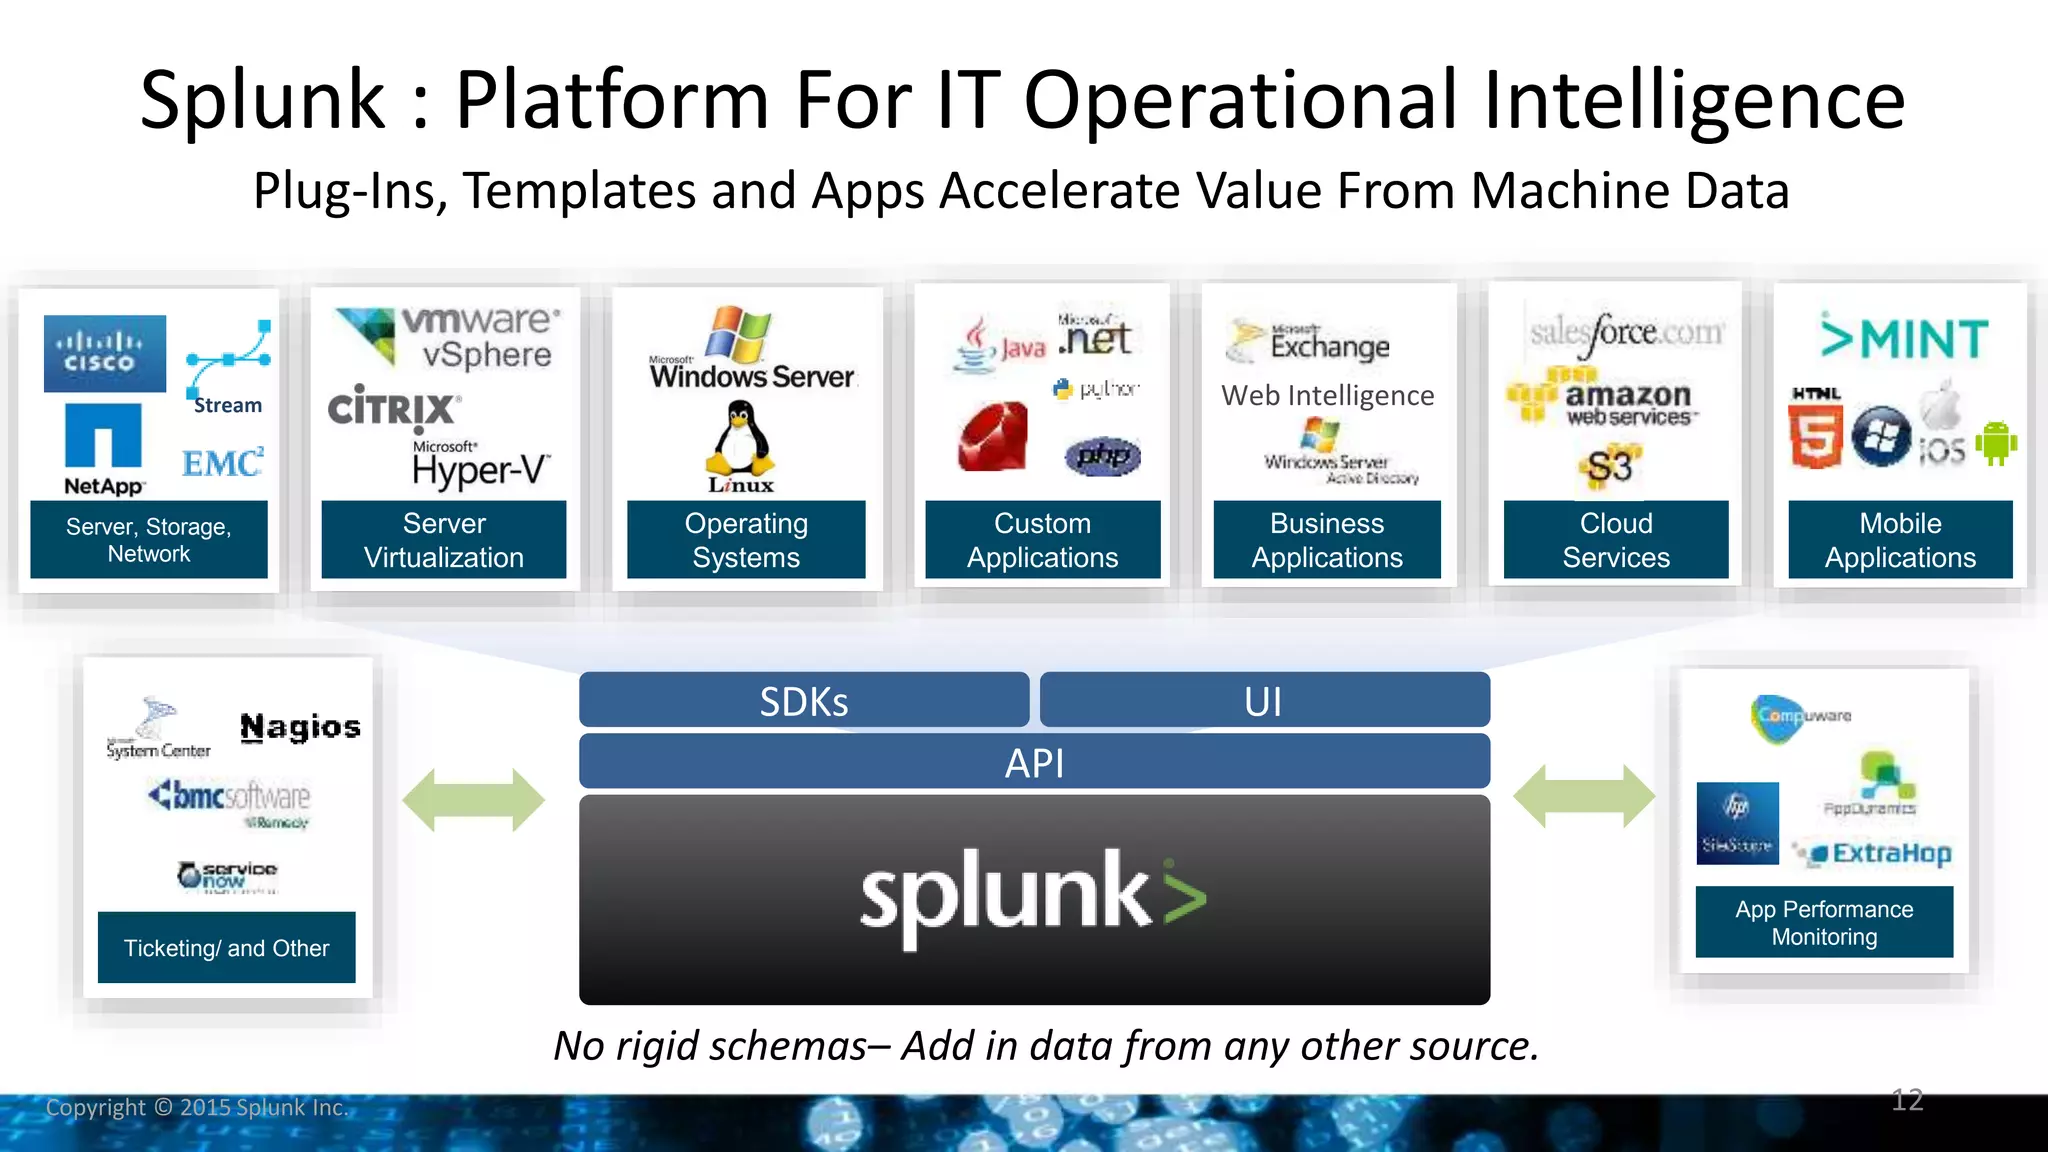
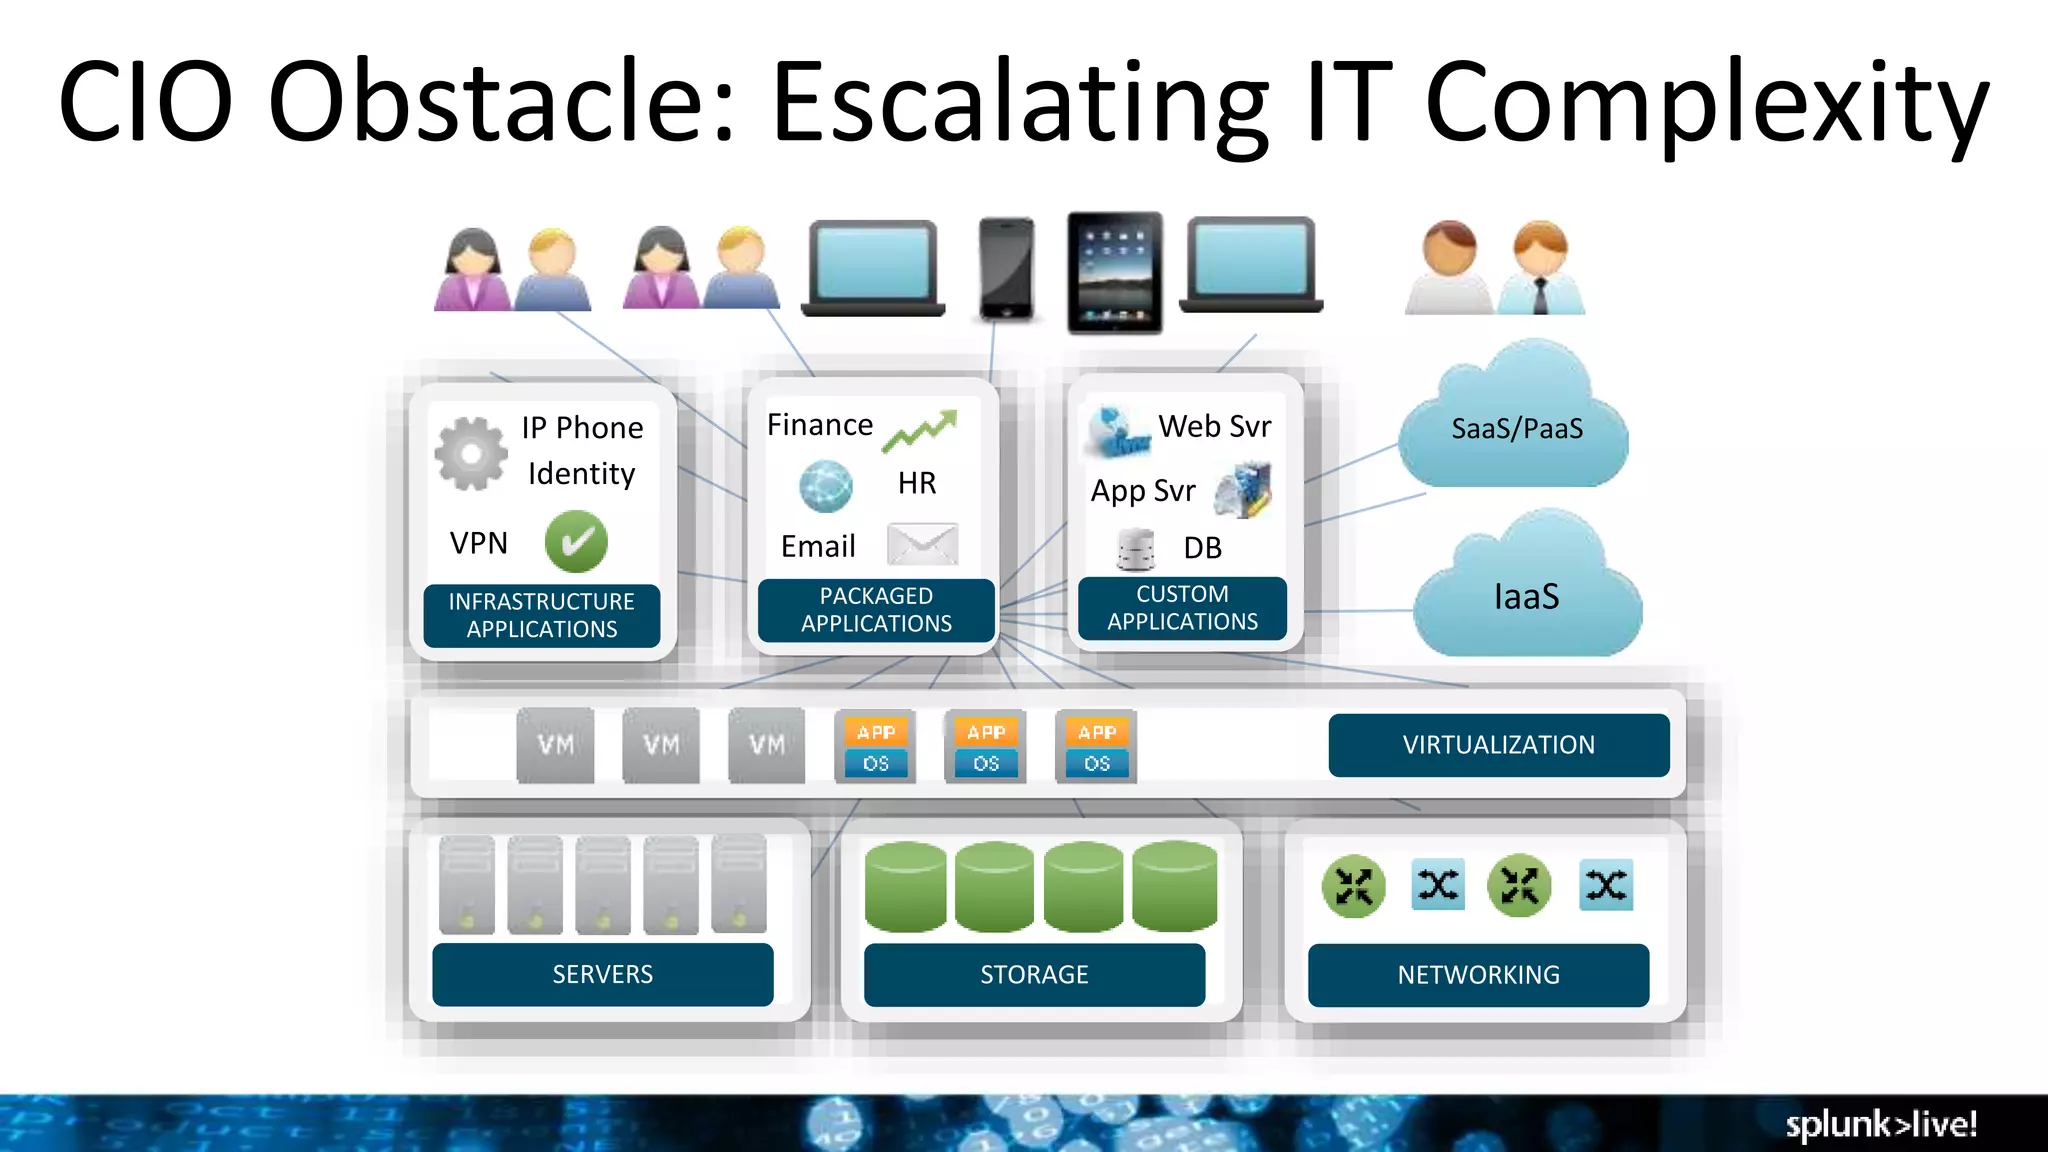
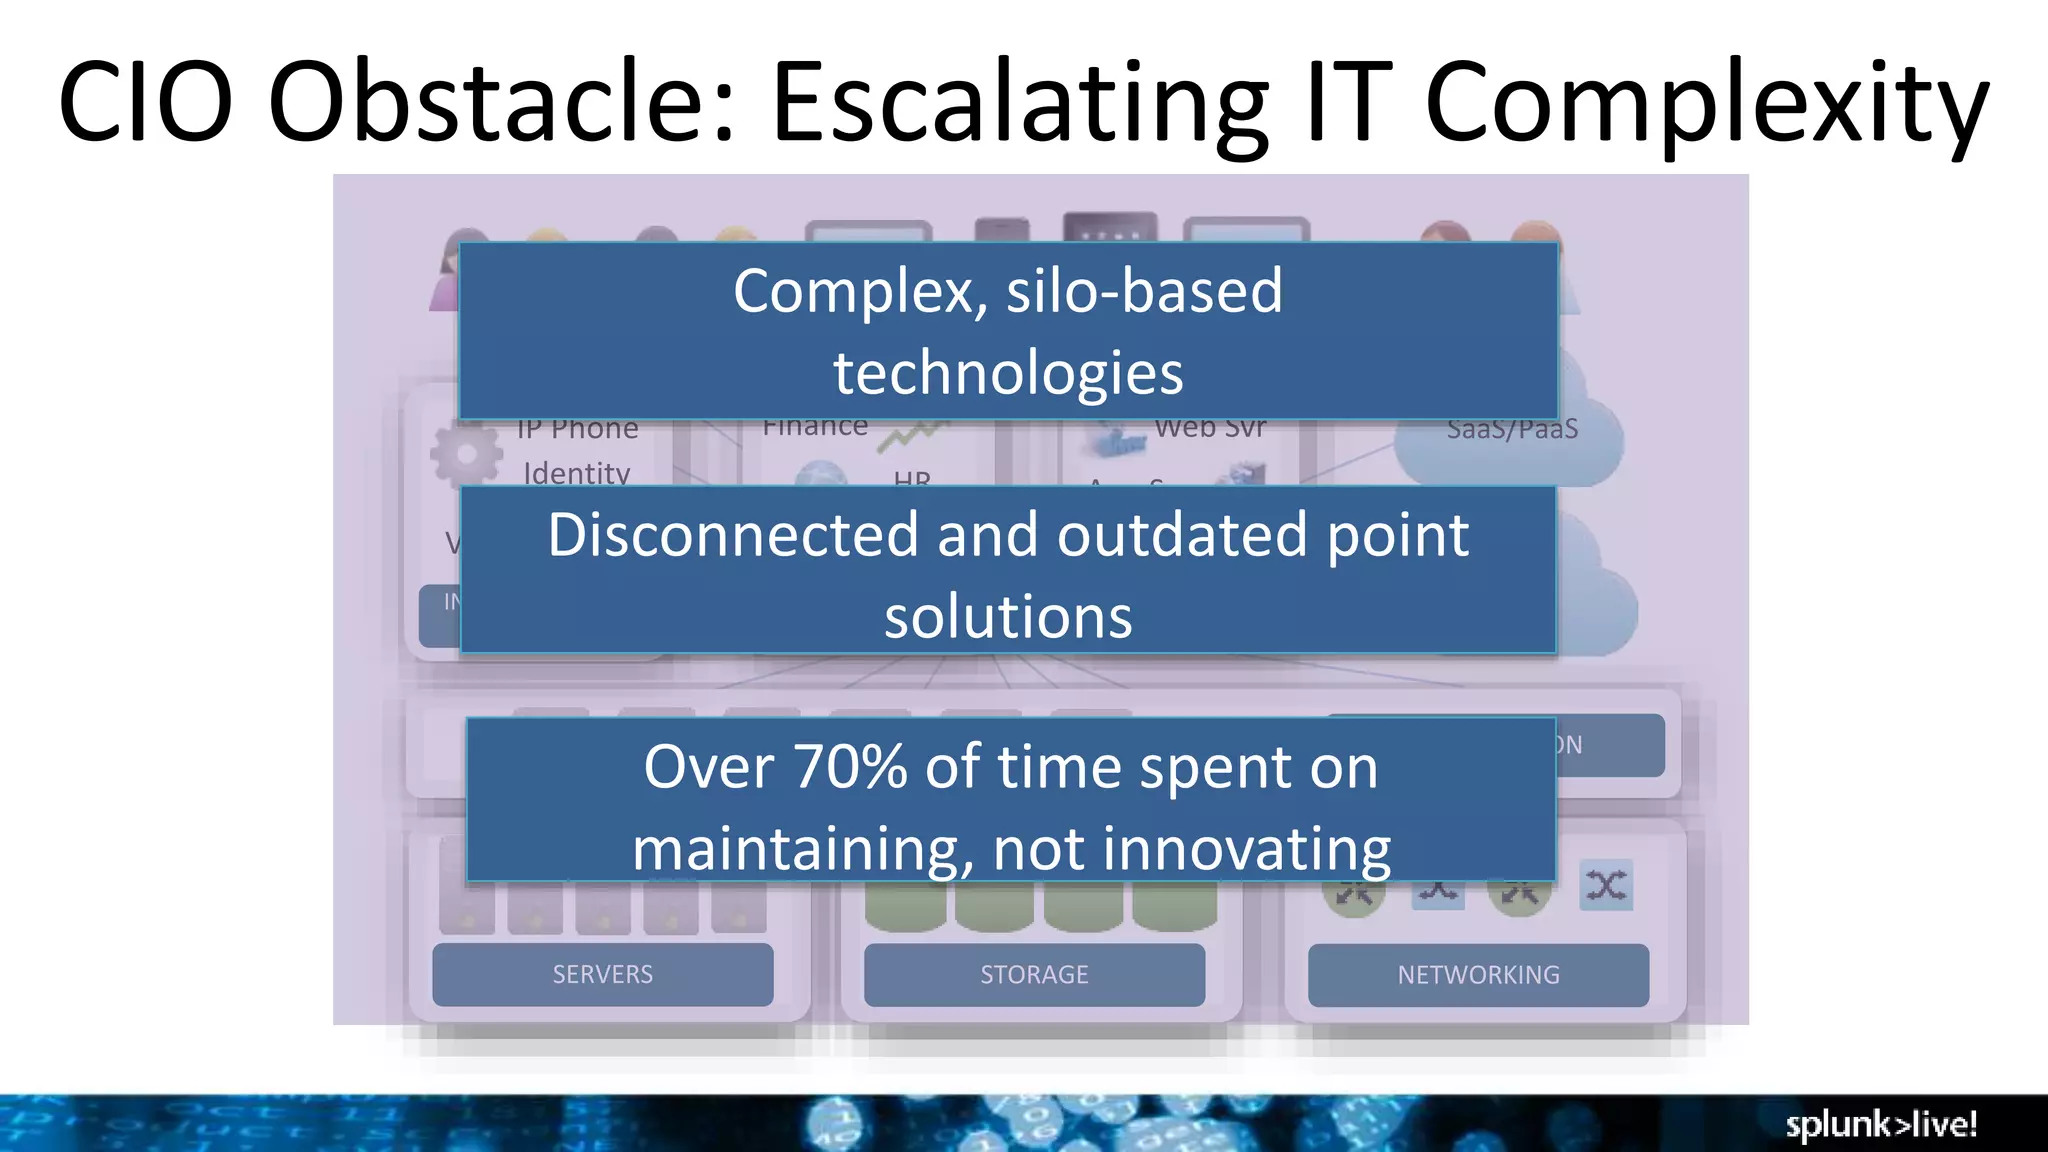
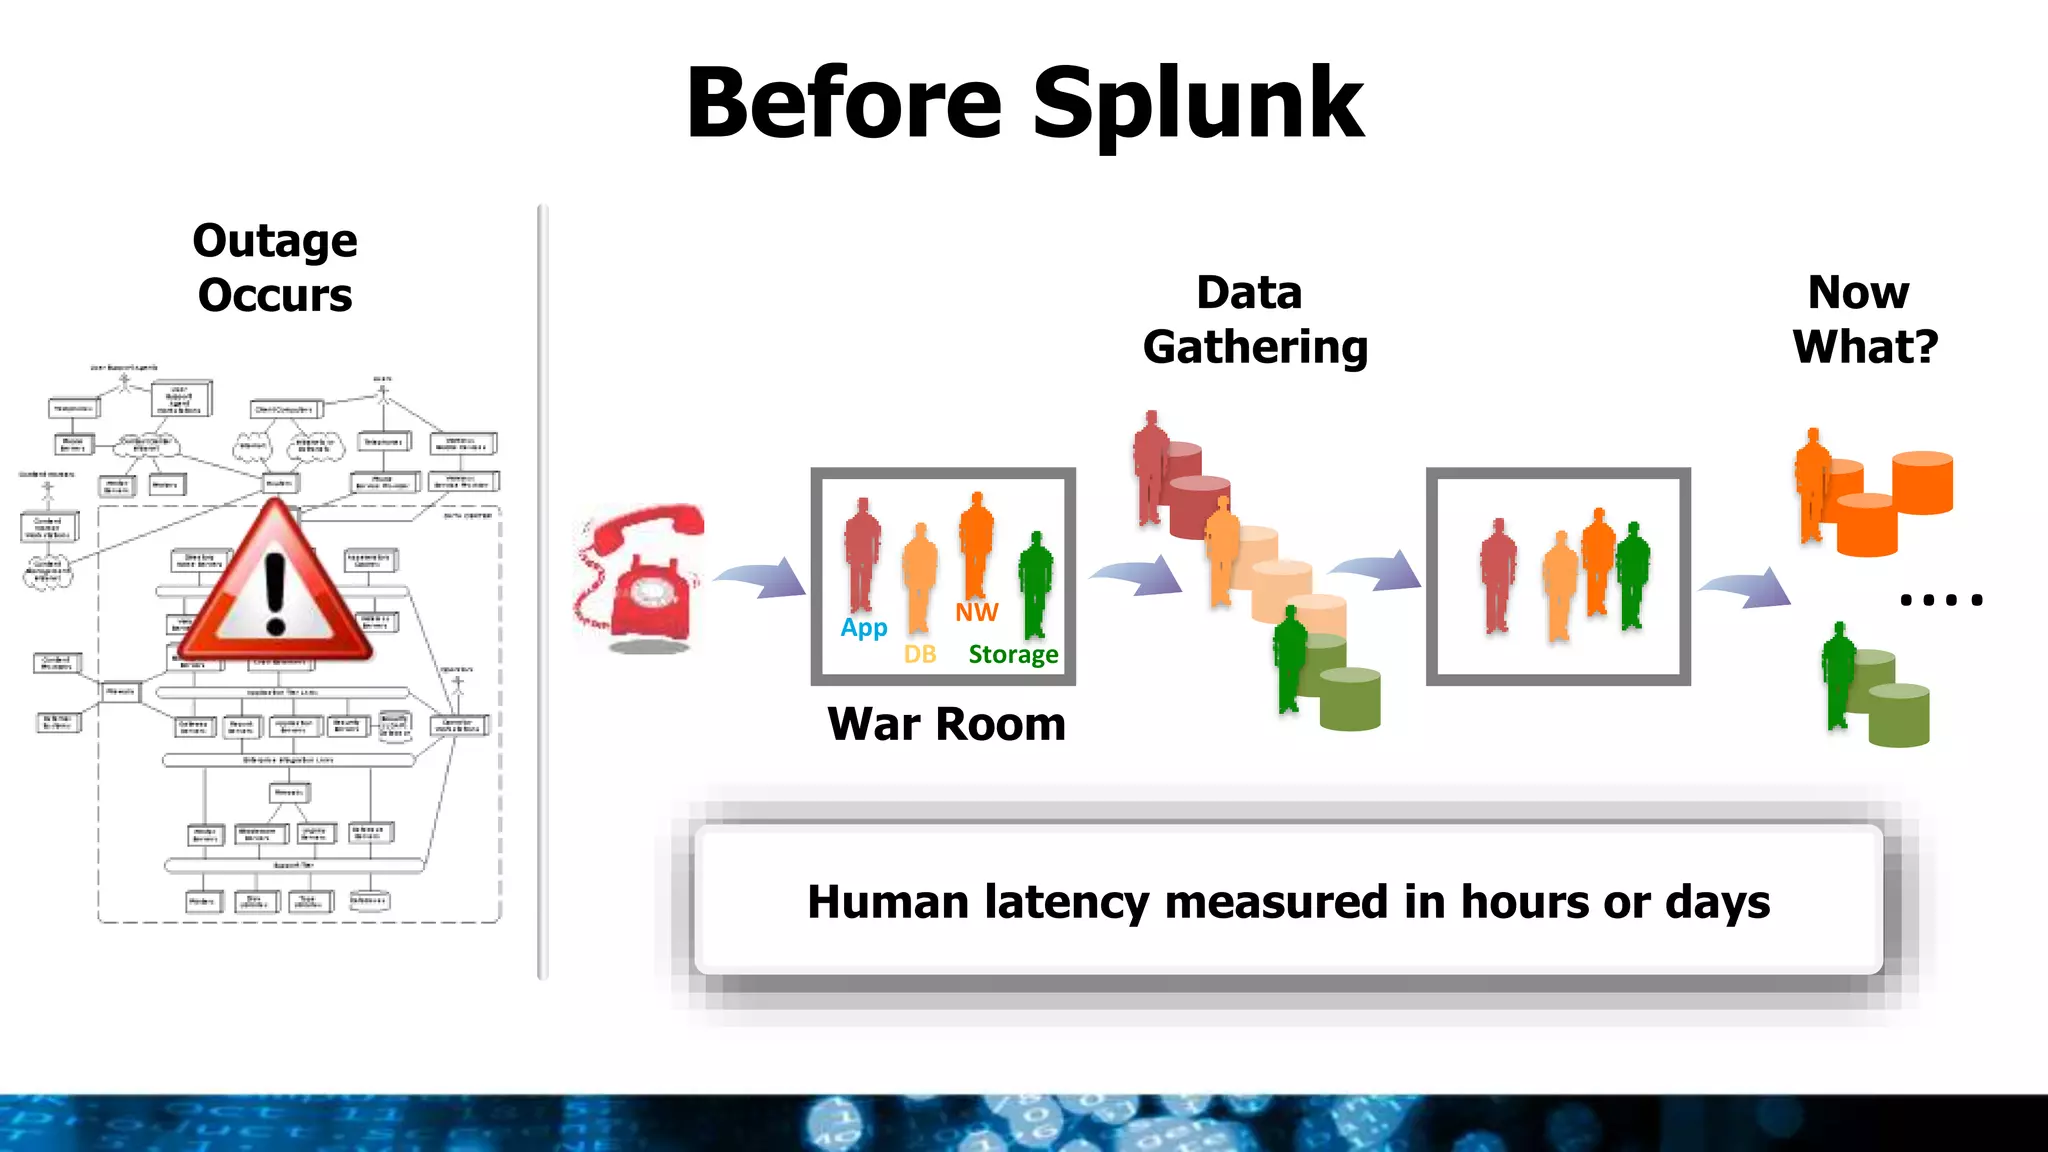
The document discusses Splunk for IT operations (ITOps). It provides an overview of how Splunk can help organizations gain operational intelligence and visibility across their IT infrastructure and applications. Some key points:
- Splunk consolidates machine data from different sources like servers, storage, networking devices, applications etc. into a single platform for monitoring, searching and analyzing data.
- It helps overcome issues of disconnected point solutions, siloed teams and outdated tools that take up majority of IT time for maintenance instead of innovation.
- Splunk provides real-time search capabilities to help IT teams act as "first responders" and reduce problem resolution time from days to minutes by quickly searching across all log data.
SplunkLive! München 2016 - Getting started with SplunkSplunk
This document provides an overview and introduction to Splunk. It discusses what Splunk is, how to get started with Splunk including installing Splunk, indexing data, performing searches, creating alerts and reports. It also covers deployment and integration topics such as scaling Splunk, forwarding data, role-based access controls, and support resources. The document is intended to help users understand the basics of using Splunk to explore and analyze machine data.
SplunkLive! München 2016 - Splunk Enterprise 6.3 - Data OnboardingSplunk
This document discusses new features in Splunk Enterprise 6.3, including breakthrough performance and scale improvements that double search and indexing speed and increase capacity by 20-50%, lowering total cost of ownership by 20%+. It also describes new capabilities for advanced analysis and visualization, high-volume event collection, and an enterprise-scale platform with improved support for DevOps, IoT data analysis, and third-party integrations. A new HTTP Event Collector provides a token-based JSON API for ingesting events from various sources.
SplunkLive! München 2016 - Splunk für SecuritySplunk
This document provides an overview of Splunk's security analytics and user behavior analytics capabilities for detecting threats like cyber attacks and insider threats. It discusses how Splunk uses machine learning and behavioral analytics on large datasets to detect anomalies and threats. Examples are given showing how Splunk can detect suspicious user activities across the cyber kill chain and identify external attacks and insider threats. Key workflows for security analysts and threat hunters using Splunk are also outlined.
This document discusses how Splunk provides operational intelligence through machine data analytics. It highlights how Splunk can help organizations gain visibility into their complex IT operations by indexing data from any source, allowing users to search and investigate that data. The document demonstrates how Splunk can be used to troubleshoot issues, such as identifying servers experiencing high CPU usage or disk space problems. It also shows how to create alerts, reports, and dashboards with Splunk to monitor infrastructure and application health.
The document discusses how Splunk provides a platform for operational intelligence by unifying machine data from various IT systems and applications. It summarizes Splunk's capabilities for monitoring infrastructure components, applications, and virtual environments. The presentation includes an agenda, descriptions of IT complexity challenges and how Splunk addresses them with its platform. It also provides overviews and demonstrations of specific Splunk apps for monitoring Exchange, VMware, NetApp, and other systems.
Getting Started with IT Service IntelligenceSplunk
This document discusses IT service intelligence (ITSI) concepts including defining services, key performance indicators (KPIs), service health scores, and service decomposition. A service can include multiple technology components and tiers that need to be monitored together from a user's perspective. KPIs are Splunk searches that monitor specific metrics like CPU or errors. Health scores from 0-100 indicate a service's status based on KPI status and importance. Entities that support services can come from CMDBs or searches. Services can be decomposed into sub-services and underlying processes to define relevant KPIs for monitoring. Adaptive thresholding and anomaly detection help determine normal vs abnormal behavior in dynamic or patterned data. ITSI allows
Splunk Enterprise for IT Troubleshooting Hands-OnSplunk
This document provides an overview of a Splunk training session. The objectives are to learn basic Splunk navigation, how to extract fields, create alerts, build reports and dashboards, and use Splunk for troubleshooting. Examples are provided of extracting a new field, creating an alert when disk space exceeds a threshold, and building a dashboard to monitor website errors and server CPU usage. The training highlights how Splunk can provide operational intelligence and accelerate ROI by reducing incidents and MTTR. It concludes by mentioning opportunities to learn more about Splunk through free trials, education, and the annual .conf user conference.
Splunk for IT Operations Breakout SessionGeorg Knon
This document discusses how IT complexity is a challenge for CIOs due to siloed technologies, disconnected point solutions, and time spent maintaining rather than innovating. It presents Splunk as a solution that provides comprehensive visibility across infrastructure, applications, databases, and more through centralized data collection and analysis. Splunk reduces problem resolution time by 67% and escalations by 90% by enabling "first responders" to search across all IT data from a single interface. The document also outlines how Splunk apps can provide insights by role and technology and its capabilities for various IT functions like virtualization, storage, and operating systems.
Michael Ronnfeldt of NXP discusses implementing an Analytics and Automation Platform using Splunk to address NXP's challenges. Some key points:
- NXP is a large semiconductor company with many products and divisions facing growing IT needs
- The current situation involves manual, slow monitoring and resolution of issues
- The Analytics and Automation Platform (SNA2P) uses Splunk for automated monitoring, incident detection and remediation, discovery, and centralized reporting to provide faster, better service
- Benefits include incidents being resolved before users notice and automation enforcing security and compliance through change control
- Future roadmap includes expanding the CMDB, deployment automation, test automation, and continuous integration
The document discusses Splunk security solutions including Splunk Enterprise and Splunk User Behavior Analytics (UBA). It begins with an agenda that includes a demo of the Zeus ES security product and a UBA demo. The document then provides an overview of challenges in securing against advanced threats and how Splunk addresses these challenges through security analytics and machine data. Examples are given of how Splunk has helped customers including Nasdaq and PostFinance address security issues. The presentation concludes with a discussion of features in Splunk Enterprise Security 4.0.
Getting started with Splunk Breakout SessionSplunk
This document provides a summary of a presentation about Splunk. It discusses what Splunk is and how it works, including that Splunk is a platform for searching, monitoring, and analyzing machine-generated big data in real-time. It also covers key Splunk concepts like indexing, searching, reporting, alerting, and deployment options. The presentation demonstrates how to install Splunk, add sample data, perform searches, extract fields, create alerts and dashboards, and discusses integration, support resources, and the Splunk developer platform.
Softcat Splunk Discovery Day Manchester, March 2017Splunk
This document provides an agenda for a Splunk conference on March 15th 2017 in Manchester. The agenda includes:
- An introduction and welcome from 09:30-09:45
- Two session from 09:45-12:15 on data-driven IT operations and best practices for security investigations
- A lunch break from 12:30-13:30
- The event concludes at 13:30
Delivering business value from operational insights at ING BankSplunk
The document discusses how ING Bank uses Splunk to extract business value from operational data. It describes several IT use cases like customer pre-scoring, portfolio management, fraud detection and reducing downtime. It also discusses expanding the use of Splunk beyond IT to business cases like customer journey mapping. The document shares details of ING Bank's Splunk implementation, how it migrated systems to Splunk, and future plans to integrate Hadoop and machine learning.
Here’s your chance to get hands-on with Splunk for the first time! Bring your modern Mac, Windows, or Linux laptop and we’ll go through a simple install of Splunk. Then, we’ll load some sample data, and see Splunk in action – we’ll cover searching, pivot, reporting, alerting, and dashboard creation. At the end of this session you’ll have a hands-on understanding of the pieces that make up the Splunk Platform, how it works, and how it fits in the landscape of Big Data. You’ll experience practical examples that differentiate Splunk while demonstrating how to gain quick time to value.
SplunkLive! Wien 2016 - Use Case TTTech ComputertechnikSplunk
TTTech Computertechnik is a globally-oriented high-tech company based in Vienna, Austria with over 400 employees. They provide networking and control solutions for automotive, aerospace, industrial, and off-highway markets. TTTech implemented Splunk in 2015 to address new compliance obligations and improve troubleshooting across their IT infrastructure. Splunk has become integral to their compliance reporting, faster troubleshooting, and centralized monitoring of IT operations. They plan to expand Splunk's use within development and with external partners.
Machine Data 101: Turning Data Into Insight is a presentation about using Splunk software to analyze machine data. It discusses topics such as:
- What machine data is and examples of common sources like log files, social media, call center systems
- How Splunk indexes machine data from various sources in real-time regardless of format
- Techniques for enriching data in Splunk like tags, field aliases, calculated fields, event types, and lookups from external data sources
- Examples of collecting non-traditional data sources into Splunk like network data, HTTP events, databases, and mobile app data
The presentation provides an overview of Splunk's machine data platform and techniques for analyzing, enrich
Best Practices For Sharing Data Across The EnteprriseSplunk
The document discusses best practices for sharing data across an enterprise using Splunk. It provides an overview of Splunk's Business Value Consulting services and common value drivers they have identified for IT operations, security and compliance, and application development. These include reducing incident resolution times, improving security event detection and response times, and accelerating development cycles. It also lists many common data sources that are important for realizing these benefits, such as various log files, network devices, databases, and applications.
This summary provides an overview of a presentation about Splunk:
1. The presentation introduces Splunk, an enterprise software platform that allows users to search, monitor, and analyze machine-generated big data for security, IT and business operations.
2. Key components of Splunk include universal forwarders for data collection, indexers for data storage and search heads for data visualization. Splunk supports data ingestion from various sources like servers, databases, applications and sensors.
3. A demo section shows how to install Splunk, ingest sample data, perform searches, set up alerts and reports. It also covers dynamic field extraction, the search command language and Splunk applications.
The document provides an overview of Splunk IT Service Intelligence (ITSI). Some key points:
- ITSI makes Splunk "service-aware" and provides insights into IT services to help accelerate customers' path to operational intelligence.
- ITSI provides search-based KPIs, full-fidelity service health monitoring, and leverages Splunk's universal data platform to provide a data-driven approach.
- Core concepts in ITSI include services, KPIs, health scores, service analyzers for monitoring services, glass tables dashboards, and deep dives for investigation.
- Notable events are also generated by correlation searches to indicate service degradation.
The document discusses how Splunk provides a platform for operational intelligence through machine data. It outlines Splunk's capabilities including collecting any machine data, powerful search and investigation tools, and proactive monitoring. Splunk accelerates value through apps that provide deep insights into specific technologies like Exchange, VMware, and storage. The document demonstrates how Splunk apps work through demos and discusses how customers are leveraging Splunk to reduce costs and gain operational visibility across their infrastructure.
Attend to learn from our experts about ways to improve you IT Operational Intelligence by using Splunk for troubleshooting, monitoring and service-level visibility. In this hands-on session we will cover recommended approaches for end-to-end troubleshooting and monitoring across applications, OSes, and devices to resolve problems faster, reduce downtime and improve user satisfaction and customer retention. Topics will include: monitoring critical services, using commonly deployed apps and TAs to gather data for IT infrastructure uses, and using of pre-made dashboard panels to quickly build dashboards for monitoring your environment.
SplunkLive! Zürich 2016 - Use Case SwisscomGeorg Knon
Swisscom uses Splunk to gain operational intelligence and visibility into its cloud infrastructure and services. Splunk aggregates data from various systems to provide monitoring, troubleshooting, and license management across Swisscom's complex cloud environment. This centralization with Splunk improves customer experience by enabling faster issue resolution. Going forward, Swisscom aims to leverage Splunk further for predictive analytics and make more operational data accessible to the wider business.
This document discusses how Splunk can help organizations address challenges related to escalating IT complexity. It notes that IT environments have become more complex with disconnected point solutions, over 70% of time spent maintaining rather than innovating, and latency in resolving issues measured in hours or days. Splunk provides a single platform to gather, analyze, and search machine data from various sources in real-time. It allows correlating data across silos for faster problem resolution. The document highlights how Splunk reduced escalations by 90% and mean time to resolution by 67% for one customer. It then discusses how Splunk offers pre-built apps for monitoring different parts of the IT infrastructure and applications.
SplunkLive! Wien 2016 - Splunk Enterprise 6.4Splunk
This document provides an overview of new features in Splunk Enterprise 6.4. Key highlights include:
- New custom visualizations that provide unlimited ways to visualize machine data.
- Enhancements to predictive analytics capabilities like time series forecasting and filling in missing values.
- Storage optimization in Splunk Enterprise that reduces historical data storage costs by 40-80%.
- Expanded cloud services monitoring for AWS, Akamai, and ServiceNow.
- Additional platform security, management, and developer tools.
Getting Started with IT Service IntelligenceSplunk
This document provides an overview of IT Service Intelligence (ITSI) concepts including what a service is, key performance indicators (KPIs), service health scores, and how to set up and use ITSI to monitor IT services. It discusses how to identify and model high-value business services in ITSI by decomposing them into underlying technical services and defining KPIs to monitor each service's health. It also covers features like adaptive thresholding, anomaly detection, multi-KPI alerts, and using notable events to manage incidents. The document concludes with instructions for exploring an ITSI sandbox to build a sample glass table dashboard.
Splunk conf2014 - Dashboard Fun - Creating an Interactive Transaction ProfilerSplunk
Using Simple XML and Splunk Enterprise, learn how to create easy interactive dashboards to explore data. This demo showcases great tools to put ion the hands of Splunk users, help desk users and IT Operations staff.
Splunk for DevOps - Faster Insights - Better CodePhilipp Drieger
Splunk is a platform that allows users to search, monitor, and analyze machine-generated data. It collects data from various sources like servers, applications, sensors, and mobile devices. This document discusses how Splunk can be used for application delivery and DevOps. It provides end-to-end visibility across development pipelines and helps accelerate software development cycles. Splunk also allows monitoring of key performance indicators and troubleshooting of issues in production. Customer case studies demonstrate how Splunk reduced error rates and improved continuous integration.
This document provides an overview of a presentation about Splunk for IT operations. The presentation includes an introduction to Splunk for ITOps and Splunk apps. It discusses how increasing IT complexity is plaguing operations and how Splunk's machine data platform can provide operational intelligence. The presentation also covers Splunk IT Service Intelligence for monitoring IT services and key performance indicators. It provides examples of how customers are using Splunk to increase uptime, reduce mean time to resolution for issues, and improve margins. The presentation concludes with information on an upcoming Splunk user conference.
This document discusses using Splunk to monitor and debug a real-time self-adapting traffic management system. It includes 4 sections that discuss using Splunk to analyze traffic profiles from probe data, monitor errors, system load, and performance measurements. It also provides a tip for using Splunk with Windows Azure and sending data to Splunk over UDP for better efficiency with large data volumes.
Splunk Webinar: Verwandeln Sie Datensilos in Operational IntelligenceGeorg Knon
This document provides an overview and agenda for a Splunk presentation on operational intelligence. It introduces Matthias Maier and Rene Siekermann as today's speakers and includes a safe harbor statement. The agenda covers an overview of operational intelligence, a live demo, use case, and roadmap. It also provides a company overview of Splunk including its products, customers, and ability to collect and analyze machine data from various sources to provide insights.
This document discusses how Varnish can be used for efficient web caching. It provides examples showing how Varnish uses few system calls and milliseconds to serve content from cache. Custom configurations were developed for Bild.de, including paywall integration, image normalization, clustering, and conditional requests to backends. The configurations are generated from Perl scripts to support various server roles and features across Bild.de's infrastructure. However, Bild.de still runs on an older Varnish version and plans are discussed to migrate to the current version.
SplunkLive! München 2016 - Splunk @ UniCreditSplunk
This document provides an overview of UniCredit's Business Activity Monitoring project for payments processes. It discusses the three levels of monitoring - business process, application functionality, and technology infrastructure. The user interface is described, including a tube map entry point and indicators for traffic volume, processing time, and system jams. The development approach uses a test-driven methodology with the Splunk platform. Lessons learned highlight strengths like dashboard functionality but also areas for improvement such as customization and internationalization.
This document discusses how IT complexity is a challenge for CIOs due to siloed technologies, disconnected point solutions, and time spent maintaining rather than innovating. It presents Splunk as a solution that provides comprehensive visibility across infrastructure, applications, and customer-facing data to help reduce problem resolution time and escalations. Specific benefits highlighted include consolidating logs from various systems into a single view, enabling faster identification and resolution of issues. The document also outlines how Splunk apps can provide insights by role and accelerate value through plug-ins and templates to analyze data from any source.
This document discusses how Splunk provides new visibility and analytics for IT operations. It notes that IT environments are becoming increasingly complex with more servers, applications, virtualization, and cloud services. Splunk offers a platform for operational intelligence that can consolidate machine data from various sources and provide search, monitoring, and analytics capabilities. It also discusses how Splunk apps can provide deep insights into specific technology areas.
Delivering New Visibility and Analytics for IT OperationsGabrielle Knowles
The document discusses how Splunk provides visibility and analytics for IT operations. It outlines Splunk's ability to ingest data from various sources like applications, databases, networks and more. This gives organizations a universal platform to gain operational visibility, enable proactive monitoring, and obtain business insights from their machine data in real-time. Splunk differentiators include analyzing all data, scaling for large environments, and reducing MTTR, costs and improving user experiences.
The document discusses how Splunk provides visibility and analytics for IT operations. It describes how Splunk can ingest data from various sources like applications, databases, networks, virtualization and more. This gives organizations operational visibility across their infrastructure and enables proactive monitoring, search and investigation capabilities for troubleshooting and problem solving. Splunk offers a universal platform for machine data that can scale to handle large, complex environments.
The document discusses how Splunk provides visibility and analytics for IT operations. It outlines Splunk's ability to ingest data from various sources like applications, databases, networks and more. This gives organizations a universal platform to gain operational visibility, enable proactive monitoring, and power search and investigation across machine data for improved IT operations and business insights.
Steven Hatch of Cox Automotive discusses how they used Splunk IT Service Intelligence (ITSI) to gain operational visibility into massive amounts of audio, video, network, and storage data from their global auction platforms. This helped them pinpoint issues, improve mean time to identify and resolve incidents, and ensure high customer satisfaction. Splunk ITSI simplified the complex technical details into intelligence through correlating key performance indicators into services and actionable events. It also empowered Cox Automotive to scale infrastructure on demand with cloud solutions and proactively replace equipment. Use of Splunk ITSI reduced auction incidents by 90% with real-time infrastructure monitoring and positively impacted reliability and the bottom line. Next steps include training partners in DevOps
Splunk Discovery Day Düsseldorf 2016 - Splunk für IT OperationsSplunk
This document discusses how IT complexity is increasing due to factors like virtualization, applications, and cloud services. It states that over 70% of IT time is spent on maintenance rather than innovation. The document then introduces Splunk as a platform that provides visibility and analytics for IT operations through capabilities like search, investigation, and monitoring across infrastructure components. It provides summaries of how Splunk can provide insights for different IT roles and optimize areas like security, operations, and applications. Examples are given of how customers have used Splunk for marketing intelligence, revenue insights, and operational intelligence.
Learn from our experts about ways to improve you IT Operational Intelligence by using Splunk for troubleshooting, monitoring and service-level visibility. In this hands-on session we will cover recommended approaches for end-to-end troubleshooting and monitoring across applications, OSes, and devices to resolve problems faster, reduce downtime and improve user satisfaction and customer retention. Topics will include: monitoring critical services, using commonly deployed apps and TAs to gather data for IT infrastructure uses, and using of pre-made dashboard panels to quickly build dashboards for monitoring your environment.
Come and learn from our experts on ways to improve you IT Operational Visibility by using Splunk for monitoring environment health. In this hands-on session we will cover recommended approaches for end to end monitoring, across applications, OSes, and devices. Topics will include: critical services to monitor, use of the Splunk Common Information Model (CIM) for cross-dataset normalization, commonly deployed apps and TAs to gather data for IT infrastructure uses, and use of pre-made dashboard panels to quickly build dashboards for monitoring your environment.
The document provides an overview of Splunk for IT operations (ITOps). It discusses how Splunk can help organizations address escalating IT complexity and issues plaguing IT operations. It introduces Splunk IT Service Intelligence, which provides data-driven service insights for root-cause isolation and improved service operations. Key concepts explained include what a service is, key performance indicators (KPIs), and service health scores. The document also highlights capabilities like service analyzer, glass tables, deep dives, multi-KPI alerts and notable events. Customer stories are presented on how enterprises use Splunk for increased uptime, reduced mean time to resolution, optimized capacity and more.
Splunk Webinar: IT Operations Demo für Troubleshooting & DashboardingGeorg Knon
This document provides an overview of Splunk's IT operations software. It discusses the challenges facing IT operations, including siloed tools and reactive problem solving. It presents Splunk as a solution, with its ability to index and analyze machine data from any source in real-time. Key benefits highlighted include faster troubleshooting to reduce downtime, proactive monitoring to address issues before they become problems, and increased operational visibility across the IT environment. The document concludes with a demonstration of Splunk's IT service intelligence capabilities.
Virtual Gov Day - Application Delivery Breakout - OverviewSplunk
Splunk is an industry-leading platform that allows users to index and search machine-generated data from any source, in any format, at any scale, in real-time and historical. It provides operational intelligence capabilities like search and investigation, proactive monitoring, and real-time business insights. Splunk delivers value across IT operations, security, compliance, fraud detection, application delivery, and business analytics.
Come and learn from our experts on ways to improve you IT Operational Visibility by using Splunk for monitoring environment health. In this hands-on session we will cover recommended approaches for end-to-end monitoring, across applications, OSes, and devices. Topics will include: critical services to monitor, use of the Splunk Common Information Model (CIM) for cross-dataset normalization, commonly deployed apps and TAs to gather data for IT infrastructure uses, and use of pre-made dashboard panels to quickly build dashboards for monitoring your environment.
SplunkLive! Utrecht - Splunk for IT Operations - Rick FitzSplunk
This document discusses how increasing IT complexity from technologies like virtualization, SaaS applications, and custom applications has made IT operations more difficult. It presents Splunk as a solution for capturing data from all IT systems and applications in order to perform operational analytics. This allows organizations to gain insights across their IT infrastructure and applications for tasks like root cause analysis, capacity planning, security monitoring, and service level reporting. The document highlights some of Splunk's key capabilities and differentiators like indexing data once for multiple uses, scaling to large environments, and providing a fast time to value. It also includes two customer examples of how Credit Suisse and Surrey Satellite have benefited from using Splunk for IT operations.
SplunkLive! Wien 2016 - Splunk für IT OperationsSplunk
This document discusses Splunk software for IT operations. It notes that IT environments have become increasingly complex with many different technologies, applications, and data sources. This makes it difficult for IT teams to maintain systems and innovate. Splunk provides a platform to integrate data from all these different sources for real-time search, monitoring, and analytics. It allows organizations to gain insights from their machine data to more quickly resolve issues and improve IT operations and services. The document highlights how Splunk apps can provide deep insights into specific technologies and roles. It also discusses how Splunk can provide visibility into cloud environments like AWS.
SplunkLive Zürich 2016 - Splunk für IT OperationsSplunk
This document discusses Splunk software and how it can be used for IT operations and service intelligence. Some key points:
- Splunk is a platform for machine data that can ingest data from any source and provide real-time search, reporting and analytics. It has no rigid schemas or need for custom connectors.
- Splunk allows organizations to gain operational intelligence across their infrastructure including servers, storage, networking, applications, databases, and cloud services. It provides visibility, monitoring and troubleshooting capabilities.
- Splunk apps provide deep insights into specific technology areas to help IT teams resolve problems faster. Its role-based dashboards consolidate tools and eliminate silos.
- Splunk IT Service Intelligence allows organizations
Attend to learn from our experts about ways to improve you IT Operational Intelligence by using Splunk for troubleshooting, monitoring and service-level visibility. In this hands-on session we will cover recommended approaches for end-to-end troubleshooting and monitoring across applications, OSes, and devices to resolve problems faster, reduce downtime and improve user satisfaction and customer retention. Topics will include: monitoring critical services, using commonly deployed apps and TAs to gather data for IT infrastructure uses, and using of pre-made dashboard panels to quickly build dashboards for monitoring your environment.
SplunkLive! Amsterdam 2015 Breakout - Getting Started with SplunkSplunk
Filip Wijnholds is a senior sales engineer at Splunk who joined the company in June 2015 after working at Intel Security for 4 years. He began his career in the networking industry working with packet capture software. The document provides an overview of Splunk's machine data platform and how it can ingest and analyze data from various sources. It also outlines the company's legal notices regarding forward-looking statements and product roadmaps.
Splunk provides a fully integrated platform for collecting, analyzing, and visualizing machine data from any source. The Splunk App for AWS integrates with AWS services like CloudTrail, Config, and VPC Flow Logs to provide visibility into AWS environments. It collects data from AWS SQS queues and S3 buckets using the AWS SDK. Setting up the Splunk App for AWS requires installing the Splunk Add-on for AWS and configuring permissions for AWS services. Users add their AWS account, and then must wait 5-10 minutes for dashboards and reports to populate with AWS log data.
SplunkLive! Amsterdam 2015 - IT Ops breakoutSplunk
Learn about ways to improve you IT Operational Intelligence by using Splunk for troubleshooting, monitoring and service-level visibility. In this hands-on session we will cover recommended approaches for end-to-end troubleshooting and monitoring across applications, OSes, and devices to resolve problems faster, reduce downtime and improve user satisfaction and customer retention. Topics will include: monitoring critical services, using commonly deployed apps and TAs to gather data for IT infrastructure uses, and using of pre-made dashboard panels to quickly build dashboards for monitoring your environment.
Similar to SplunkLive! München 2016 - Splunk für IT Operations (20)
.conf Go 2023 - Raiffeisen Bank InternationalSplunk
This document discusses standardizing security operations procedures (SOPs) to increase efficiency and automation. It recommends storing SOPs in a code repository for versioning and referencing them in workbooks which are lists of standard tasks to follow for investigations. The goal is to have investigation playbooks in the security orchestration, automation and response (SOAR) tool perform the predefined investigation steps from the workbooks to automate incident response. This helps analysts automate faster without wasting time by having standard, vendor-agnostic procedures.
.conf Go 2023 - Das passende Rezept für die digitale (Security) Revolution zu...Splunk
.conf Go 2023 presentation:
"Das passende Rezept für die digitale (Security) Revolution zur Telematik Infrastruktur 2.0 im Gesundheitswesen?"
Speaker: Stefan Stein -
Teamleiter CERT | gematik GmbH M.Eng. IT-Sicherheit & Forensik,
doctorate student at TH Brandenburg & Universität Dresden
El documento describe la transición de Cellnex de un Centro de Operaciones de Seguridad (SOC) a un Equipo de Respuesta a Incidentes de Seguridad (CSIRT). La transición se debió al crecimiento de Cellnex y la necesidad de automatizar procesos y tareas para mejorar la eficiencia. Cellnex implementó Splunk SIEM y SOAR para automatizar la creación, remediación y cierre de incidentes. Esto permitió al personal concentrarse en tareas estratégicas y mejorar KPIs como tiempos de resolución y correos electrónicos anal
conf go 2023 - El camino hacia la ciberseguridad (ABANCA)Splunk
Este documento resume el recorrido de ABANCA en su camino hacia la ciberseguridad con Splunk, desde la incorporación de perfiles dedicados en 2016 hasta convertirse en un centro de monitorización y respuesta con más de 1TB de ingesta diaria y 350 casos de uso alineados con MITRE ATT&CK. También describe errores cometidos y soluciones implementadas, como la normalización de fuentes y formación de operadores, y los pilares actuales como la automatización, visibilidad y alineación con MITRE ATT&CK. Por último, señala retos
Splunk - BMW connects business and IT with data driven operations SRE and O11ySplunk
BMW is defining the next level of mobility - digital interactions and technology are the backbone to continued success with its customers. Discover how an IT team is tackling the journey of business transformation at scale whilst maintaining (and showing the importance of) business and IT service availability. Learn how BMW introduced frameworks to connect business and IT, using real-time data to mitigate customer impact, as Michael and Mark share their experience in building operations for a resilient future.
The document is a presentation on cyber security trends and Splunk security products from Matthias Maier, Product Marketing Director for Security at Splunk. The presentation covers trends in security operations like the evolution of SOCs, new security roles, and data-centric security approaches. It also provides updates on Splunk's security portfolio including recognition as a leader in SIEM by Gartner and growth in the SIEM market. Maier highlights some breakout sessions from the conference on topics like asset defense, machine learning, and building detections.
Data foundations building success, at city scale – Imperial College LondonSplunk
Universities have more in common with modern cities than traditional places of learning. This mini city needs to empower its citizens to thrive and achieve their ambitions. Operationalising data is key to building critical services; from understanding complex IT estates for smarter decision-making to robust security and a more reliable, resilient student experience. Juan will share his experience in building data foundations for a resilient future whilst enabling digital transformation at Imperial College London.
Splunk: How Vodafone established Operational Analytics in a Hybrid Environmen...Splunk
Learn how Vodafone has provided end-to-end visibility across services by building an Operational Analytics Platform. In this session, you will hear how Stefan and his team manage legacy, on premise, hybrid and public cloud services, and how they are providing a platform for complex triage and debugging to tackle use cases across Vodafone’s extensive ecosystem.
.italo operates an Essential Service by connecting more than 100 million people annually across Italy with its super fast and secure railway. And CISO Enrico Maresca has been on a whirlwind journey of his own.
Formerly a Cyber Security Engineer, Enrico started at .italo as an IT Security Manager. One year later, he was promoted to CISO and tasked with building out – and significantly increasing the maturity level – of the SOC. The result was a huge step forward for .italo.
So how did he successfully achieve this ambitious ask? Join Enrico as he reveals the key insights and lessons learned in his SOC journey, including:
Top challenges faced in improving security posture
Key KPIs implemented in order to measure success
Strategies and approaches applied in the SOC
How MITRE ATT&CK and Splunk Enterprise Security were utilised
Next steps in their maturity journey ahead
This document summarizes a presentation about observability using Splunk. It includes an agenda introducing observability and why Splunk for observability. It discusses the need for modernization initiatives in companies and the thousands of changes required. It presents that Splunk provides end-to-end visibility across metrics, traces and logs to detect, troubleshoot and optimize systems. It shares a customer case study of Accenture using Splunk observability in their hybrid cloud environment. Finally, it concludes that observability with Splunk can drive results like reduced downtime and faster innovation.
This document contains slides from a Splunk presentation covering the following topics:
- Updated Splunk logo and information about meetings in Zurich and sales engineering leads
- Ideas for confused or concerned human figures in design concepts
- Three buckets of challenges around websites slowing, apps being down, and supply chain issues
- Accelerating mean time to detect, identify, respond and resolve through cyber resilience with Splunk
- Unifying security, IT and DevOps teams
- Splunk's technology vision focusing on customer experience, hybrid/edge, unleashing data lakes, and ubiquitous machine learning
- Gaining operational resilience through correlating infrastructure, security, application and user data with business outcomes
This document summarizes a presentation about Splunk's platform. It discusses Splunk's mission of helping customers create value faster with insights from their data. It provides statistics on Splunk's daily ingest and users. It highlights examples of how Splunk has helped customers in areas like internet messaging and convergent services. It also discusses upcoming challenges and new capabilities in Splunk like federated search, flexible indexing, ingest actions, improved data onboarding and management, and increased platform resilience and security.
The document appears to be a presentation from Splunk on security topics. It includes sections on cyber security resilience, the data-centric modern SOC, application monitoring at scale, threat modeling, security monitoring journeys, self-service Splunk infrastructure, the top 3 CISO priorities of risk based alerting, use case development, a security content repository, security PVP (posture, vision, and planning) and maturity assessment, and concludes with an overview of how Splunk can provide end-to-end visibility across an organization.
Removing Uninteresting Bytes in Software FuzzingAftab Hussain
Imagine a world where software fuzzing, the process of mutating bytes in test seeds to uncover hidden and erroneous program behaviors, becomes faster and more effective. A lot depends on the initial seeds, which can significantly dictate the trajectory of a fuzzing campaign, particularly in terms of how long it takes to uncover interesting behaviour in your code. We introduce DIAR, a technique designed to speedup fuzzing campaigns by pinpointing and eliminating those uninteresting bytes in the seeds. Picture this: instead of wasting valuable resources on meaningless mutations in large, bloated seeds, DIAR removes the unnecessary bytes, streamlining the entire process.
In this work, we equipped AFL, a popular fuzzer, with DIAR and examined two critical Linux libraries -- Libxml's xmllint, a tool for parsing xml documents, and Binutil's readelf, an essential debugging and security analysis command-line tool used to display detailed information about ELF (Executable and Linkable Format). Our preliminary results show that AFL+DIAR does not only discover new paths more quickly but also achieves higher coverage overall. This work thus showcases how starting with lean and optimized seeds can lead to faster, more comprehensive fuzzing campaigns -- and DIAR helps you find such seeds.
- These are slides of the talk given at IEEE International Conference on Software Testing Verification and Validation Workshop, ICSTW 2022.
AI 101: An Introduction to the Basics and Impact of Artificial IntelligenceIndexBug
Imagine a world where machines not only perform tasks but also learn, adapt, and make decisions. This is the promise of Artificial Intelligence (AI), a technology that's not just enhancing our lives but revolutionizing entire industries.
HCL Notes and Domino License Cost Reduction in the World of DLAUpanagenda
Webinar Recording: https://www.panagenda.com/webinars/hcl-notes-and-domino-license-cost-reduction-in-the-world-of-dlau/
The introduction of DLAU and the CCB & CCX licensing model caused quite a stir in the HCL community. As a Notes and Domino customer, you may have faced challenges with unexpected user counts and license costs. You probably have questions on how this new licensing approach works and how to benefit from it. Most importantly, you likely have budget constraints and want to save money where possible. Don’t worry, we can help with all of this!
We’ll show you how to fix common misconfigurations that cause higher-than-expected user counts, and how to identify accounts which you can deactivate to save money. There are also frequent patterns that can cause unnecessary cost, like using a person document instead of a mail-in for shared mailboxes. We’ll provide examples and solutions for those as well. And naturally we’ll explain the new licensing model.
Join HCL Ambassador Marc Thomas in this webinar with a special guest appearance from Franz Walder. It will give you the tools and know-how to stay on top of what is going on with Domino licensing. You will be able lower your cost through an optimized configuration and keep it low going forward.
These topics will be covered
- Reducing license cost by finding and fixing misconfigurations and superfluous accounts
- How do CCB and CCX licenses really work?
- Understanding the DLAU tool and how to best utilize it
- Tips for common problem areas, like team mailboxes, functional/test users, etc
- Practical examples and best practices to implement right away
Why You Should Replace Windows 11 with Nitrux Linux 3.5.0 for enhanced perfor...SOFTTECHHUB
The choice of an operating system plays a pivotal role in shaping our computing experience. For decades, Microsoft's Windows has dominated the market, offering a familiar and widely adopted platform for personal and professional use. However, as technological advancements continue to push the boundaries of innovation, alternative operating systems have emerged, challenging the status quo and offering users a fresh perspective on computing.
One such alternative that has garnered significant attention and acclaim is Nitrux Linux 3.5.0, a sleek, powerful, and user-friendly Linux distribution that promises to redefine the way we interact with our devices. With its focus on performance, security, and customization, Nitrux Linux presents a compelling case for those seeking to break free from the constraints of proprietary software and embrace the freedom and flexibility of open-source computing.
GraphSummit Singapore | The Art of the Possible with Graph - Q2 2024Neo4j
Neha Bajwa, Vice President of Product Marketing, Neo4j
Join us as we explore breakthrough innovations enabled by interconnected data and AI. Discover firsthand how organizations use relationships in data to uncover contextual insights and solve our most pressing challenges – from optimizing supply chains, detecting fraud, and improving customer experiences to accelerating drug discoveries.
Full-RAG: A modern architecture for hyper-personalizationZilliz
Mike Del Balso, CEO & Co-Founder at Tecton, presents "Full RAG," a novel approach to AI recommendation systems, aiming to push beyond the limitations of traditional models through a deep integration of contextual insights and real-time data, leveraging the Retrieval-Augmented Generation architecture. This talk will outline Full RAG's potential to significantly enhance personalization, address engineering challenges such as data management and model training, and introduce data enrichment with reranking as a key solution. Attendees will gain crucial insights into the importance of hyperpersonalization in AI, the capabilities of Full RAG for advanced personalization, and strategies for managing complex data integrations for deploying cutting-edge AI solutions.
Threats to mobile devices are more prevalent and increasing in scope and complexity. Users of mobile devices desire to take full advantage of the features
available on those devices, but many of the features provide convenience and capability but sacrifice security. This best practices guide outlines steps the users can take to better protect personal devices and information.
How to Get CNIC Information System with Paksim Ga.pptxdanishmna97
Pakdata Cf is a groundbreaking system designed to streamline and facilitate access to CNIC information. This innovative platform leverages advanced technology to provide users with efficient and secure access to their CNIC details.
Communications Mining Series - Zero to Hero - Session 1DianaGray10
This session provides introduction to UiPath Communication Mining, importance and platform overview. You will acquire a good understand of the phases in Communication Mining as we go over the platform with you. Topics covered:
• Communication Mining Overview
• Why is it important?
• How can it help today’s business and the benefits
• Phases in Communication Mining
• Demo on Platform overview
• Q/A
Sudheer Mechineni, Head of Application Frameworks, Standard Chartered Bank
Discover how Standard Chartered Bank harnessed the power of Neo4j to transform complex data access challenges into a dynamic, scalable graph database solution. This keynote will cover their journey from initial adoption to deploying a fully automated, enterprise-grade causal cluster, highlighting key strategies for modelling organisational changes and ensuring robust disaster recovery. Learn how these innovations have not only enhanced Standard Chartered Bank’s data infrastructure but also positioned them as pioneers in the banking sector’s adoption of graph technology.
Unlock the Future of Search with MongoDB Atlas_ Vector Search Unleashed.pdfMalak Abu Hammad
Discover how MongoDB Atlas and vector search technology can revolutionize your application's search capabilities. This comprehensive presentation covers:
* What is Vector Search?
* Importance and benefits of vector search
* Practical use cases across various industries
* Step-by-step implementation guide
* Live demos with code snippets
* Enhancing LLM capabilities with vector search
* Best practices and optimization strategies
Perfect for developers, AI enthusiasts, and tech leaders. Learn how to leverage MongoDB Atlas to deliver highly relevant, context-aware search results, transforming your data retrieval process. Stay ahead in tech innovation and maximize the potential of your applications.
#MongoDB #VectorSearch #AI #SemanticSearch #TechInnovation #DataScience #LLM #MachineLearning #SearchTechnology
TrustArc Webinar - 2024 Global Privacy SurveyTrustArc
How does your privacy program stack up against your peers? What challenges are privacy teams tackling and prioritizing in 2024?
In the fifth annual Global Privacy Benchmarks Survey, we asked over 1,800 global privacy professionals and business executives to share their perspectives on the current state of privacy inside and outside of their organizations. This year’s report focused on emerging areas of importance for privacy and compliance professionals, including considerations and implications of Artificial Intelligence (AI) technologies, building brand trust, and different approaches for achieving higher privacy competence scores.
See how organizational priorities and strategic approaches to data security and privacy are evolving around the globe.
This webinar will review:
- The top 10 privacy insights from the fifth annual Global Privacy Benchmarks Survey
- The top challenges for privacy leaders, practitioners, and organizations in 2024
- Key themes to consider in developing and maintaining your privacy program
Climate Impact of Software Testing at Nordic Testing DaysKari Kakkonen
My slides at Nordic Testing Days 6.6.2024
Climate impact / sustainability of software testing discussed on the talk. ICT and testing must carry their part of global responsibility to help with the climat warming. We can minimize the carbon footprint but we can also have a carbon handprint, a positive impact on the climate. Quality characteristics can be added with sustainability, and then measured continuously. Test environments can be used less, and in smaller scale and on demand. Test techniques can be used in optimizing or minimizing number of tests. Test automation can be used to speed up testing.
2. CIO Obstacle: Escalating IT Complexity
SERVERS STORAGE NETWORKING
VIRTUALIZATION
INFRASTRUCTURE
APPLICATIONS
PACKAGED
APPLICATIONS
CUSTOM
APPLICATIONS
Identity
VPN
IP Phone
HR
Email
Finance
App Svr
DB
Web Svr SaaS/PaaS
IaaS
3. CIO Obstacle: Escalating IT Complexity
SERVERS STORAGE NETWORKING
VITUALIZATION
INFRASTRUCTURE
APPLICATIONS
PACKAGED
APPLICATIONS
CUSTOM
APPLICATIONS
Identity
VPN
IP Phone
HR
Email
Finance
App Svr
DB
Web Svr SaaS/PaaS
IaaS
Complex, silo-based
technologies
Disconnected and outdated point
solutions
Over 70% of time spent on
maintaining, not innovating
5. From Days to Minutes With Splunk
“First
Responder”
2012-12-05 07:04:44 Id=Rd910EAJ City=New York Email.jdoe@gmail.com
product_id=product_i BD-
66.57.19.112 ..[05/Dec/2012 07:05:22:152]”GET /card.do?action=addtocart
&itemid=K9
[1208/12 02:39:03:209 UTC] 000000c6 ConnectionEve A J2CA00561:
ConnectionExeception:[IBM][CLI Driver] SQL1224N
Report and
analyze
Custom
dashboards
Monitor
and alert
Ad hoc
search
2012-12-05 07:04:44 Id=Rd910EAJ
City=New York Email.jdoe@gmail.com
product_id=product_i BD-
66.57.19.112 ..[05/Dec/2012
07:05:22:152]”GET
/card.do?action=addtocart
&itemid=K9
[1208/12 02:39:03:209 UTC]
000000c6 ConnectionEve A
J2CA00561:
ConnectionExeception:[IBM][CLI
Driver] SQL1224N
Outage
Occurs
6. “Splunk reduced our
escalations by 90% and our
problem resolution time by
67%.
“Escalations reduced by 90% and MTTR dropped by 67%”
Splunk at Service Desk: Vodafone
Paulo Carvalho
Director Operations
Theoldway:DisparateITsilos impactCustomerService
• Manuallyintensive,error-proneprocessesresultinconstantescalationsandlongdelays
• Expensive,home-growntoolsforlogcollectionandanalysisdon’tprovidethecompletepicture
• Disconnectedsystemscreatetroubleinmeetingsecurityandcompliancemandates
Thenewway:Providecomprehensivevisibility andcontrol
✓ Asingle Tier 1support person can now perform iterative searches across alltheir IT data to
investigate, identify, and fixthe problem – escalations reduced by90percent
✓ Splunk consolidates logs from disparate systems into asingle view, providing visibility across end-
to-end service delivery from one place -time to problem resolution dropped by67%
✓ Role-based secure access to logs viaSplunk ensures SOX compliance
✓ Monitor IT data and find issues before they become visible to customers
7. Splunk : The Better Approach For IT
7
Customer
Facing Data
Outside the
Datacenter
Applications
Web logs
Log4J, JMS, JMX
.NET events
Code and scripts
Networking
Configurations
syslog
SNMP
netflow
Databases
Configurations
Audit/query
logs
Tables
Schemas
Virtualization
& Cloud
Hypervisor
Guest OS, Apps
Cloud
Linux/Unix
Configurations
syslog
File system
ps, iostat, top
Windows
Registry
Event logs
File system
sysinternals
Logfiles Configs Messages Traps
Alerts
Metrics Scripts TicketsChanges
Click-stream data
Shopping cart data
Online transaction data
Manufacturing,
logistics…
CDRs & IPDRs
Power consumption
RFID data
GPS data
Powerful, end-to-end, real-time platform for Machine Data
8. Splunk : The Better Approach For IT
8
Customer
Facing Data
Outside the
Datacenter
Applications
Web logs
Log4J, JMS, JMX
.NET events
Code and scripts
Networking
Configurations
syslog
SNMP
netflow
Databases
Configurations
Audit/query
logs
Tables
Schemas
Virtualization
& Cloud
Hypervisor
Guest OS, Apps
Cloud
Linux/Unix
Configuration
s
syslog
File system
ps, iostat, top
Windows
Registry
Event logs
File system
sysinternals
Logfiles Configs Messages Traps
Alerts
Metrics Scripts TicketsChanges
Click-stream data
Shopping cart data
Online transaction data
Manufacturing,
logistics…
CDRs & IPDRs
Power consumption
RFID data
GPS data
Powerful, end-to-end, real-time platform for Machine Data
Noupfrontschema
Nocustomconnectors
NoRDBMS
•Any amount, any location, any source.
11. Reduce Costs: Consolidate tools, eliminate silos, find root cause faster!
Exchange
Admin
Linux/Win
Admin
Network Admin
Applications
Admin
Line of
Business User
Application
Support
VMware/Linux/
Win Admin
Security
Admin
Storage Admin IT
Management
22. What is a Service?
DNS
Requests
Responses
Technical Services
Customer
Transactions
Requests
Responses
Business Services
Auth
Requests
Responses
Web
Requests
Responses
Support Desk
Requests
Responses
23. What is a Service?
Packet Network
Hypervisor and Hosts
RBMDBs
Storage Tier
API Services
Web ServicesCustomerTransactions
Mobile
API/Middleware
PartnerPortal
DNS
24. What is a KPI?
DNS
Requests
Responses
KPI: Number of requests
KPI: Error rate
KPI: Average response time
KPI: Servicer CPU load
KPI: Server network I/F errors
Customer
Transactions
Requests
Responses
KPI: Number of transactions
KPI: Error rate
KPI: Average response time
KPI: Count of Incident Tickets
KPI: Synthetic Transx Health
Welcome to SplunkLive [City].
Thank you for taking the time to attend today’s event.
Company Background:
Vodafone Group Plc is the world's leading mobile telecommunications company, providing a wide range of services including voice and data communications. Paulo Carvalho works in Vodafone's DSSL group supports Vodafone live! Which includes popular mobile video, news, music and other services. Paulo is the Services Network Manager at Vodafone Portugal and is responsible for all services on top of GSM Network, MMS, SMS, Voice Mail, Unified Messaging, streaming, Mobile Portal, VAS Services, Prepaid Services.
Other Notes:
Vodafone uses Splunk for application troubleshooting and management of services they offer over their 3G network. The environment is complex, with many services being offered, running on many platforms and servers - Solaris, Redhat Linux and introducing virtualized environments. They also have a huge Java and J2EE infrastructure and often need to search quickly for errors or exceptions occurring within the last sixty minutes.
Vodafone has been a successful user of Splunk realizing significant material benefits. They have also moved to a proactive phase with Splunk, using it to monitor IT data such as threshold levels for specific systems, and fixing issues before they become visible to their customers.
So how does Splunk help? We offer a powerful, end-to-end, real-time platform for Machine Data. Splunk can collect data from any source, giving our customers real-time visibility and intelligence into what’s happening across the IT infrastructure – whether it’s physical, virtual or in the cloud.
Splunk’s highly capable platform for machine data can handle any machine generated data from any location and any source – without the need to transform the data to fit a schema, without the need for custom connectors-because unlike most other tools on the market, Splunk does not have a database backend. Splunk’s proprietary map-reduce based high speed index and retrieval system allows management of very large quantities of data at scale with just commodity x86 servers.
Welcome to SplunkLive [City].
Thank you for taking the time to attend today’s event.
Remember we said before, that Splunk is a “platform” for machine data? Splunk has evolved over the years from an engine for any kind of machine data to a robust platform, complete with a REST API, 6 different SDKs and numerous “apps” that sit on top of Splunk and provide out of the box value from your data. These “apps” are available on Splunkbase and they accelerate getting g data into Splunk and getting pre-built visualizations for that data. Note that these apps are not like connectors because they don’t lock away the data in a silo or restrict its usage to particular sets of views – the data is in Splunk and can be used side by side with any other data in Splun k. You can move dashboards and key indicators across apps or customize them in any way you want. Apps make it faster to get value out of your data and several key apps provide new visibility into areas that were formerly “black box” in the infrastructure – such as the virtualization apps.
We also recently introduced the 2 new offerings – one to collect wire data, with the Splunk App for Stream (stemming from the acquisition of Cloudmeter) and MINT (Mobile Intelligence) that stems from our acquisition of Bugsense. The Splunk App for Stream enables the capture of real-time streaming wire data, which is the data transmitted between applications over the network. It enables visibility into application, business and user activity without the need for instrumentation, enhancing various operational use cases across IT, security and the business.
And Splunk MINT helps you gain visibility into mobile app performance and quality, so you can deliver better mobile apps
Splunk MINT helps you combine and correlate mobile app data with other data in Splunk so you can pinpoint problems faster and analyze user experience/behavior across mobile, desktop and web channels.
The main value from the apps is providing context for data from silos and making it available inside Splunk for correlation with other data from other silos.
In addition to prebuilt apps, customers can also build their own.
What have developers been building using Splunk Enterprise? Examples include the following:
Run searches and retrieve Splunk data from existing Customer Service/Call Center applications (Comcast use case)
Integrate Splunk data into existing BI tools and dashboard (Tableau, MS Excel)
Build mobile applications with KPI dashboards and alerts powered by Splunk (Otto Group use case)
Log directly to Splunk from remote devices (Bosch use cases)
Build customer-facing dashboards powered by user-specific data in Splunk (Socialize, Hurricane Labs use cases)
Programmatically extract data from Splunk for long-term data warehousing
We hope this is just the beginning. We hope to open up a whole new world of enterprise apps.
Welcome to SplunkLive [City].
Thank you for taking the time to attend today’s event.
That brings us to Splunk IT Service Intelligence – a packaged solution that enables real-time visibility into services driven by machine data.
Splunk ITSI speeds and simplifies service monitoring and analytics and enables IT to make better, smarter and informed business decisions.
This solution allows you to gain a deep understanding of your services. With Splunk ITSI, you have real-time views into the health of your services, and can use advanced analytics to find patterns, detect anomalies and trends to proactively monitor and address issues.
As a result you have improved service visibility, reduced resolution times, and a transformative approach to monitoring and analytics driven by machine-data.
A services can literally be sources of data a customer wants to group together to monitor in a single healthscore or just wants to logically group together because they need to be managed by a specific team or needs to be reported in such a way. Services derive their value when KPIs are defined within them or dependencies are defined to other services. Therefore you could have a more abstractly defined service which only depends on other services to derive its own health. E.g. Partner portal is a conceptual service which depends on the API service which in turn has its own KPIs but depends on Web Services. Alternatively you could have Partner portal depend on each and every one in blue, or not even have all the ones in blue and have all the Kpis be inside Partner portal. Everything you see in the diagram above could be a service in ITSI.
How can you leverage Splunk?
(Optional) Showing Adaptive Thresholding (Time: 3 min)
Opening Tell
Major points/highlights:
Most KPIs are depending on business usage, weekly or daily patterns
Static thresholds must compromise between peak utilization & low-use times
Situation –
IT systems support a particular business need. Based on that business usage, typical utilization patterns emerge. Examples:
Email systems have higher utilization in early office hours
Service Management Systems have higher utilization at the beginning of the week as well as in early office hours
Retail system utilization often reflects seasonality or active promotions
Trading Systems consume most resources during stock market hours
Human Resource Systems may sit almost idle for the majority of the month unless Payroll data is being processed
Static thresholds like those found in most monitoring systems are typically tuned to deliver accurate results during peak system usage, ignoring issues and leading indication during idle times.
Adaptive thresholds on the other hand learn “typical” application behavior. They can adjust to various business patterns and still detect irregular behavior or exceptions during low-use times because they have a more granular threshold definition. This threshold definition takes past behavior into account and overlays it with a comparable timeframe.
Highlight –
2 Components
System Learning of Past behavior
Time Windows to apply these thresholds
Show (Demo)
We’ll be looking at the service, "Web service”, "Corporate Web Site Successful Transactions” KPI.
Applying simple thresholds against KPI metrics is sometimes helpful, but most metrics in the "real world" vary cyclically, according to human activities. ITSI allows more sophisticated thresholding, including time-based and adaptive, based on range, quantile and standard deviation methods.
Note that the template "2-hour blocks every day (adaptive/stdev) is selected"
A number of templates are available, or custom templates can be created.
After you have chosen your thresholding template, you can either set your thresholds manually or use Adaptive Thresholding
<Click Apply Adaptive Thresholding>
Thus, thresholds can adapt to the real-world behavior of the data. We've only just seen the tip of the iceberg here; the point is that ITSI allows a variety of sophisticated thresholding approaches, to track the health of the metric in realistic and actionable ways.
Additional points (optional):
Explain the differences between Static, Standard Deviation, Quantile, and Range based approaches
Explain that you can still take advantage of adaptive thresholds even if you don’t feel comfortable with resetting the thresholds automatically on a daily basis. This can be done by using the Std Deviations, Range or Quantile based approach to initially calculate the thresholds but then toggling them back to static. This way the algorithm uses the past data to come up with the “best/adaptive” thresholds but your keep control on when they need to be updated.
Closing Tell
In a couple minutes we’ve build a threshold based system that allows to find issues in low-use times (something they most likely don’t do today).
We've shown adaptive methods to determine standard system behavior and calculate threshold suggestions without being familiar with the usage patterns of this KPI
We’ve shown how these thresholds can be adjusted based on new usage behavior without admins or experts having to get involved