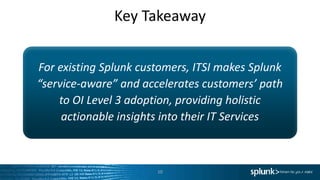
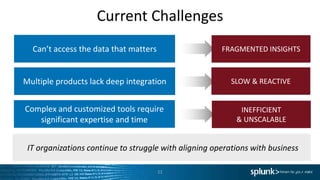
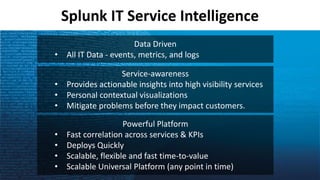
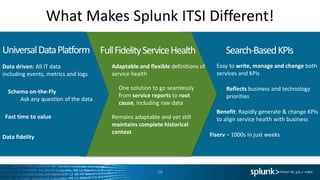
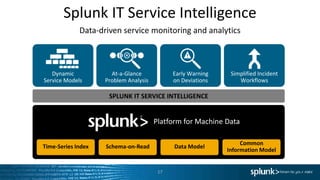
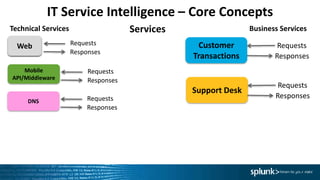
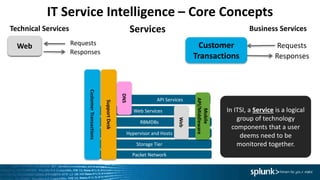
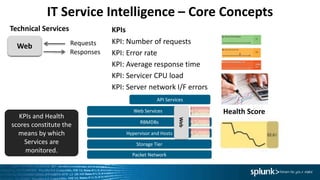
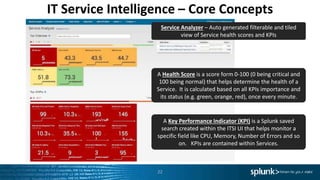
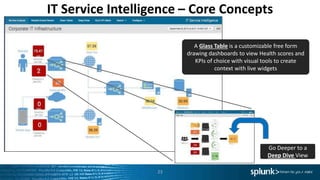
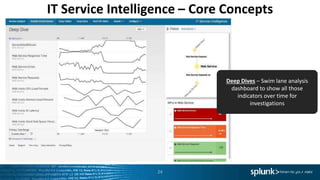
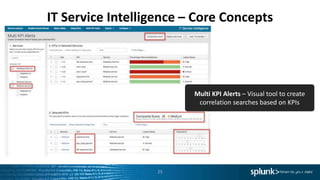
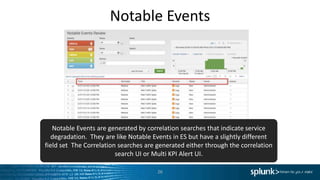
Splunk Enterprise Security (ES) ist eine SIEM-Lösung, die Einblicke in von Sicherheitstechnologien erzeugte Maschinendaten wie Angaben über Netzwerke, Endpunkte, Zugriffe, Schadsoftware, Schwachstellen sowie Identitätsdaten liefert. Sicherheitsteams können damit interne und externe Angriffe schnell erkennen und abwehren und somit das Threat Management vereinfachen, Risiken minimieren und Ihr Unternehmen schützen. Splunk Enterprise Security strafft sämtliche Aspekte von Sicherheitsprozessen und eignet sich für Unternehmen jeder Größe und Expertise.
Building Service Intelligence with Splunk IT Service Intelligence (ITSI) Splunk
Providing transformational impact and insight into key business services while maintaining operational oversight is often difficult in organizations. To effectively communicate business value and alignment organizations must find new methods to bridge the gap between business and operations. This half-day hands on workshop demonstrates how customers can quickly gain insight into high-value services while aligning business and IT Operations using Splunk’s IT Service Intelligence solution. By leveraging the machine data you are already collecting the exercise provides a transformational method to model high-value services and rapidly build custom visualizations and dashboards. From executive leaders to administrators these personalized service-centric views provide powerful analytics and machine learning to transform service intelligence across your organization.
Come experience how you can transform service intelligence in your organization.
If you are looking to gain all the benefits of Splunk software with all the benefits of a cloud-service, this is a must-attend session. In this session learn why Splunk Cloud is the industry-leading SaaS platform for operational intelligence and hear how Splunk Cloud customers use Splunk software with zero operational overhead. You will also learn how Splunk Cloud offers the full feature set of Splunk Enterprise, access to 500+ apps and single pane-of-glass visibility across Splunk Cloud and Splunk Enterprise deployments.
Splunk Tutorial for Beginners - What is Splunk | EdurekaEdureka!
This Splunk tutorial will help you understand what is Splunk, benefits of using Splunk, Splunk vs ELK vs Sumo Logic, Splunk architecture - Splunk Forwarder, Indexer and Search Head with the help of Dominos use-case, Splunk careers & jobs. Check the Splunk tutorial video here: https://www.youtube.com/watch?v=Ekai8Ln11Iw. You can also read the tutorial blog here: https://goo.gl/eoZFWV.
The slides consist of following topics:
Need for Data Management & Analytics
What is Splunk and Why Splunk?
Splunk vs ELK vs Sumo Logic
Splunk Use Case: Domino's
How Splunk Works? Splunk Architecture
Heavy Forwarders
Splunk Architecture Diagram
Splunk Jobs & Careers
Splunk for Enterprise Security and User Behavior AnalyticsSplunk
This session will review Splunk’s two premium solutions for information security organizations: Splunk for Enterprise Security (ES) and Splunk User Behavior Analytics (UBA). Splunk ES is Splunk's award-winning security intelligence solution that brings immediate value for continuous monitoring across SOC and incident response environments – allowing you to quickly detect and respond to external and internal attacks, simplifying threat management while decreasing risk. Splunk UBA is a new technology that applies unsupervised machine learning and data science to solving one of the biggest problems in information security today: insider threat. You’ll learn how Splunk UBA works in tandem with ES, or third-party data sources, to bring significant automated analytical power to your SOC and Incident Response teams. We’ll discuss each solution and see them integrated and in action through detailed demos.
How to Design, Build and Map IT and Business Services in SplunkSplunk
Your IT department supports critical business functions, processes and products. You're most effective when your technology initiatives are closely aligned and measured with specific business objectives. This session covers best practices and techniques for designing and building an effective service model, using the domain knowledge of your experts and capturing and reporting on key metrics that everyone can understand. We will design a sample service model and map them to performance indicators to track operational and business objectives. We will also show you how to make Splunk service-ware with Splunk IT Service Intelligence (ITSI).
Here’s your chance to get hands-on with Splunk for the first time! Bring your modern Mac, Windows, or Linux laptop and we’ll go through a simple install of Splunk. Then, we’ll load some sample data, and see Splunk in action – we’ll cover searching, pivot, reporting, alerting, and dashboard creation. At the end of this session you’ll have a hands-on understanding of the pieces that make up the Splunk Platform, how it works, and how it fits in the landscape of Big Data. You’ll experience practical examples that differentiate Splunk while demonstrating how to gain quick time to value.
Getting Started With Splunk It Service IntelligenceSplunk
Are you currently using Splunk to troubleshoot and monitor your IT environment? Do you want more out of Splunk but don’t know how? Here’s your chance to learn more about Splunk IT Service Intelligence (Splunk ITSI) and get hands-on with it for the very first time. We’ll kick off this session with a discussion on the concept of services, KPIs and entities and demonstrate how to use them in Splunk IT Service Intelligence. We’ll help you build custom visualizations and dashboards for personalized service-centric views. We’ll teach you how to navigate across multiple KPIs, entities and events with built-in visualizations and intelligently troubleshoot and resolve problems faster using Splunk ITSI. We’ll also show you how to create correlations across KPIs easily and be alerted of “notable events” to catch these emerging problems quickly. At the end of this session, you will leave with an understanding of the unique monitoring approach Splunk ITSI delivers to maximize the value of your data in Splunk and how to accelerate visibility into your critical IT services.
Taking Splunk to the Next Level - ArchitectureSplunk
This session led by Michael Donnelly will teach you how to take your Splunk deployment to the next level. Learn about Splunk high availability architectures with Splunk Search Head Clustering and Index Replication. Additionally, learn how to manage your deployment with Splunk’s operational and management controls to manage Splunk capacity and end user experience
Splunk is like an iceberg, on the surface we see the major components: indexers, search heads, license master, cluster master but under the water line we have a huge number of forwarders collecting and aggregating data streams. These forwarders are the foundations of any installation and configuration issues translate into problems with alerts, search performance, cluster stability and scaling out. This talk shows you to various ways to measure the efficiency of data collection and how to improve it. Prepare for lots of complex searches to identify common problems and charts that show good and bad. The talk aims to revolutionise how you think about forwarders and data collection in Splunk and turbo charge your platform performance and improve stability.
Attend to learn from our experts about ways to improve you IT Operational Intelligence by using Splunk for troubleshooting, monitoring and service-level visibility. In this hands-on session we will cover recommended approaches for end-to-end troubleshooting and monitoring across applications, OSes, and devices to resolve problems faster, reduce downtime and improve user satisfaction and customer retention. Topics will include: monitoring critical services, using commonly deployed apps and TAs to gather data for IT infrastructure uses, and using of pre-made dashboard panels to quickly build dashboards for monitoring your environment.
Come and learn from our experts on ways to improve you IT Operational Visibility by using Splunk for monitoring environment health. In this hands-on session we will cover recommended approaches for end to end monitoring, across applications, OSes, and devices. Topics will include: critical services to monitor, use of the Splunk Common Information Model (CIM) for cross-dataset normalization, commonly deployed apps and TAs to gather data for IT infrastructure uses, and use of pre-made dashboard panels to quickly build dashboards for monitoring your environment.
How to Design, Build and Map IT and Business Services in SplunkSplunk
Your IT department supports critical business functions, processes and products. You're most effective when your technology initiatives are closely aligned and measured with specific business objectives. This session covers best practices and techniques for designing and building an effective service model, using the domain knowledge of your experts and capturing and reporting on key metrics that everyone can understand. We will design a sample service model and map them to performance indicators to track operational and business objectives. We will also show you how to make Splunk service-ware with Splunk IT Service Intelligence (ITSI).
Splunk for Industrial Data and the Internet of Thingsaliciasyc
The IoT is a natural evolution of the world’s networks. Just as people became more connected by devices and applications during the explosion of the social media revolution, devices, sensors and industrial equipment are also becoming more connected—and are consuming and generating data at an unprecedented pace. Disparate and deployed connected devices can provide a unique touchpoint to real-world operations and conditions. Only few architectures and applications are designed to handle the constant streams of real-time events, sensor readings, user interactions and application data produced by massive numbers of connected devices. Use Splunk to collect, index and harness the power of the machine data generated by connected devices and machines deployed on your local network or around the world.
SplunkLive! Stockholm 2015 breakout - Splunk IT Service IntelligenceSplunk
Splunk's new Premium App offering, Splunk IT Service Intelligence, is full of exciting new features and functionality to enable the data-driven enterprise to monitor, alert on, and visualize these services in several new ways, including flexible free-form dashboards called "Glass Tables." Join us in this session to explore the versatility of the Glass Tables feature, discuss best practices around creating valuable and compelling Glass Tables for IT operations and business users, and inspect several examples of purpose-built Glass Tables.
Here’s your chance to get hands-on with Splunk for the first time! Bring your modern Mac, Windows, or Linux laptop and we’ll go through a simple install of Splunk. Then, we’ll load some sample data, and see Splunk in action – we’ll cover searching, pivot, reporting, alerting, and dashboard creation. At the end of this session you’ll have a hands-on understanding of the pieces that make up the Splunk Platform, how it works, and how it fits in the landscape of Big Data. You’ll experience practical examples that differentiate Splunk while demonstrating how to gain quick time to value.
What is Splunk? At the end of this session you’ll have a high-level understanding of the pieces that make up the Splunk Platform, how it works, and how it fits in the landscape of Big Data. You’ll see practical examples that differentiate Splunk while demonstrating how to gain quick time to value.
How to Move from Monitoring to Observability, On-Premises and in a Multi-Clou...Splunk
With the acceleration of customer and business demands, site reliability engineers and IT Ops analysts now require operational visibility into their entire architecture, something that traditional APM tools, dev logging tools, and SRE tools aren’t equipped to provide. Observability enables you to inspect and understand your IT stack on premises and in the cloud(s); It’s no longer about whether your system works (monitoring), but being able to task why it is not working? (Observability). This presentation will outline key steps to take to move from monitoring to observability.
An overview of Splunk Enterprise 6.3. Presented by Splunk's Jim Viegas at GTRI's Splunk Tech Day, December 8, 2015.
Visit http://www.gtri.com/ for more information.
SplunkLive! Amsterdam 2015 - IT Ops breakoutSplunk
Learn about ways to improve you IT Operational Intelligence by using Splunk for troubleshooting, monitoring and service-level visibility. In this hands-on session we will cover recommended approaches for end-to-end troubleshooting and monitoring across applications, OSes, and devices to resolve problems faster, reduce downtime and improve user satisfaction and customer retention. Topics will include: monitoring critical services, using commonly deployed apps and TAs to gather data for IT infrastructure uses, and using of pre-made dashboard panels to quickly build dashboards for monitoring your environment.
Splunk IT Service Intelligence for NationwideSplunk
Splunk IT Service Intelligence is a next-generation monitoring and analytics solution that provides new levels of visibility into the health and key performance indicators of IT services.
Webinar Big Data zur Echtzeit-Betrugserkennung im eBanking nutzen mit Splunk ...Georg Knon
In diesem Webinar zeigen wir Ihnen, wie Fraud Detection in diesem Umfeld funktioniert:
- Echtzeit-Überwachungsservice
- Neue Einblicke in die Geschäftstätigkeit
- Offene Schnittstelle für interne und externe Systeme
- Automatisierte Reaktion auf Unregelmässigkeiten
- Verdächtige IP Adressen können blockiert werden
- Betroffene Transaktionen umgehend stornieren
- Betroffene Konten sowie Transaktionen können gesperrt und der Endkunde über den Vorfall informiert werden
Transcript: Selling digital books in 2024: Insights from industry leaders - T...BookNet Canada
The publishing industry has been selling digital audiobooks and ebooks for over a decade and has found its groove. What’s changed? What has stayed the same? Where do we go from here? Join a group of leading sales peers from across the industry for a conversation about the lessons learned since the popularization of digital books, best practices, digital book supply chain management, and more.
Link to video recording: https://bnctechforum.ca/sessions/selling-digital-books-in-2024-insights-from-industry-leaders/
Presented by BookNet Canada on May 28, 2024, with support from the Department of Canadian Heritage.
Connector Corner: Automate dynamic content and events by pushing a buttonDianaGray10
Here is something new! In our next Connector Corner webinar, we will demonstrate how you can use a single workflow to:
Create a campaign using Mailchimp with merge tags/fields
Send an interactive Slack channel message (using buttons)
Have the message received by managers and peers along with a test email for review
But there’s more:
In a second workflow supporting the same use case, you’ll see:
Your campaign sent to target colleagues for approval
If the “Approve” button is clicked, a Jira/Zendesk ticket is created for the marketing design team
But—if the “Reject” button is pushed, colleagues will be alerted via Slack message
Join us to learn more about this new, human-in-the-loop capability, brought to you by Integration Service connectors.
And...
Speakers:
Akshay Agnihotri, Product Manager
Charlie Greenberg, Host
Accelerate your Kubernetes clusters with Varnish CachingThijs Feryn
A presentation about the usage and availability of Varnish on Kubernetes. This talk explores the capabilities of Varnish caching and shows how to use the Varnish Helm chart to deploy it to Kubernetes.
This presentation was delivered at K8SUG Singapore. See https://feryn.eu/presentations/accelerate-your-kubernetes-clusters-with-varnish-caching-k8sug-singapore-28-2024 for more details.
Builder.ai Founder Sachin Dev Duggal's Strategic Approach to Create an Innova...Ramesh Iyer
In today's fast-changing business world, Companies that adapt and embrace new ideas often need help to keep up with the competition. However, fostering a culture of innovation takes much work. It takes vision, leadership and willingness to take risks in the right proportion. Sachin Dev Duggal, co-founder of Builder.ai, has perfected the art of this balance, creating a company culture where creativity and growth are nurtured at each stage.
Key Trends Shaping the Future of Infrastructure.pdfCheryl Hung
Keynote at DIGIT West Expo, Glasgow on 29 May 2024.
Cheryl Hung, ochery.com
Sr Director, Infrastructure Ecosystem, Arm.
The key trends across hardware, cloud and open-source; exploring how these areas are likely to mature and develop over the short and long-term, and then considering how organisations can position themselves to adapt and thrive.
JMeter webinar - integration with InfluxDB and GrafanaRTTS
Watch this recorded webinar about real-time monitoring of application performance. See how to integrate Apache JMeter, the open-source leader in performance testing, with InfluxDB, the open-source time-series database, and Grafana, the open-source analytics and visualization application.
In this webinar, we will review the benefits of leveraging InfluxDB and Grafana when executing load tests and demonstrate how these tools are used to visualize performance metrics.
Length: 30 minutes
Session Overview
-------------------------------------------
During this webinar, we will cover the following topics while demonstrating the integrations of JMeter, InfluxDB and Grafana:
- What out-of-the-box solutions are available for real-time monitoring JMeter tests?
- What are the benefits of integrating InfluxDB and Grafana into the load testing stack?
- Which features are provided by Grafana?
- Demonstration of InfluxDB and Grafana using a practice web application
To view the webinar recording, go to:
https://www.rttsweb.com/jmeter-integration-webinar
Slack (or Teams) Automation for Bonterra Impact Management (fka Social Soluti...Jeffrey Haguewood
Sidekick Solutions uses Bonterra Impact Management (fka Social Solutions Apricot) and automation solutions to integrate data for business workflows.
We believe integration and automation are essential to user experience and the promise of efficient work through technology. Automation is the critical ingredient to realizing that full vision. We develop integration products and services for Bonterra Case Management software to support the deployment of automations for a variety of use cases.
This video focuses on the notifications, alerts, and approval requests using Slack for Bonterra Impact Management. The solutions covered in this webinar can also be deployed for Microsoft Teams.
Interested in deploying notification automations for Bonterra Impact Management? Contact us at sales@sidekicksolutionsllc.com to discuss next steps.
Kubernetes & AI - Beauty and the Beast !?! @KCD Istanbul 2024Tobias Schneck
As AI technology is pushing into IT I was wondering myself, as an “infrastructure container kubernetes guy”, how get this fancy AI technology get managed from an infrastructure operational view? Is it possible to apply our lovely cloud native principals as well? What benefit’s both technologies could bring to each other?
Let me take this questions and provide you a short journey through existing deployment models and use cases for AI software. On practical examples, we discuss what cloud/on-premise strategy we may need for applying it to our own infrastructure to get it to work from an enterprise perspective. I want to give an overview about infrastructure requirements and technologies, what could be beneficial or limiting your AI use cases in an enterprise environment. An interactive Demo will give you some insides, what approaches I got already working for real.
LF Energy Webinar: Electrical Grid Modelling and Simulation Through PowSyBl -...DanBrown980551
Do you want to learn how to model and simulate an electrical network from scratch in under an hour?
Then welcome to this PowSyBl workshop, hosted by Rte, the French Transmission System Operator (TSO)!
During the webinar, you will discover the PowSyBl ecosystem as well as handle and study an electrical network through an interactive Python notebook.
PowSyBl is an open source project hosted by LF Energy, which offers a comprehensive set of features for electrical grid modelling and simulation. Among other advanced features, PowSyBl provides:
- A fully editable and extendable library for grid component modelling;
- Visualization tools to display your network;
- Grid simulation tools, such as power flows, security analyses (with or without remedial actions) and sensitivity analyses;
The framework is mostly written in Java, with a Python binding so that Python developers can access PowSyBl functionalities as well.
What you will learn during the webinar:
- For beginners: discover PowSyBl's functionalities through a quick general presentation and the notebook, without needing any expert coding skills;
- For advanced developers: master the skills to efficiently apply PowSyBl functionalities to your real-world scenarios.
"Impact of front-end architecture on development cost", Viktor TurskyiFwdays
I have heard many times that architecture is not important for the front-end. Also, many times I have seen how developers implement features on the front-end just following the standard rules for a framework and think that this is enough to successfully launch the project, and then the project fails. How to prevent this and what approach to choose? I have launched dozens of complex projects and during the talk we will analyze which approaches have worked for me and which have not.
2. Safe Harbor Statement
During the course of this presentation, we may make forward looking statements regarding future events
or the expected performance of the company. We caution you that such statements reflect our current
expectations and estimates based on factors currently known to us and that actual events or results could
differ materially. For important factors that may cause actual results to differ from those contained in our
forward-looking statements, please review our filings with the SEC. The forward-looking statements
made in this presentation are being made as of the time and date of its live presentation. If reviewed
after its live presentation, this presentation may not contain current or accurate information. We do not
assume any obligation to update any forward looking statements we may make. In addition, any
information about our roadmap outlines our general product direction and is subject to change at any
time without notice. It is for informational purposes only and shall not be incorporated into any contract
or other commitment. Splunk undertakes no obligation either to develop the features or functionality
described orto includeany suchfeatureor functionalityina futurerelease.
3. Company (NASDAQ: SPLK)
● Founded 2004, first software release in 2006
● HQ: San Francisco / Regional HQ: London, Hong
Kong
● Over 1,800 employees, based in 12 countries
Business Model / Products
● Free download to massive scale
● Splunk Enterprise, Splunk Cloud, Splunk Light
● Hunk: Splunk Analytics for Hadoop
10,000+ Customers
● Customers in 100 countries
● 80+ of the Fortune 100
● Largest license: Over 400 Terabytes per day
3
4. Fully-integrated Enterprise Platform
4
Enterprise
Scale & HA
Secure
Operation
Splunk Apps
Developer
SDKs/API
Enterprise
Integration
Any Data
Any Source
Collect &
Index Data
Search &
Investigate
Monitor
& Alert
Visualize
& Report
Correlate
& Analyze
Access
Anywhere
Manage
Operations
Platform for Operational Intelligence
5. Turn Machine Data into Operational Intelligence
INDEX ANY MACHINE DATA: ANY SOURCE, TYPE, VOLUME
Online
Services Web
Services
Servers
Security GPS
Location
Storage
Desktops
Networks
Packaged
Applications
Custom
ApplicationsMessaging
Telecoms
Online
Shopping
Cart
Web
Clickstreams
Databases
Energy
Meters
Call Detail
Records
Smartphones
and Devices
RFID
On-
Premises
Private
Cloud
Public
Cloud
GAIN REAL-TIME VISIBILITY
Application Delivery
Security and
Compliance
Infrastructure
Monitoring
Business Analytics
Internet of Things
5
6. Industry Leading Platform For Machine Data
Machine Data: Any Location, Type, Volume
Online
Services Web
Services
Servers
Security GPS
Location
Storage
Desktops
Networks
Packaged
Applications
Custom
ApplicationsMessaging
Telecoms
Online
Shopping
Cart
Web
Clickstreams
Databases
Energy
Meters
Call Detail
Records
Smartphones
and Devices
RFID
On-
Premises
Private
Cloud
Public
Cloud
Platform Support (Apps / API / SDKs)
Enterprise Scalability
Universal Indexing
Answer Any Question
Developer
Platform
Report
and
analyze
Custom
dashboards
Monitor
and alert
Ad hoc
search
Any amount, any location, any source
Schema-
on-the-fly
Universal
indexing
No
back-end
RDBMS
No need
to filter
data
6
7. Turning Machine Data Into Operational Intelligence
Reactive
Search
and
Investigate
Proactive
Monitoring
and Alerting
Operational
Visibility
Proactive
Real-time
Business
Insight
7
8. Mainframe
Data
VMware
Platform for Machine Data
The Splunk Portfolio
Exchange PCISecurity
Relational
Databases
MobileForwarders
Syslog /
TCP / Other
Sensors &
Control Systems
Across Data Sources, Use Cases & Consumption Models
Wire
Data
8
Service
Intel
Splunk Premium Apps Rich Ecosystem of Apps
IT SI
10. Key Takeaway
For existing Splunk customers, ITSI makes Splunk
“service-aware” and accelerates customers’ path
to OI Level 3 adoption, providing holistic
actionable insights into their IT Services
10
11. Current Challenges
11
Can’t access the data that matters
Multiple products lack deep integration
Complex and customized tools require
significant expertise and time
IT organizations continue to struggle with aligning operations with business
FRAGMENTED INSIGHTS
SLOW & REACTIVE
INEFFICIENT
& UNSCALABLE
12. Even More Challenges
12
Increased Business Expectations around – IT Agility, Availability, and Support
I am measured on service performance KPI’s focus on components
As services change, I need to quickly adapt
Previous attempts to model
service failed
I need to understand what is going on at
any point in time (including history)
Snapshots in time don’t help
with troubleshooting or
continuous improvement
13. Splunk IT Service Intelligence
13
Data Driven
• All IT Data - events, metrics, and logs
Service-awareness
• Provides actionable insights into high visibility services
• Personal contextual visualizations
• Mitigate problems before they impact customers.
Powerful Platform
• Fast correlation across services & KPIs
• Deploys Quickly
• Scalable, flexible and fast time-to-value
• Scalable Universal Platform (any point in time)
14. IT Service Intelligence
Data-driven insights
for root cause isolation and
improved service awareness
with a marketing catchphrase
that is really long
16. What Makes Splunk ITSI Different!
16
Search-BasedKPIs
Easy to write, manage and change both
services and KPIs
Reflects business and technology
priorities
Benefit: Rapidly generate & change KPIs
to align service health with business
Fiserv – 1000s in just weeks
FullFidelityServiceHealth
Adaptable and flexible definitions of
service health
One solution to go seamlessly
from service reports to root
cause, including raw data
Remains adaptable and yet still
maintains complete historical
context
UniversalDataPlatform
Data driven: All IT data
including events, metrics and logs
Schema on-the-Fly
Ask any question of the data
Fast time to value
Data fidelity
17. Splunk IT Service Intelligence
Data-driven service monitoring and analytics
17
SPLUNK IT SERVICE INTELLIGENCE
Time-Series Index
Platform for Machine Data
Dynamic
Service Models
Schema-on-Read Data Model
Common
Information Model
At-a-Glance
Problem Analysis
Early Warning
on Deviations
Simplified Incident
Workflows
19. IT Service Intelligence – Core Concepts
Service Requests
Responses
Web
Technical Services Services
Requests
Responses
Mobile
API/Middleware
Requests
Responses
DNS
Support Desk
Requests
Responses
Customer
Transactions
Requests
Responses
Business Services
20. Packet Network
Hypervisor and Hosts
RBMDBs
Storage Tier
API Services
Web Services In ITSI, a Service is a logical
group of technology
components that a user
deems need to be
monitored together.
IT Service Intelligence – Core Concepts
Service Requests
Responses
Web
Technical Services Services
CustomerTransactions
Web
Customer
Transactions
Requests
Responses
Business Services
Mobile
API/Middleware
SupportDesk
DNS
21. IT Service Intelligence – Core Concepts
Service Requests
Responses
Web
Technical Services
Packet Network
Hypervisor and Hosts
RBMDBs
Storage Tier
API Services
Web Services
Web
KPI: Number of requests
KPI: Error rate
KPI: Average response time
KPI: Servicer CPU load
KPI: Server network I/F errors
KPIs
KPIs and Health
scores constitute the
means by which
Services are
monitored.
Health Score
22. IT Service Intelligence – Core Concepts
22
A Health Score is a score form 0-100 (0 being critical and
100 being normal) that helps determine the health of a
Service. It is calculated based on all KPIs importance and
its status (e.g. green, orange, red), once every minute.
A Key Performance Indicator (KPI) is a Splunk saved
search created within the ITSI UI that helps monitor a
specific field like CPU, Memory, Number of Errors and so
on. KPIs are contained within Services.
Service Analyzer – Auto generated filterable and tiled
view of Service health scores and KPIs
23. IT Service Intelligence – Core Concepts
23
A Glass Table is a customizable free form
drawing dashboards to view Health scores and
KPIs of choice with visual tools to create
context with live widgets
Go Deeper to a
Deep Dive View
24. IT Service Intelligence – Core Concepts
24
Deep Dives – Swim lane analysis
dashboard to show all those
indicators over time for
investigations
25. IT Service Intelligence – Core Concepts
25
Multi KPI Alerts – Visual tool to create
correlation searches based on KPIs
26. Notable Events
26
Notable Events are generated by correlation searches that indicate service
degradation. They are like Notable Events in ES but have a slightly different
field set The Correlation searches are generated either through the correlation
search UI or Multi KPI Alert UI.
Splunk software provides an open, fully integrated platform. That means you can collect, index, analyze, report and predict on machine-generated data from a single product. It’s enterprise-ready with high availability and disaster recovery features, role-based access control and scales to index hundreds of terabytes per day. It’s an open platform with over 500 Splunk Apps available and allows for custom development.
Our customers typically start with Splunk to solve a specific problem, and then expand from there to address a broad range of use cases, across application troubleshooting, IT infrastructure monitoring, security, business analytics, Internet of things, and many others that are entirely innovated by our customers.
Here’s how it works. Splunk software and cloud services reliably collect and index machine data, from a single source to tens of thousands of sources. All in real time.
- Once data is in Splunk, you can search, analyze, report-on and derive insights from all your data - across real-time or historical data that may be stored in Hadoop or other NoSQL data sources.
Splunk software reliably collects and indexes all the streaming data from IT systems, technology devices and the Internet of Things in real-time - tens of thousands of sources in unpredictable formats and types. Splunk software is optimized for real-time, low latency and interactivity.
Organizations use Splunk software and their data the following ways:
1. Find and fix problems dramatically faster
2. Automatically monitor to identify issues, problems and attacks
3. Gain end-to-end visibility to track and deliver on IT KPIs and make better-informed IT decisions
4. Gain real-time insight from operational data to make better-informed business decisions
This is described as Operational Intelligence: visibility, insights and intelligence from operational data.
Here's how using Splunk and your machine data can drive significant benefits for your organization.
Search and investigation. Using Splunk, organizations identify and resolve issues up to 70% faster and reduce costly escalations by up to 90%. Splunk is one place to find and fix problems, and investigate incidents across all your IT systems and infrastructure.
Proactive monitoring. Monitor IT systems in real time to identify issues, problems and attacks before they impact your customers, services and revenue. Splunk keeps watch of specific patterns, trends and thresholds in your machine data so you don't have to. Trigger notifications in real-time via email or RSS, execute a script to take remedial actions, send an SNMP trap to your system management console or generate a service desk ticket.
Operational visibility. See the whole picture, track performance and make better decisions. Visualize usage trends to better plan for capacity; spot SLA infractions, track how you are being measured by the business. Do all of this using your existing machine data without spending millions of dollars instrumenting your IT infrastructure.
Real-time business insight. Make better-informed business decisions by understanding trends, patterns and gaining Operational Intelligence from your machine data. See the success of new online services by channel or demographic, reconcile 3rd-party service provider fees against actual use, find your heaviest users and heaviest abusers, and more. Because machine data captures every behavior, the possibilities are game changing. You'll find the lead times to get to this intelligence dramatically less than other solutions - measured in minutes/hours instead of months.
The Splunk platform consists of multiple products and deployment models to fit your needs.
Splunk Enterprise – for on-premise deployment
Splunk Cloud – Fully managed service with 100% SLA and all the capabilities of Splunk Enterprise…in the Cloud
Splunk Light – log search and analytics for small IT environments
Hunk – for analytics on data in Hadoop
The products can pull in data from virtually any source to support multiple use cases.
Splunk Apps extend and simplify deployments by providing pre-packaged content designed for specific use cases and data types.
session title slide
key takeaways
the content
questions slide
thank you slide
Discovery and CMDB DO NOT WORK in service context
- They lack service awareness
- Too many assets are discovered
- Inability to easily categorize entities
- Can’t get the data that matters
o Do not have access to right data (inability to troubleshoot, no idea what to do when the light goes red - still go to another system/multiple systems of record)
- Cannot see metrics, events and log data together
- Aggregated and limited set of metrics gathered
o Multiple different products integrated that lack deep integration between the parts
- No continuous workflow
- complicates the product
1. Every IT manager provides individual metrics that show great KPI’s but those don’t always translate into 99% uptime for a service.
And KPI’s are typically associated with physical metrics of components. Are those the ONLY metrics you want to focus on for the health of your services? What about one’s from your applications, business processing, etc.?
2. Historically, if you attempted to model your services was it time consuming? What happens if you need to make a change?
3. Say users call and complain about a performance problem yesterday but most of your tools only tell you what is going on NOW. Wouldn’t it be nice to see trends and use historical data to develop a true baseline if there truly was a problem? Even use that historical data as indicators to catch problems before they happen, not after?
Splunk’s IT SI represents a new approach to service intelligence
Rather than bolting a mish-mash of products together, ITSI uses a data-driven approach (all data, across silos)
Provides insights into the highest-visibility services-- the ones which directly impact business and operations with –
personal, meaningful contextual visualizations.
Provides sophisticated alerting mechanisms and workflow, to catch and mitigate problems early, before they impact customers
Allows fast correlation across services & KPIs, to quickly determine root cause and reduce MTTR
Deploys in days & weeks, rather than weeks & months
It’s Scalable, flexible (schema on the fly) and continues to provide fast time-to-value
What makes Splunk ITSI different is not only all the cool visualizations that you just saw in the premium solution, but more importantly, the platform that it was built on top of.
Just about every CIO or Ops Executive we talk to is frustrated with Manual Integration within and across tools and Correlation issues with their current Service Management and Monitoring Solutions. The number of tools they’ve had to buy, deploy, administer, and attempt to integrate just don’t live up to their original promises.
An impact of this lack of integration and correlation is the customer’s difficulty meeting or accurately measuring their SLAs.
One way that Splunk differs from existing approaches is that it is a Universal Machine Data Platform which allows you to reliably collect, index, prepare and store data from tens of thousands of sources, in real time -- any type, any format, any location with no pre-defined schema. We are data driven. We take in all the data. Splunk is also in network latent real time and can leverage historical data as well.
To avoid the problems associated with adding or changing Alerts, Splunk delivers Schema on the Fly to provide for rapid creation of alerts from either KPIs or raw data to adapt to business needs quickly. Splunk applies structure at search time, making it easy to search, visualize and analyze your data without any knowledge of the underlying structure. No DBA is required! We also use machine learning to baseline normal operations, detect anomalous behavior to drive meaningful actions, and enable highly correlated searches to create meaningful “alerts” off your KPIs, not ours. And, you get the information from the data that you need when you need it. With Splunk, you can ask any question of the data any time!
Splunk’s powerful platform helps you to realize faster time to value as it leverages all of the data, allows you to answer any questions of the data and empowers the greatest data fidelity
With existing Event Driven solutions, our customers tell us that getting true Service Intelligence is a challenge. Today, Service Owners tell us that they determine Service Health through summarized events that have limited retention time.
The business impact here surrounds the time and expense in identifying root cause and fixing the problem
To address this, Splunk ITSI delivers a 360 degree view of service health from one place. We call this Full Fidelity Service Health. We allow for adaptable and flexible definitions of service health. Customers can now move seamlessly from Business Service Reports to Remediation, all while providing complete historical context. Our solution remains adaptable and yet still maintains complete historical context. Want to visualize and measure what was happening 10 minutes ago?… an hour ago?… Not a problem. This unique differentiation enables Splunk ITSI to deliver a seamless, connected experience from reporting through to remediation.
The ability to leverage Deep Dive Incident Reviews, delivers event, metrics and KPIs – including ad hoc, on the fly searches – you can see and correlate complex interactions easily. And like we just discussed, with full access to historical data, you can compare any two time ranges for all data sets side by side to quickly understand what’s ‘normal’ for that Service by minute, hour, day or week regardless of size or scale.
Every day we hear from customers that change is a constant and the Legacy Service Management solutions struggle with keeping up. With Legacy Solutions, Service Definitions come from Legacy CMDBs that come with questionable data quality. We also hear that it is hard to create new KPIs to keep everything relevant to the Business.
The impact that we hear from Service Owners is that the business perceives IT as being inefficient.
So what else does Splunk ITSI do here that is different? Search Based KPIs deliver a flexible way to impose schema only at retrieval, without a pre-defined schema or hard coded collectors. Often the business may need to see new KPIs or change existing ones. You can easily write, manage and change both services and KPIs so that you can best align business and technology priorities. An example of this in action comes from one of our Beta customers, Fiserve. With Splunk ITSI, Fiserve was able to generate 1000s of KPIs in a manner of weeks. They were able to easily write, manage and change both services and KPIs.
Splunk runs on-prem, in the Cloud or in hybrid environments while collecting data from all the newest technologies.
Our visualizations and analytics are one-of-a-kind. They can be personalized, meaningful, and contextual. Better visualizations and analytics provide and enable IT with actionable insights. Every one can look at the data in the manner that is most relevant to them.
With Splunk ITSI, customers get the higher level benefits based on the underlying platform. So, from deep-in-the-weeds solving IT operational usecases with Splunk enterprise, we’re up-leveling the use cases and making IT more relevant to the business.
The can visualize meaningful and contextual data and inter-relationships with dynamic service models, organize and correlate performance indicators for at-a-glance problem analysis, get proactive with early warnings on anomalies, deviations and pre-configured correlated alerts, and simplify workflows.
Think of a service as a “black box” which we send requests, and expect responses.
In IT SI a Service is a logical group of technology components a user deems need to be monitored together.
A services can literally be sources of data a customer wants to group together to monitor in a single healthscore or just wants to logically group together because they need to be managed by a specific team or needs to be reported in such a way. Services derive their value when KPIs are defined within them or dependencies are defined to other services. Therefore you could have a more abstractly defined service which only depends on other services to derive its own health. E.g. Partner portal is a conceptual service which depends on the API service which in turn has its own KPIs but depends on Web Services. Alternatively you could have Partner portal depend on each and every one in blue, or not even have all the ones in blue and have all the Kpis be inside Partner portal. Everything you see in the diagram above could be a service in ITSI.
Think of a service as a “black box” which we send requests, and expect responses.
In IT SI a Service is a logical group of technology components a user deems need to be monitored together. It could be technical in nature, like Web, Mobile API Middlewear, or DNS. It can even be business related, like Customer Transactions or Support Desk related.
A services can literally be sources of data a customer wants to group together to monitor in a single healthscore or just wants to logically group together because they need to be managed by a specific team or needs to be reported in such a way. Services derive their value when KPIs are defined within them or dependencies are defined to other services. Therefore you could have a more abstractly defined service which only depends on other services to derive its own health. E.g. Partner portal is a conceptual service which depends on the API service which in turn has its own KPIs but depends on Web Services. Alternatively you could have Partner portal depend on each and every one in blue, or not even have all the ones in blue and have all the Kpis be inside Partner portal. Everything you see in the diagram above could be a service in ITSI.
Multi KPI alerts is to build alerts for when there is a desire to be alerted by email or just view the notable event review dashboard (like Incident review in ES).
Think ES when talking about notable events. They are nearly identical to ES notable events other than the fact that they are some other fields like Service and the actions you can perform on them are a little different. Like going to Deep Dive or creating ticket in service now. The correlation searches that create these notable events can be designed through the correlation search interface like in ES, or through the Multi KPI alert UI. They are stored in the notable events summary index.
We’ll use a simulated failure scenario which a NOC might encounter
We’ll show how to isolate a particular problem, from a NOC operator's perspective
We’ll show how to significantly reduce MTTR and provide actionable alerts to avoid outages in the future