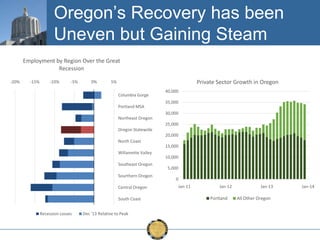
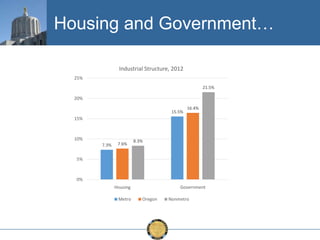
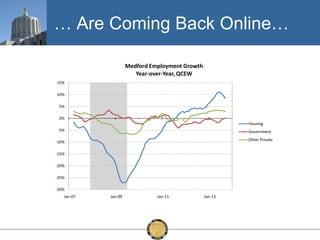
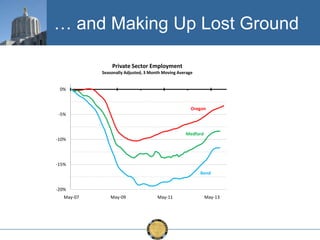
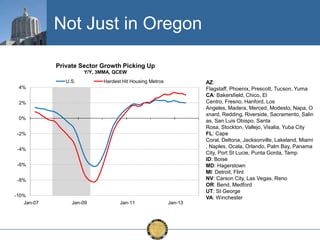
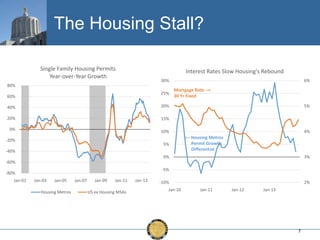
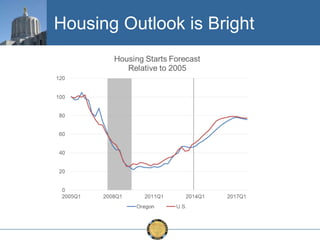
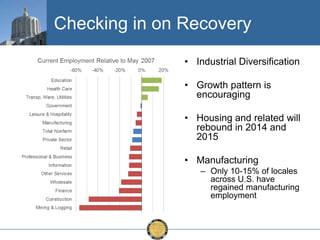
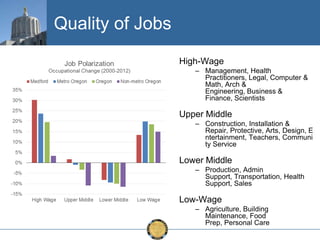
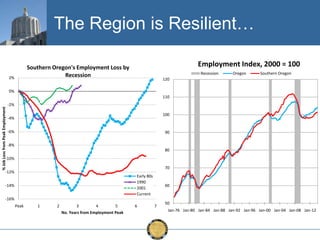
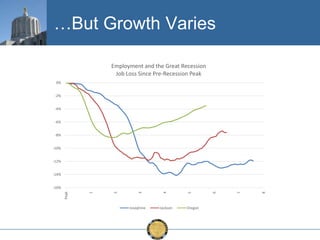
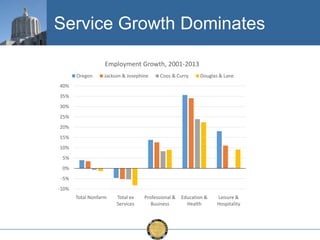
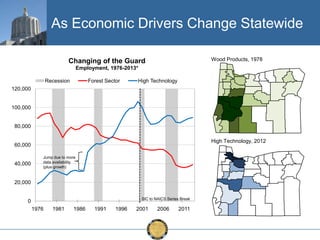
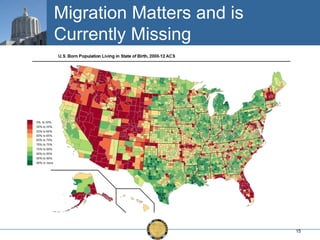
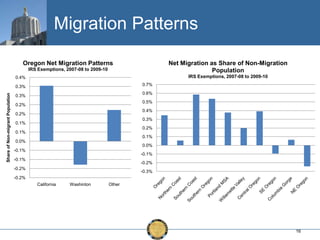
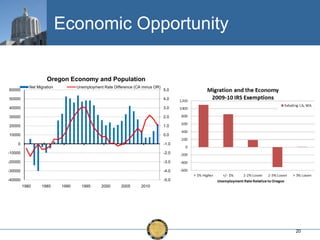
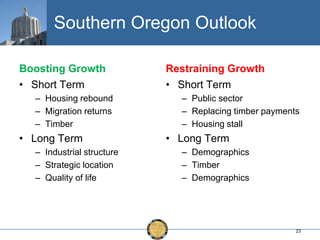
Oregon
Southern Oregon in Recovery
January 30, 2014

Disclaimer
The views expressed in this presentation are the views of
the author and do not necessarily reflect the views of the
State of Oregon, the Governor or the Legislature.

Office of Economic Analysis
Josh Lehner
Oregon’s Recovery has been
Uneven but Gaining Steam
Employment by Region Over the Great
Recession
-20%

-15%

-10%

-5%

0%

Private Sector Growth in Oregon

5%
Columbia Gorge
Portland MSA

40,000
35,000
30,000

Northeast Oregon
25,000
Oregon Statewide
20,000
North Coast
15,000
Willamette Valley
Southeast Oregon

Sourthern Oregon
Central Oregon
South Coast
Recession Losses

Dec '13 Relative to Peak

10,000
5,000
0
Jan-11

Jan-12

Portland

Jan-13

All Other Oregon

Jan-14
Housing and Government…
Industrial Structure, 2012
25%
21.5%

20%
15.5%

16.4%

15%

10%
7.3%

7.6%

8.3%

5%

0%
Housing
Metro

Government
Oregon

Nonmetro
… Are Coming Back Online…
Medford Employment Growth
Year-over-Year, QCEW
15%

10%
5%
0%
Housing
-5%

Government
Other Private

-10%
-15%
-20%
-25%
-30%
Jan-07

Jan-09

Jan-11

Jan-13
… and Making Up Lost Ground
Private Sector Employment
Seasonally Adjusted, 3 Month Moving Average

0%

Oregon
-5%

Medford
-10%

-15%
Bend

-20%
May-07

May-09

May-11

May-13
Not Just in Oregon
Private Sector Growth Picking Up
Y/Y, 3MMA, QCEW
U.S.

Hardest Hit Housing Metros

AZ:
Flagstaff, Phoenix, Prescott, Tucson, Yuma
CA: Bakersfield, Chico, El
Centro, Fresno, Hanford, Los
Angeles, Madera, Merced, Modesto, Napa, O
xnard, Redding, Riverside, Sacramento, Salin
as, San Luis Obispo, Santa
Rosa, Stockton, Vallejo, Visalia, Yuba City
FL: Cape
Coral, Deltona, Jacksonville, Lakeland, Miami
, Naples, Ocala, Orlando, Palm Bay, Panama
City, Port St Lucie, Punta Gorda, Tamp
ID: Boise
MD: Hagerstown
MI: Detroit, Flint
NV: Carson City, Las Vegas, Reno
OR: Bend, Medford
UT: St George
VA: Winchester

4%
2%
0%
-2%
-4%
-6%
-8%
-10%
Jan-07

Jan-09

Jan-11

Jan-13
The Housing Stall?
Single Family Housing Permits
Year-over-Year Growth

Interest Rates Slow Housing's Rebound
30%

80%
25%

60%
40%

15%

0%

Mortgage Rate -->
30 Yr Fixed

20%

20%

6%

10%

-20%

5%

-40%

5%

4%

<-- Housing Metros
Permit Growth
Differential

0%

3%

-60%
-5%

-80%
Jan-01

Jan-03

Jan-05

Housing Metros

Jan-07

Jan-09

Jan-11

US ex Housing MSAs

Jan-13

-10%
Jan-10

2%
Jan-11

Jan-12

Jan-13

7
Housing Outlook is Bright
Checking in on Recovery
• Industrial Diversification

• Growth pattern is
encouraging
• Housing and related will
rebound in 2014 and
2015
• Manufacturing
– Only 10-15% of locales
across U.S. have
regained manufacturing
employment
Quality of Jobs
High-Wage
– Management, Health
Practitioners, Legal, Computer &
Math, Arch &
Engineering, Business &
Finance, Scientists

Upper Middle
– Construction, Installation &
Repair, Protective, Arts, Design, E
ntertainment, Teachers, Communi
ty Service

Lower Middle
– Production, Admin
Support, Transportation, Health
Support, Sales

Low-Wage
– Agriculture, Building
Maintenance, Food
Prep, Personal Care
The Region is Resilient…
Employment Index, 2000 = 100

Southern Oregon's Employment Loss by
Recession

2%

Recession

Oregon

Southern Oregon

120

0%

% Job Loss from Peak Employment

110
-2%
100

-4%
-6%

90

-8%
80

-10%
70

-12%

Early 80s
1990
2001
Current

-14%

60

-16%
Peak

1

2

3
4
5
No. Years from Employment Peak

6

7

50
Jan-76 Jan-80 Jan-84 Jan-88 Jan-92 Jan-96 Jan-00 Jan-04 Jan-08 Jan-12
…But Growth Varies
Employment and the Great Recession
Job Loss Since Pre-Recession Peak
0%
-2%
-4%
-6%
-8%
-10%
-12%
-14%

Josephine

Jackson

Oregon

8

7

6

5

4

3

2

1

Peak

-16%
Service Growth Dominates
Employment Growth, 2001-2013
Oregon

Jackson & Josephine

Coos & Curry

Douglas & Lane

40%
35%
30%

25%
20%
15%
10%
5%
0%
-5%
-10%
Total Nonfarm

Total ex
Services

Professional &
Business

Education &
Health

Leisure &
Hospitality
As Economic Drivers Change Statewide
Wood Products, 1978

Changing of the Guard
Employment, 1976-2013*
Recession

Forest Sector

High Technology

120,000

100,000

80,000
High Technology, 2012

60,000

40,000

Jump due to more
data availability
(plus growth)

20,000
SIC to NAICS Series Break

0
1976

1981

1986

1991

1996

2001

2006

2011
Migration Matters and is
Currently Missing

15
Migration Patterns
Oregon Net Migration Patterns

Net Migration as Share of Non-Migration
Population

IRS Exemptions, 2007-08 to 2009-10

IRS Exemptions, 2007-08 to 2009-10

0.4%
0.7%

Share of Non-migrant Population

0.3%

0.6%

0.3%

0.5%

0.2%

0.4%

0.2%

0.3%

0.1%

0.2%
0.1%
0.1%
0.0%
0.0%
-0.1%

-0.1%

-0.1%

-0.2%

-0.2%

-0.3%

-0.2%
California

Washinton

Other

16
Californians Prefer Rain

17
Why Do People Move?
Reason for Moving
Current Population Survey, 2000-13
100%

Housing: cheaper housing, other
housing, new or better
housing, want to own and not rent

90%
80%
70%
60%

Better Life: change of
climate, easier commute, health
reasons, better neighborhood

50%
40%
30%

Family Status: change in marital
status, establish own household

20%
10%
0%
All Movers

Between
States

Within State From Another
To
State
Washington

U.S.
New Job/Transfer
Family Status
Other

Housing
College
Retired

To All Other
States

Job Related: other job related, to
look for work

Oregon
Better Life
Disaster

Disaster: foreclosure or
eviction, natural disaster (Katrina)

Other Family
Job Related

18
Home Equity
Median Home Values
American Community Survey, 2008-12 Estimates
$0

Net Migration and Home Prices
70000

2.4

$200,000

$400,000

$600,000

San Francisco

$595,400

60000
50000

1.9

40000

Los Angeles

2

1

30000

$467,300

1.4

California

20000
10000

$383,900

0.9

0

Oregon

Medford

-10000

$246,100

$242,300

0.4

-20000
-30000

-0.1
1980

1985

1990

Net Migration (L)

1995

2000

2005

2010

CA to OR Home Price Index (R)

Grants Pass

United States

$231,800

$181,400

19
Economic Opportunity
Oregon Economy and Population
60000

Net Migration

Unemployment Rate Difference (CA minus OR)

5.0

50000

4.0

40000

3.0

30000

2.0

20000

1.0

10000

0.0

0

-1.0

-10000

-2.0

-20000

-3.0

-30000

-4.0

-40000

-5.0
1980

1985

1990

1995

2000

2005

2010

20
Demographics
Age Structure

Population Growth 2010-2025

16%
School Age

Oregon

Root Setting

Jackson

Josephine

14%

14%

12%

12%

10%

10%

8%

8%
6%

6%

4%

4%

2%

2%

0%

0%

<5

5-9 10-14 15-19 20-24 25-34 35-44 45-54 55-59 60-64 65-74 75-84 85+
U.S.

Oregon

Jackson & Josephine

Under 20

Prime Working Age (2554)
Critical Condition Counties

1–6
7 – 12
13 – 18
19 – 24

25 – 30
31 – 36

Source: Oregon Employment Department
Southern Oregon Outlook
Boosting Growth
• Short Term
– Housing rebound
– Migration returns
– Timber

• Long Term
– Industrial structure
– Strategic location
– Quality of life

Restraining Growth
• Short Term
– Public sector
– Replacing timber payments
– Housing stall

• Long Term
– Demographics
– Timber
– Demographics

23
For More Information
www.OregonEconomicAnalysis.com
@OR_EconAnalysis

Employment Department
www.qualityinfo.org

24

SOREDI 01.30.14

  • 1.
    Oregon Southern Oregon inRecovery January 30, 2014 Disclaimer The views expressed in this presentation are the views of the author and do not necessarily reflect the views of the State of Oregon, the Governor or the Legislature. Office of Economic Analysis Josh Lehner
  • 2.
    Oregon’s Recovery hasbeen Uneven but Gaining Steam Employment by Region Over the Great Recession -20% -15% -10% -5% 0% Private Sector Growth in Oregon 5% Columbia Gorge Portland MSA 40,000 35,000 30,000 Northeast Oregon 25,000 Oregon Statewide 20,000 North Coast 15,000 Willamette Valley Southeast Oregon Sourthern Oregon Central Oregon South Coast Recession Losses Dec '13 Relative to Peak 10,000 5,000 0 Jan-11 Jan-12 Portland Jan-13 All Other Oregon Jan-14
  • 3.
    Housing and Government… IndustrialStructure, 2012 25% 21.5% 20% 15.5% 16.4% 15% 10% 7.3% 7.6% 8.3% 5% 0% Housing Metro Government Oregon Nonmetro
  • 4.
    … Are ComingBack Online… Medford Employment Growth Year-over-Year, QCEW 15% 10% 5% 0% Housing -5% Government Other Private -10% -15% -20% -25% -30% Jan-07 Jan-09 Jan-11 Jan-13
  • 5.
    … and MakingUp Lost Ground Private Sector Employment Seasonally Adjusted, 3 Month Moving Average 0% Oregon -5% Medford -10% -15% Bend -20% May-07 May-09 May-11 May-13
  • 6.
    Not Just inOregon Private Sector Growth Picking Up Y/Y, 3MMA, QCEW U.S. Hardest Hit Housing Metros AZ: Flagstaff, Phoenix, Prescott, Tucson, Yuma CA: Bakersfield, Chico, El Centro, Fresno, Hanford, Los Angeles, Madera, Merced, Modesto, Napa, O xnard, Redding, Riverside, Sacramento, Salin as, San Luis Obispo, Santa Rosa, Stockton, Vallejo, Visalia, Yuba City FL: Cape Coral, Deltona, Jacksonville, Lakeland, Miami , Naples, Ocala, Orlando, Palm Bay, Panama City, Port St Lucie, Punta Gorda, Tamp ID: Boise MD: Hagerstown MI: Detroit, Flint NV: Carson City, Las Vegas, Reno OR: Bend, Medford UT: St George VA: Winchester 4% 2% 0% -2% -4% -6% -8% -10% Jan-07 Jan-09 Jan-11 Jan-13
  • 7.
    The Housing Stall? SingleFamily Housing Permits Year-over-Year Growth Interest Rates Slow Housing's Rebound 30% 80% 25% 60% 40% 15% 0% Mortgage Rate --> 30 Yr Fixed 20% 20% 6% 10% -20% 5% -40% 5% 4% <-- Housing Metros Permit Growth Differential 0% 3% -60% -5% -80% Jan-01 Jan-03 Jan-05 Housing Metros Jan-07 Jan-09 Jan-11 US ex Housing MSAs Jan-13 -10% Jan-10 2% Jan-11 Jan-12 Jan-13 7
  • 8.
  • 9.
    Checking in onRecovery • Industrial Diversification • Growth pattern is encouraging • Housing and related will rebound in 2014 and 2015 • Manufacturing – Only 10-15% of locales across U.S. have regained manufacturing employment
  • 10.
    Quality of Jobs High-Wage –Management, Health Practitioners, Legal, Computer & Math, Arch & Engineering, Business & Finance, Scientists Upper Middle – Construction, Installation & Repair, Protective, Arts, Design, E ntertainment, Teachers, Communi ty Service Lower Middle – Production, Admin Support, Transportation, Health Support, Sales Low-Wage – Agriculture, Building Maintenance, Food Prep, Personal Care
  • 11.
    The Region isResilient… Employment Index, 2000 = 100 Southern Oregon's Employment Loss by Recession 2% Recession Oregon Southern Oregon 120 0% % Job Loss from Peak Employment 110 -2% 100 -4% -6% 90 -8% 80 -10% 70 -12% Early 80s 1990 2001 Current -14% 60 -16% Peak 1 2 3 4 5 No. Years from Employment Peak 6 7 50 Jan-76 Jan-80 Jan-84 Jan-88 Jan-92 Jan-96 Jan-00 Jan-04 Jan-08 Jan-12
  • 12.
    …But Growth Varies Employmentand the Great Recession Job Loss Since Pre-Recession Peak 0% -2% -4% -6% -8% -10% -12% -14% Josephine Jackson Oregon 8 7 6 5 4 3 2 1 Peak -16%
  • 13.
    Service Growth Dominates EmploymentGrowth, 2001-2013 Oregon Jackson & Josephine Coos & Curry Douglas & Lane 40% 35% 30% 25% 20% 15% 10% 5% 0% -5% -10% Total Nonfarm Total ex Services Professional & Business Education & Health Leisure & Hospitality
  • 14.
    As Economic DriversChange Statewide Wood Products, 1978 Changing of the Guard Employment, 1976-2013* Recession Forest Sector High Technology 120,000 100,000 80,000 High Technology, 2012 60,000 40,000 Jump due to more data availability (plus growth) 20,000 SIC to NAICS Series Break 0 1976 1981 1986 1991 1996 2001 2006 2011
  • 15.
    Migration Matters andis Currently Missing 15
  • 16.
    Migration Patterns Oregon NetMigration Patterns Net Migration as Share of Non-Migration Population IRS Exemptions, 2007-08 to 2009-10 IRS Exemptions, 2007-08 to 2009-10 0.4% 0.7% Share of Non-migrant Population 0.3% 0.6% 0.3% 0.5% 0.2% 0.4% 0.2% 0.3% 0.1% 0.2% 0.1% 0.1% 0.0% 0.0% -0.1% -0.1% -0.1% -0.2% -0.2% -0.3% -0.2% California Washinton Other 16
  • 17.
  • 18.
    Why Do PeopleMove? Reason for Moving Current Population Survey, 2000-13 100% Housing: cheaper housing, other housing, new or better housing, want to own and not rent 90% 80% 70% 60% Better Life: change of climate, easier commute, health reasons, better neighborhood 50% 40% 30% Family Status: change in marital status, establish own household 20% 10% 0% All Movers Between States Within State From Another To State Washington U.S. New Job/Transfer Family Status Other Housing College Retired To All Other States Job Related: other job related, to look for work Oregon Better Life Disaster Disaster: foreclosure or eviction, natural disaster (Katrina) Other Family Job Related 18
  • 19.
    Home Equity Median HomeValues American Community Survey, 2008-12 Estimates $0 Net Migration and Home Prices 70000 2.4 $200,000 $400,000 $600,000 San Francisco $595,400 60000 50000 1.9 40000 Los Angeles 2 1 30000 $467,300 1.4 California 20000 10000 $383,900 0.9 0 Oregon Medford -10000 $246,100 $242,300 0.4 -20000 -30000 -0.1 1980 1985 1990 Net Migration (L) 1995 2000 2005 2010 CA to OR Home Price Index (R) Grants Pass United States $231,800 $181,400 19
  • 20.
    Economic Opportunity Oregon Economyand Population 60000 Net Migration Unemployment Rate Difference (CA minus OR) 5.0 50000 4.0 40000 3.0 30000 2.0 20000 1.0 10000 0.0 0 -1.0 -10000 -2.0 -20000 -3.0 -30000 -4.0 -40000 -5.0 1980 1985 1990 1995 2000 2005 2010 20
  • 21.
    Demographics Age Structure Population Growth2010-2025 16% School Age Oregon Root Setting Jackson Josephine 14% 14% 12% 12% 10% 10% 8% 8% 6% 6% 4% 4% 2% 2% 0% 0% <5 5-9 10-14 15-19 20-24 25-34 35-44 45-54 55-59 60-64 65-74 75-84 85+ U.S. Oregon Jackson & Josephine Under 20 Prime Working Age (2554)
  • 22.
    Critical Condition Counties 1–6 7– 12 13 – 18 19 – 24 25 – 30 31 – 36 Source: Oregon Employment Department
  • 23.
    Southern Oregon Outlook BoostingGrowth • Short Term – Housing rebound – Migration returns – Timber • Long Term – Industrial structure – Strategic location – Quality of life Restraining Growth • Short Term – Public sector – Replacing timber payments – Housing stall • Long Term – Demographics – Timber – Demographics 23
  • 24.