Download to read offline

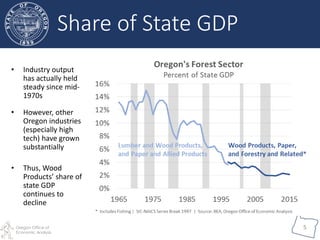
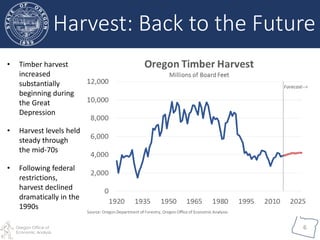
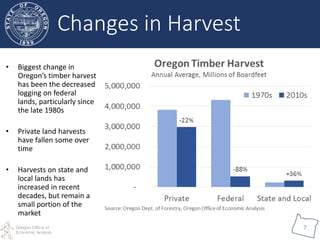
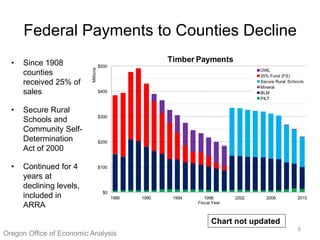


The document provides a historical overview of Oregon's wood products industry, highlighting employment trends, economic impacts, and changes in timber harvest practices since the 1970s. It notes a significant decline in jobs and industry wages, along with increased competition from international markets, particularly China. The report concludes with a comparison of the timber industry's challenges to other declining sectors in the U.S., emphasizing the ongoing shifts in economic performance and quality of life in Oregon's timber belt.


