Principal component analysis (PCA) is an unsupervised machine learning algorithm used for dimensionality reduction. It converts correlated variables into uncorrelated principal components. PCA calculates the eigenvalues and eigenvectors of the covariance matrix to project the data onto a new feature space with fewer dimensions while retaining as much information as possible. The first principal component accounts for the largest variation in the data, with each subsequent component accounting for less variation.
In order to provide the design guidance for a multiple stage refrigerator for hosting a quantum computing device targeting for unmanned transportation platform. We provides a modeling analysis based on a preliminary single stage test data, by using Brain Storm Optimization algorithm.
Department of MathematicsMTL107 Numerical Methods and Com.docxsalmonpybus
Department of Mathematics
MTL107: Numerical Methods and Computations
Exercise Set 8: Approximation-Linear Least Squares Polynomial approximation, Chebyshev
Polynomial approximation.
1. Compute the linear least square polynomial for the data:
i xi yi
1 0 1.0000
2 0.25 1.2840
3 0.50 1.6487
4 0.75 2.1170
5 1.00 2.7183
2. Find the least square polynomials of degrees 1,2 and 3 for the data in the following talbe.
Compute the error E in each case. Graph the data and the polynomials.
:
xi 1.0 1.1 1.3 1.5 1.9 2.1
yi 1.84 1.96 2.21 2.45 2.94 3.18
3. Given the data:
xi 4.0 4.2 4.5 4.7 5.1 5.5 5.9 6.3 6.8 7.1
yi 113.18 113.18 130.11 142.05 167.53 195.14 224.87 256.73 299.50 326.72
a. Construct the least squared polynomial of degree 1, and compute the error.
b. Construct the least squared polynomial of degree 2, and compute the error.
c. Construct the least squared polynomial of degree 3, and compute the error.
d. Construct the least squares approximation of the form beax, and compute the error.
e. Construct the least squares approximation of the form bxa, and compute the error.
4. The following table lists the college grade-point averages of 20 mathematics and computer
science majors, together with the scores that these students received on the mathematics
portion of the ACT (Americal College Testing Program) test while in high school. Plot
these data, and find the equation of the least squares line for this data:
:
ACT Grade-point ACT Grade-point
score average score average
28 3.84 29 3.75
25 3.21 28 3.65
28 3.23 27 3.87
27 3.63 29 3.75
28 3.75 21 1.66
33 3.20 28 3.12
28 3.41 28 2.96
29 3.38 26 2.92
23 3.53 30 3.10
27 2.03 24 2.81
5. Find the linear least squares polynomial approximation to f(x) on the indicated interval
if
a. f(x) = x2 + 3x+ 2, [0, 1]; b. f(x) = x3, [0, 2];
c. f(x) = 1
x
, [1, 3]; d. f(x) = ex, [0, 2];
e. f(x) = 1
2
cosx+ 1
3
sin 2x, [0, 1]; f. f(x) = x lnx, [1, 3];
6. Find the least square polynomial approximation of degrees 2 to the functions and intervals
in Exercise 5.
7. Compute the error E for the approximations in Exercise 6.
8. Use the Gram-Schmidt process to construct φ0(x), φ1(x), φ2(x) and φ3(x) for the following
intervals.
a. [0,1] b. [0,2] c. [1,3]
9. Obtain the least square approximation polynomial of degree 3 for the functions in Exercise
5 using the results of Exercise 8.
10. Use the Gram-Schmidt procedure to calculate L1, L2, L3 where {L0(x), L1(x), L2(x), L3(x)}
is an orthogonal set of polynomials on (0,∞) with respect to the weight functions w(x) =
e−x and L0(x) = 1. The polynomials obtained from this procedure are called the La-
guerre polynomials.
11. Use the zeros of T̃3, to construct an interpolating polynomial of degree 2 for the following
functions on the interval [-1,1]:
a. f(x) = ex, b. f(x) = sinx, c. f(x) = ln(x+ 2), d. f(x) = x4.
12. Find a bound for the maximum error of the approximation in Exercise 1 on the interval
[-1,1].
13. Use the zer.
Response Surface in Tensor Train format for Uncertainty QuantificationAlexander Litvinenko
We apply low-rank Tensor Train format to solve PDEs with uncertain coefficients. First, we approximate uncertain permeability coefficient in TT format, then the operator and then apply iterations to solve stochastic Galerkin system.
A New Approach to Design a Reduced Order ObserverIJERD Editor
In this paper, a new method for designing a reduced order observer for linear time-invariant system is
proposed. The approach is based on matrix inversion with proper dimension. The arbitrariness associated with
the method proposed by O’Reilly is presented here and has been reduced with the help of pole-placement
technique. It also helps reducing the computations regarding the observer design parameters. Illustrative
numerical examples with simulation results are also included.
International Journal of Engineering Research and Applications (IJERA) is an open access online peer reviewed international journal that publishes research and review articles in the fields of Computer Science, Neural Networks, Electrical Engineering, Software Engineering, Information Technology, Mechanical Engineering, Chemical Engineering, Plastic Engineering, Food Technology, Textile Engineering, Nano Technology & science, Power Electronics, Electronics & Communication Engineering, Computational mathematics, Image processing, Civil Engineering, Structural Engineering, Environmental Engineering, VLSI Testing & Low Power VLSI Design etc.
Fuzzy clustering algorithm can not obtain good clustering effect when the sample characteristic is not obvious and need to determine the number of clusters firstly. For thi0s reason, this paper proposes an adaptive fuzzy kernel clustering algorithm. The algorithm firstly use the adaptive function of clustering number to calculate the optimal clustering number, then the samples of input space is mapped to highdimensional feature space using gaussian kernel and clustering in the feature space. The Matlab simulation results confirmed that the algorithm's performance has greatly improvement than classical clustering algorithm and has faster convergence speed and more accurate clustering results.
Fuzzy clustering algorithm can not obtain good clustering effect when the sample characteristic is not
obvious and need to determine the number of clusters firstly. For thi0s reason, this paper proposes an
adaptive fuzzy kernel clustering algorithm. The algorithm firstly use the adaptive function of clustering
number to calculate the optimal clustering number, then the samples of input space is mapped to highdimensional
feature space using gaussian kernel and clustering in the feature space. The Matlab simulation
results confirmed that the algorithm's performance has greatly improvement than classical clustering algorithm and has faster convergence speed and more accurate clustering results
MACHINE LEARNING IS GOING TO DEFINE THE NEXT ERA; PEOPLE SAY IT WILL HAVE SIMILAR EFFECTS AS ELECTRICITY OR INTERNET HAD IN their TIMES .ARITIFICIAL INTELLIGENCE IS THE NEXT BEST THING IN THE WORLD OF TECHNOLOGY , BLOCKCHAIN AFTER THAT
k-means clustering aims to partition n observations into k clusters in which each observation belongs to the cluster with the nearest mean, serving as a prototype of the cluster. This results in a partitioning of the data space into Voronoi cells.
Literature Review Basics and Understanding Reference Management.pptxDr Ramhari Poudyal
Three-day training on academic research focuses on analytical tools at United Technical College, supported by the University Grant Commission, Nepal. 24-26 May 2024
Final project report on grocery store management system..pdfKamal Acharya
In today’s fast-changing business environment, it’s extremely important to be able to respond to client needs in the most effective and timely manner. If your customers wish to see your business online and have instant access to your products or services.
Online Grocery Store is an e-commerce website, which retails various grocery products. This project allows viewing various products available enables registered users to purchase desired products instantly using Paytm, UPI payment processor (Instant Pay) and also can place order by using Cash on Delivery (Pay Later) option. This project provides an easy access to Administrators and Managers to view orders placed using Pay Later and Instant Pay options.
In order to develop an e-commerce website, a number of Technologies must be studied and understood. These include multi-tiered architecture, server and client-side scripting techniques, implementation technologies, programming language (such as PHP, HTML, CSS, JavaScript) and MySQL relational databases. This is a project with the objective to develop a basic website where a consumer is provided with a shopping cart website and also to know about the technologies used to develop such a website.
This document will discuss each of the underlying technologies to create and implement an e- commerce website.
Online aptitude test management system project report.pdfKamal Acharya
The purpose of on-line aptitude test system is to take online test in an efficient manner and no time wasting for checking the paper. The main objective of on-line aptitude test system is to efficiently evaluate the candidate thoroughly through a fully automated system that not only saves lot of time but also gives fast results. For students they give papers according to their convenience and time and there is no need of using extra thing like paper, pen etc. This can be used in educational institutions as well as in corporate world. Can be used anywhere any time as it is a web based application (user Location doesn’t matter). No restriction that examiner has to be present when the candidate takes the test.
Every time when lecturers/professors need to conduct examinations they have to sit down think about the questions and then create a whole new set of questions for each and every exam. In some cases the professor may want to give an open book online exam that is the student can take the exam any time anywhere, but the student might have to answer the questions in a limited time period. The professor may want to change the sequence of questions for every student. The problem that a student has is whenever a date for the exam is declared the student has to take it and there is no way he can take it at some other time. This project will create an interface for the examiner to create and store questions in a repository. It will also create an interface for the student to take examinations at his convenience and the questions and/or exams may be timed. Thereby creating an application which can be used by examiners and examinee’s simultaneously.
Examination System is very useful for Teachers/Professors. As in the teaching profession, you are responsible for writing question papers. In the conventional method, you write the question paper on paper, keep question papers separate from answers and all this information you have to keep in a locker to avoid unauthorized access. Using the Examination System you can create a question paper and everything will be written to a single exam file in encrypted format. You can set the General and Administrator password to avoid unauthorized access to your question paper. Every time you start the examination, the program shuffles all the questions and selects them randomly from the database, which reduces the chances of memorizing the questions.
Forklift Classes Overview by Intella PartsIntella Parts
Discover the different forklift classes and their specific applications. Learn how to choose the right forklift for your needs to ensure safety, efficiency, and compliance in your operations.
For more technical information, visit our website https://intellaparts.com
Hierarchical Digital Twin of a Naval Power SystemKerry Sado
A hierarchical digital twin of a Naval DC power system has been developed and experimentally verified. Similar to other state-of-the-art digital twins, this technology creates a digital replica of the physical system executed in real-time or faster, which can modify hardware controls. However, its advantage stems from distributing computational efforts by utilizing a hierarchical structure composed of lower-level digital twin blocks and a higher-level system digital twin. Each digital twin block is associated with a physical subsystem of the hardware and communicates with a singular system digital twin, which creates a system-level response. By extracting information from each level of the hierarchy, power system controls of the hardware were reconfigured autonomously. This hierarchical digital twin development offers several advantages over other digital twins, particularly in the field of naval power systems. The hierarchical structure allows for greater computational efficiency and scalability while the ability to autonomously reconfigure hardware controls offers increased flexibility and responsiveness. The hierarchical decomposition and models utilized were well aligned with the physical twin, as indicated by the maximum deviations between the developed digital twin hierarchy and the hardware.
NUMERICAL SIMULATIONS OF HEAT AND MASS TRANSFER IN CONDENSING HEAT EXCHANGERS...ssuser7dcef0
Power plants release a large amount of water vapor into the
atmosphere through the stack. The flue gas can be a potential
source for obtaining much needed cooling water for a power
plant. If a power plant could recover and reuse a portion of this
moisture, it could reduce its total cooling water intake
requirement. One of the most practical way to recover water
from flue gas is to use a condensing heat exchanger. The power
plant could also recover latent heat due to condensation as well
as sensible heat due to lowering the flue gas exit temperature.
Additionally, harmful acids released from the stack can be
reduced in a condensing heat exchanger by acid condensation. reduced in a condensing heat exchanger by acid condensation.
Condensation of vapors in flue gas is a complicated
phenomenon since heat and mass transfer of water vapor and
various acids simultaneously occur in the presence of noncondensable
gases such as nitrogen and oxygen. Design of a
condenser depends on the knowledge and understanding of the
heat and mass transfer processes. A computer program for
numerical simulations of water (H2O) and sulfuric acid (H2SO4)
condensation in a flue gas condensing heat exchanger was
developed using MATLAB. Governing equations based on
mass and energy balances for the system were derived to
predict variables such as flue gas exit temperature, cooling
water outlet temperature, mole fraction and condensation rates
of water and sulfuric acid vapors. The equations were solved
using an iterative solution technique with calculations of heat
and mass transfer coefficients and physical properties.
Sachpazis:Terzaghi Bearing Capacity Estimation in simple terms with Calculati...Dr.Costas Sachpazis
Terzaghi's soil bearing capacity theory, developed by Karl Terzaghi, is a fundamental principle in geotechnical engineering used to determine the bearing capacity of shallow foundations. This theory provides a method to calculate the ultimate bearing capacity of soil, which is the maximum load per unit area that the soil can support without undergoing shear failure. The Calculation HTML Code included.
Cosmetic shop management system project report.pdfKamal Acharya
Buying new cosmetic products is difficult. It can even be scary for those who have sensitive skin and are prone to skin trouble. The information needed to alleviate this problem is on the back of each product, but it's thought to interpret those ingredient lists unless you have a background in chemistry.
Instead of buying and hoping for the best, we can use data science to help us predict which products may be good fits for us. It includes various function programs to do the above mentioned tasks.
Data file handling has been effectively used in the program.
The automated cosmetic shop management system should deal with the automation of general workflow and administration process of the shop. The main processes of the system focus on customer's request where the system is able to search the most appropriate products and deliver it to the customers. It should help the employees to quickly identify the list of cosmetic product that have reached the minimum quantity and also keep a track of expired date for each cosmetic product. It should help the employees to find the rack number in which the product is placed.It is also Faster and more efficient way.
We have compiled the most important slides from each speaker's presentation. This year’s compilation, available for free, captures the key insights and contributions shared during the DfMAy 2024 conference.
Harnessing WebAssembly for Real-time Stateless Streaming PipelinesChristina Lin
Traditionally, dealing with real-time data pipelines has involved significant overhead, even for straightforward tasks like data transformation or masking. However, in this talk, we’ll venture into the dynamic realm of WebAssembly (WASM) and discover how it can revolutionize the creation of stateless streaming pipelines within a Kafka (Redpanda) broker. These pipelines are adept at managing low-latency, high-data-volume scenarios.
Industrial Training at Shahjalal Fertilizer Company Limited (SFCL)MdTanvirMahtab2
This presentation is about the working procedure of Shahjalal Fertilizer Company Limited (SFCL). A Govt. owned Company of Bangladesh Chemical Industries Corporation under Ministry of Industries.
NO1 Uk best vashikaran specialist in delhi vashikaran baba near me online vas...Amil Baba Dawood bangali
Contact with Dawood Bhai Just call on +92322-6382012 and we'll help you. We'll solve all your problems within 12 to 24 hours and with 101% guarantee and with astrology systematic. If you want to take any personal or professional advice then also you can call us on +92322-6382012 , ONLINE LOVE PROBLEM & Other all types of Daily Life Problem's.Then CALL or WHATSAPP us on +92322-6382012 and Get all these problems solutions here by Amil Baba DAWOOD BANGALI
#vashikaranspecialist #astrologer #palmistry #amliyaat #taweez #manpasandshadi #horoscope #spiritual #lovelife #lovespell #marriagespell#aamilbabainpakistan #amilbabainkarachi #powerfullblackmagicspell #kalajadumantarspecialist #realamilbaba #AmilbabainPakistan #astrologerincanada #astrologerindubai #lovespellsmaster #kalajaduspecialist #lovespellsthatwork #aamilbabainlahore#blackmagicformarriage #aamilbaba #kalajadu #kalailam #taweez #wazifaexpert #jadumantar #vashikaranspecialist #astrologer #palmistry #amliyaat #taweez #manpasandshadi #horoscope #spiritual #lovelife #lovespell #marriagespell#aamilbabainpakistan #amilbabainkarachi #powerfullblackmagicspell #kalajadumantarspecialist #realamilbaba #AmilbabainPakistan #astrologerincanada #astrologerindubai #lovespellsmaster #kalajaduspecialist #lovespellsthatwork #aamilbabainlahore #blackmagicforlove #blackmagicformarriage #aamilbaba #kalajadu #kalailam #taweez #wazifaexpert #jadumantar #vashikaranspecialist #astrologer #palmistry #amliyaat #taweez #manpasandshadi #horoscope #spiritual #lovelife #lovespell #marriagespell#aamilbabainpakistan #amilbabainkarachi #powerfullblackmagicspell #kalajadumantarspecialist #realamilbaba #AmilbabainPakistan #astrologerincanada #astrologerindubai #lovespellsmaster #kalajaduspecialist #lovespellsthatwork #aamilbabainlahore #Amilbabainuk #amilbabainspain #amilbabaindubai #Amilbabainnorway #amilbabainkrachi #amilbabainlahore #amilbabaingujranwalan #amilbabainislamabad
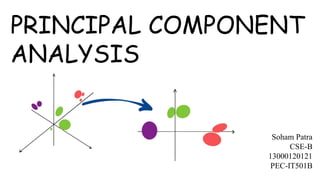
2. It is an unsupervised learning algorithm that is used for
the dimensionality reduction in machine learning
Unsupervised learning – discovering patterns in the data
set without human help
example - clustering
Dimensionality Reduction –
Types:
1. Feature Elimination – eliminating some of the features to reduce
feature space
2. Feature Extraction – create new features where each new feature
is a combination of the old features
What is Principal Component Analysis ?
3. PCA converts correlated features into a set of
uncorrelated features with the help of orthogonal
transformation.
These new features are called Principal Components.
It is a technique to draw strong patterns from the given
dataset by reducing the no of variables.
PCA Algorithm is based on mainly two mathematical
concepts:
1. Variance and Covariance
2. Eigenvalues and Eigenvector
What is Principal Component Analysis ?
4. Lets consider a dataset in which we compare 6 algorithms to solve a problem on the
basis of Time complexity, Space Complexity and Lines of Code
Algo 1 Algo 2 Algo 3 Algo 4 Algo 5 Algo 6
Time
Complexity 9 8 6 3 3 1
Space
Complexity 7 8 9 5 3 4
Lines of
Code 7 8 7 2 4 2
1
2
5
4
6
3
Example
5. Algo 1 Algo 2 Algo 3 Algo 4 Algo 5 Algo 6
Time
Complexity 4 3 1 -2 -2 -4
Space
Complexity 1 2 3 -1 -3 -2
Lines of
Code 2 3 2 -3 -1 -3
So in order to standardize the data we need to find the mean vector and subtract it from
each point
Mean for Time complexity = (9+8+6+3+3+1) / 6 = 5
Mean for Space Complexity = (7+8+9+5+3+4) / 6 = 6
Mean for Lines of Code = (7+8+7+2+4+2) / 6 = 5
Mean vector = (5,6,5)
So the new data set looks like this:
1
2
5
4
6
3
Standardize the Data
6. So now we need to form a n * m matrix from the data given, let it be matrix A
(n = no of dimensions variables
A = m = no of points )
Now the covariance matrix C = A * AT
C = * =
4 3 1 -2 -2 -4
1 2 3 -1 -3 -2
2 3 2 -3 -1 -3
4 1 2
3 2 3
1 3 2
-2 -1 -3
-2 -3 -1
-4 -2 -3
50 29 39
29 28 26
39 26 36
Finding the Covariance Matrix
4 3 1 -2 -2 -4
1 2 3 -1 -3 -2
2 3 2 -3 -1 -3
7. To find the eigenvalues of a n*n matrix we need to solve the following equation:
det(C – 𝝀I) =0
– = =
= – 𝝀3 + 114 𝝀 2 – 1170 𝝀 + 2548 = 0
Solving the above equation gives us the roots as
𝝀 1 = 102.86
𝝀 2 = 8.06
𝝀 3 = 3.07
Finding the Eigenvalues
50 29 39
29 28 26
39 26 36
50 - 𝝀 29 39
29 28 - 𝝀 26
39 26 36 - 𝝀
(50 – 𝝀) [ (28- 𝝀)(36- 𝝀) – 26*26 ]
+ 29 [ 26*39 – 29*(36- 𝝀) ]
+ 39 [ 29*26 – (28- 𝝀)*39 ]
Since the eigenvalue 𝝀 3 is very less it can be left out and we can carry
out the operations with 𝝀 1 and 𝝀 2
𝝀 0 0
0 𝝀 0
0 0 𝝀
8. Lets find the first eigenvector by solving the equation:
Cx = 𝝀1x
x = 102.86
Let z = 1,
eq1 ⇒ – 52.86 x + 29 y + 39 = 0………...eq4
eq2 ⇒ 29 x – 74.86 y + 26 = 0…………..eq5
solving these we get
y = 0.682 x………eq6
Replacing eq6 in eq4 :
– 52.86 x + 29 * 0.682 x + 39 = 0 ⇒ x = 1.178
Finding the Eigenvectors
50 29 39
29 28 26
39 26 36
x
y
z
x
y
z
Solving this gives us three equations:
– 52.86 x + 29 y + 39 z = 0………..eq1
29 x – 74.86 y + 26 z = 0………….eq2
39 x + 26 y – 66.86 z = 0………….eq3
Therefore the eigenvector for the eigenvalue 102.86 is
(1.178 , 0.803 , 1)
This is also known as Principal Component 1 (PC1)
9. 50 29 39
29 28 26
39 26 36
Let’s find the second eigenvector by solving the equation:
Cx = 𝝀2x
x = 8.06
Let z = 1,
eq1 ⇒ 41.94 x + 29 y + 39 = 0……………eq4
eq2 ⇒ 29 x + 19.94 y + 26 = 0……………eq5
solving these we get
y = – 1.714 x………eq6
Replacing eq6 in eq4 :
41.94 x + 29 * (– 1.714) x + 39 = 0 ⇒ x = 5.021
x
y
z
x
y
z
Solving this gives us three equations:
41.94 x + 29 y + 39 z = 0………….eq1
29 x + 19.94 y + 26 z = 0………….eq2
39 x + 26 y + 27.94 z = 0………….eq3
Therefore the eigenvector for the eigenvalue 8.06 is
(5.021 , – 8.605 , 1)
This is also known as Principal Component 2 (PC2)
50 29 39
29 28 26
39 26 36
Finding the Eigenvectors
10. So to get the axes of the new 2D plot we need to find the unit vector along the principal components:
Unit vector along PC1 =
(1.178,0.803,1)
(1.178)2 + (0.803)2 + (1)2
= ( 0.676, 0.461, 0.574 )
Unit vector along PC2 =
(5.021,−8.605,1)
(5.021)2 + (−8.605)2 + (1)2
= ( 0.501, – 0.859, 0.099)
Getting the new axes
12. Variation in PCA for each PC is determined by dividing the eigenvalue by sample size -1
Variation for PC1 = 102.86/5 = 20.572
Variation for PC2 = 8.06/5 = 1.612
Variation for PC3 = 3.07/5 = 0.614
Total variation = 22.798
Percentage Variation:
PC1 = 20.572 / 22.798 % = 90.2 %
PC2 = 1.612 / 22.798 % = 7.07 %
PC3 = 0.614 / 22.798 % = 2.73 %
Variation in PCA
90.2
7.07
2.73
0
10
20
30
40
50
60
70
80
90
100
PC 1 PC 2 PC 3
SCREE PLOT
13. Application
The principal component analysis is a widely used unsupervised learning method to
perform dimensionality reduction.
1. used for finding hidden patterns if data has high dimensions like in finance, data
mining, Psychology
2. Used in image compression
3. Used in noise cancellation
14. Advantages and Disadvantages
Advantages:
1. Less misleading data means model accuracy improves.
2. Fewer dimensions mean less computing. Less data means that algorithms train faster.
3. Less data means less storage space required.
4. Removes redundant features and noise.
5. Dimensionality Reduction helps us to visualize the data that is present in higher
dimensions in 2D or 3D
Disadvantages:
1. While doing dimensionality reduction, we lost some of the information, which can
possibly affect the performance of subsequent training algorithms.
2. It can be computationally intensive.
3. Transformed features are often hard to interpret.
4. It makes the independent variables less interpretable.