Download to read offline


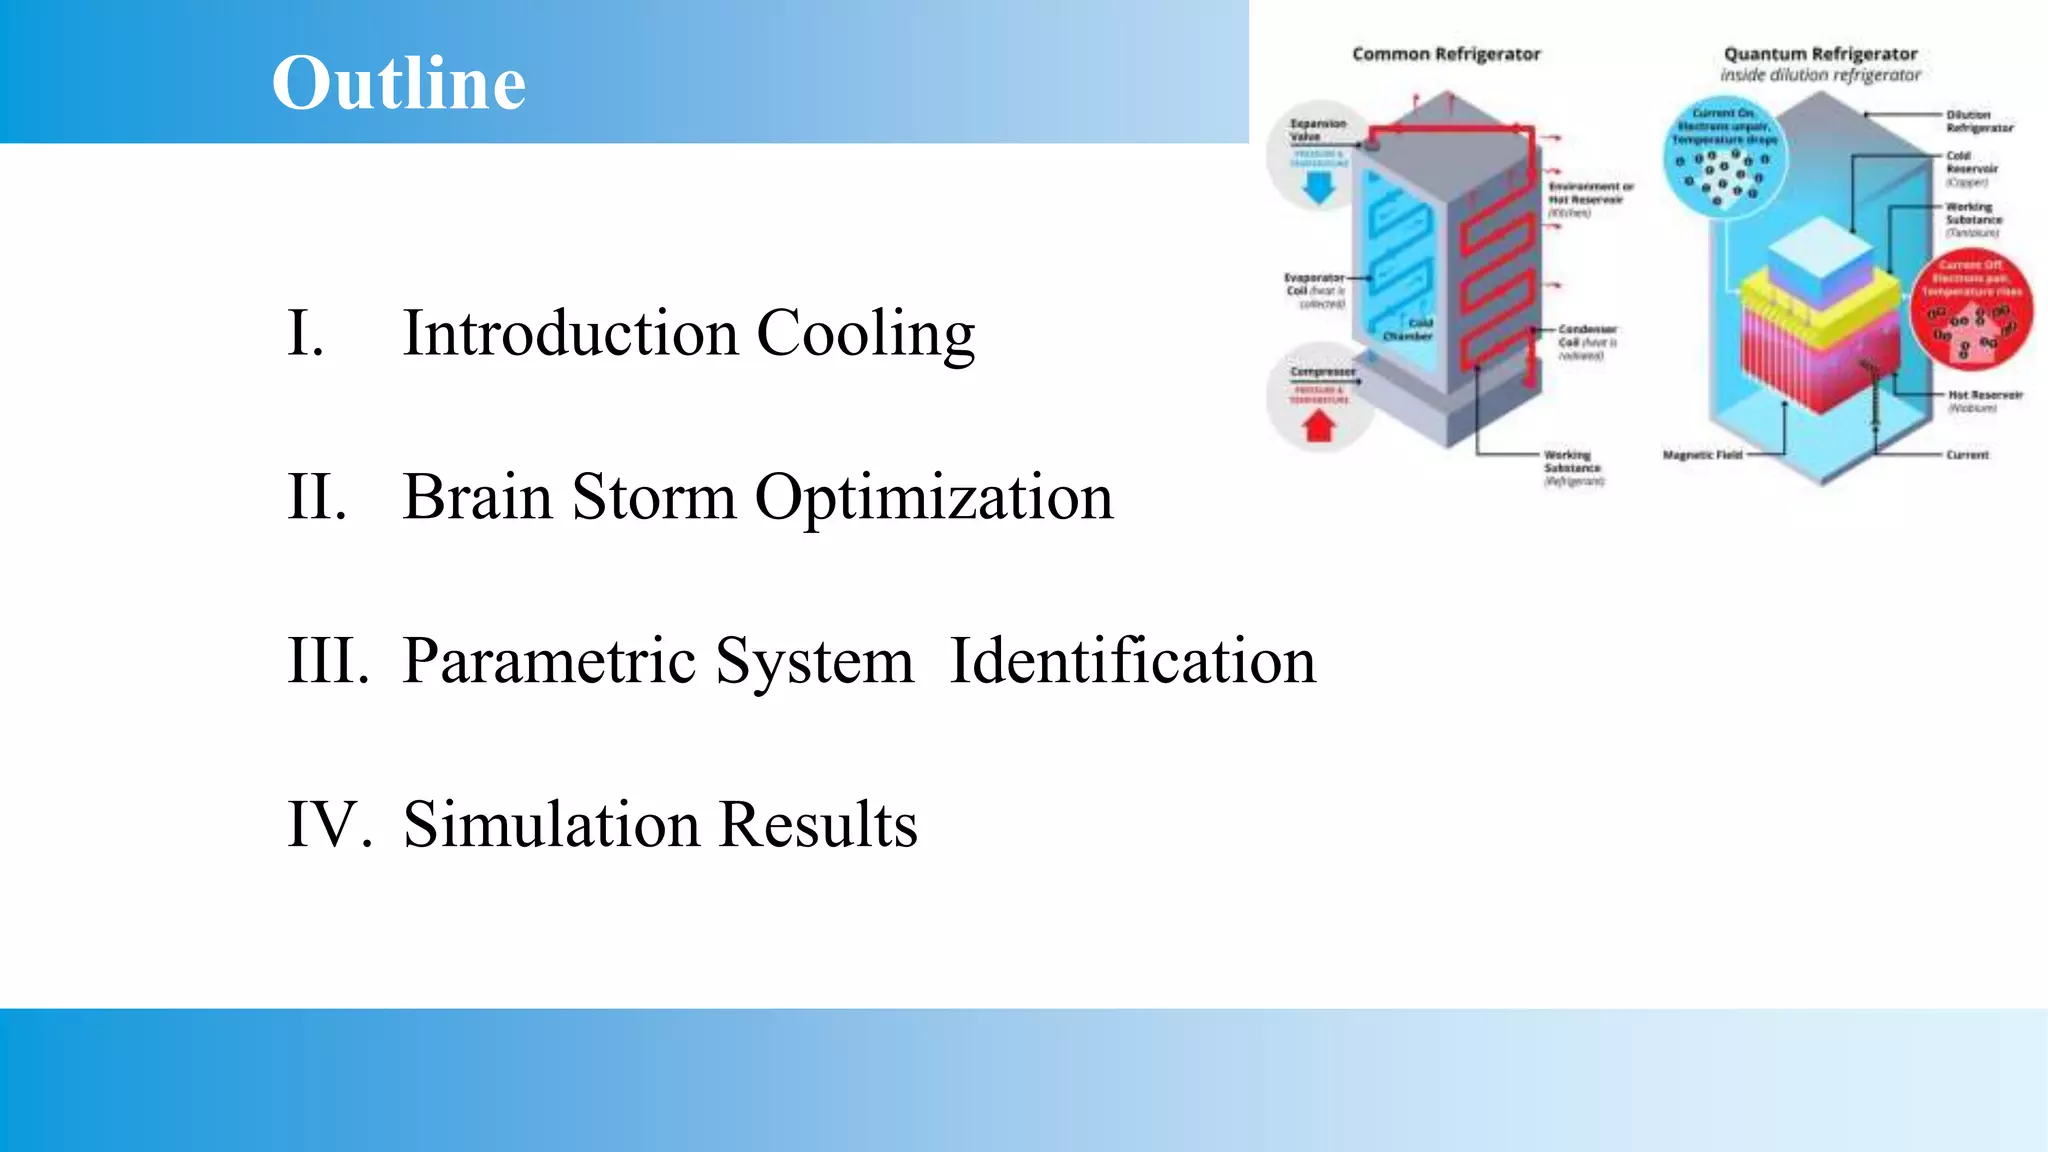


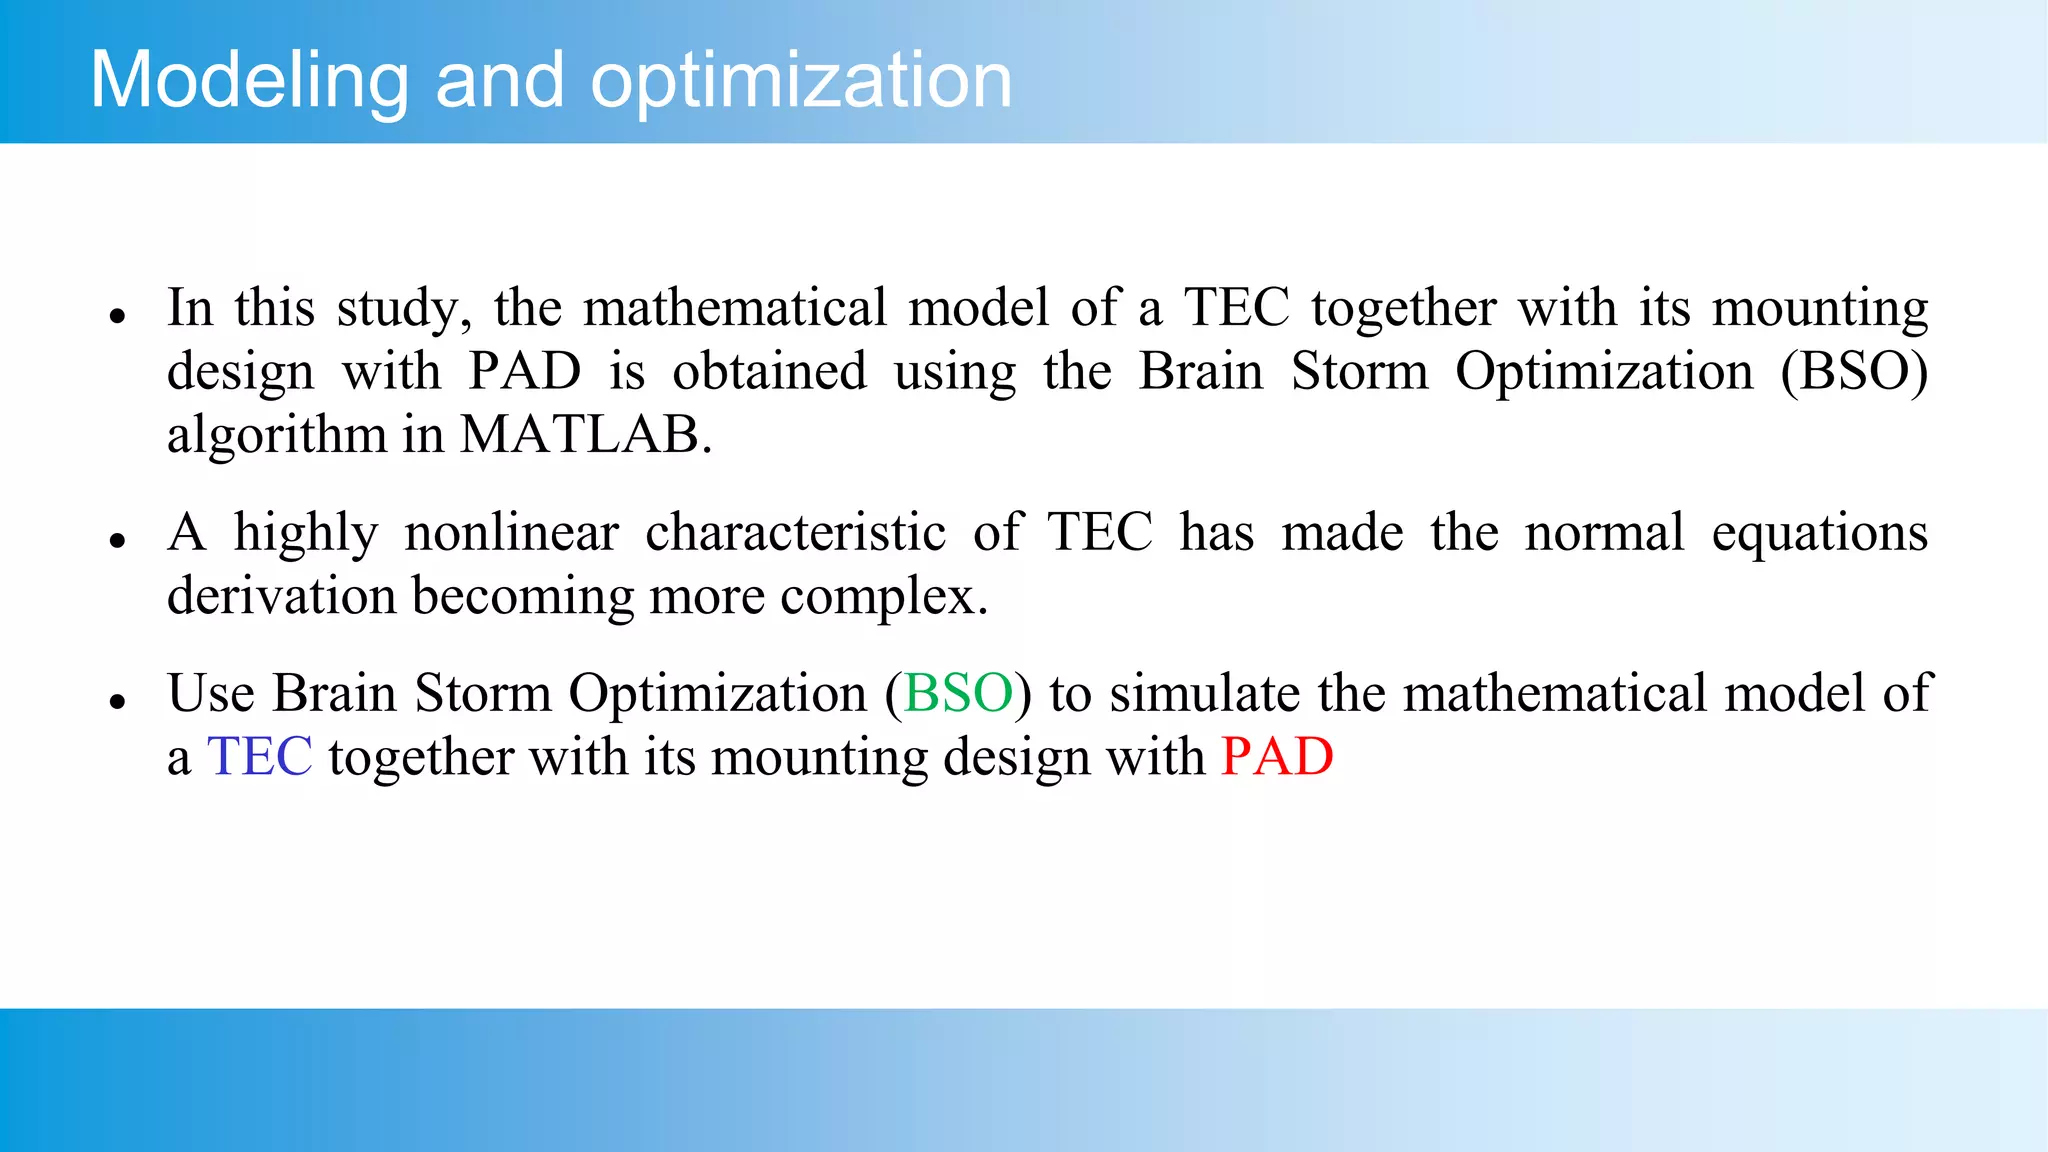


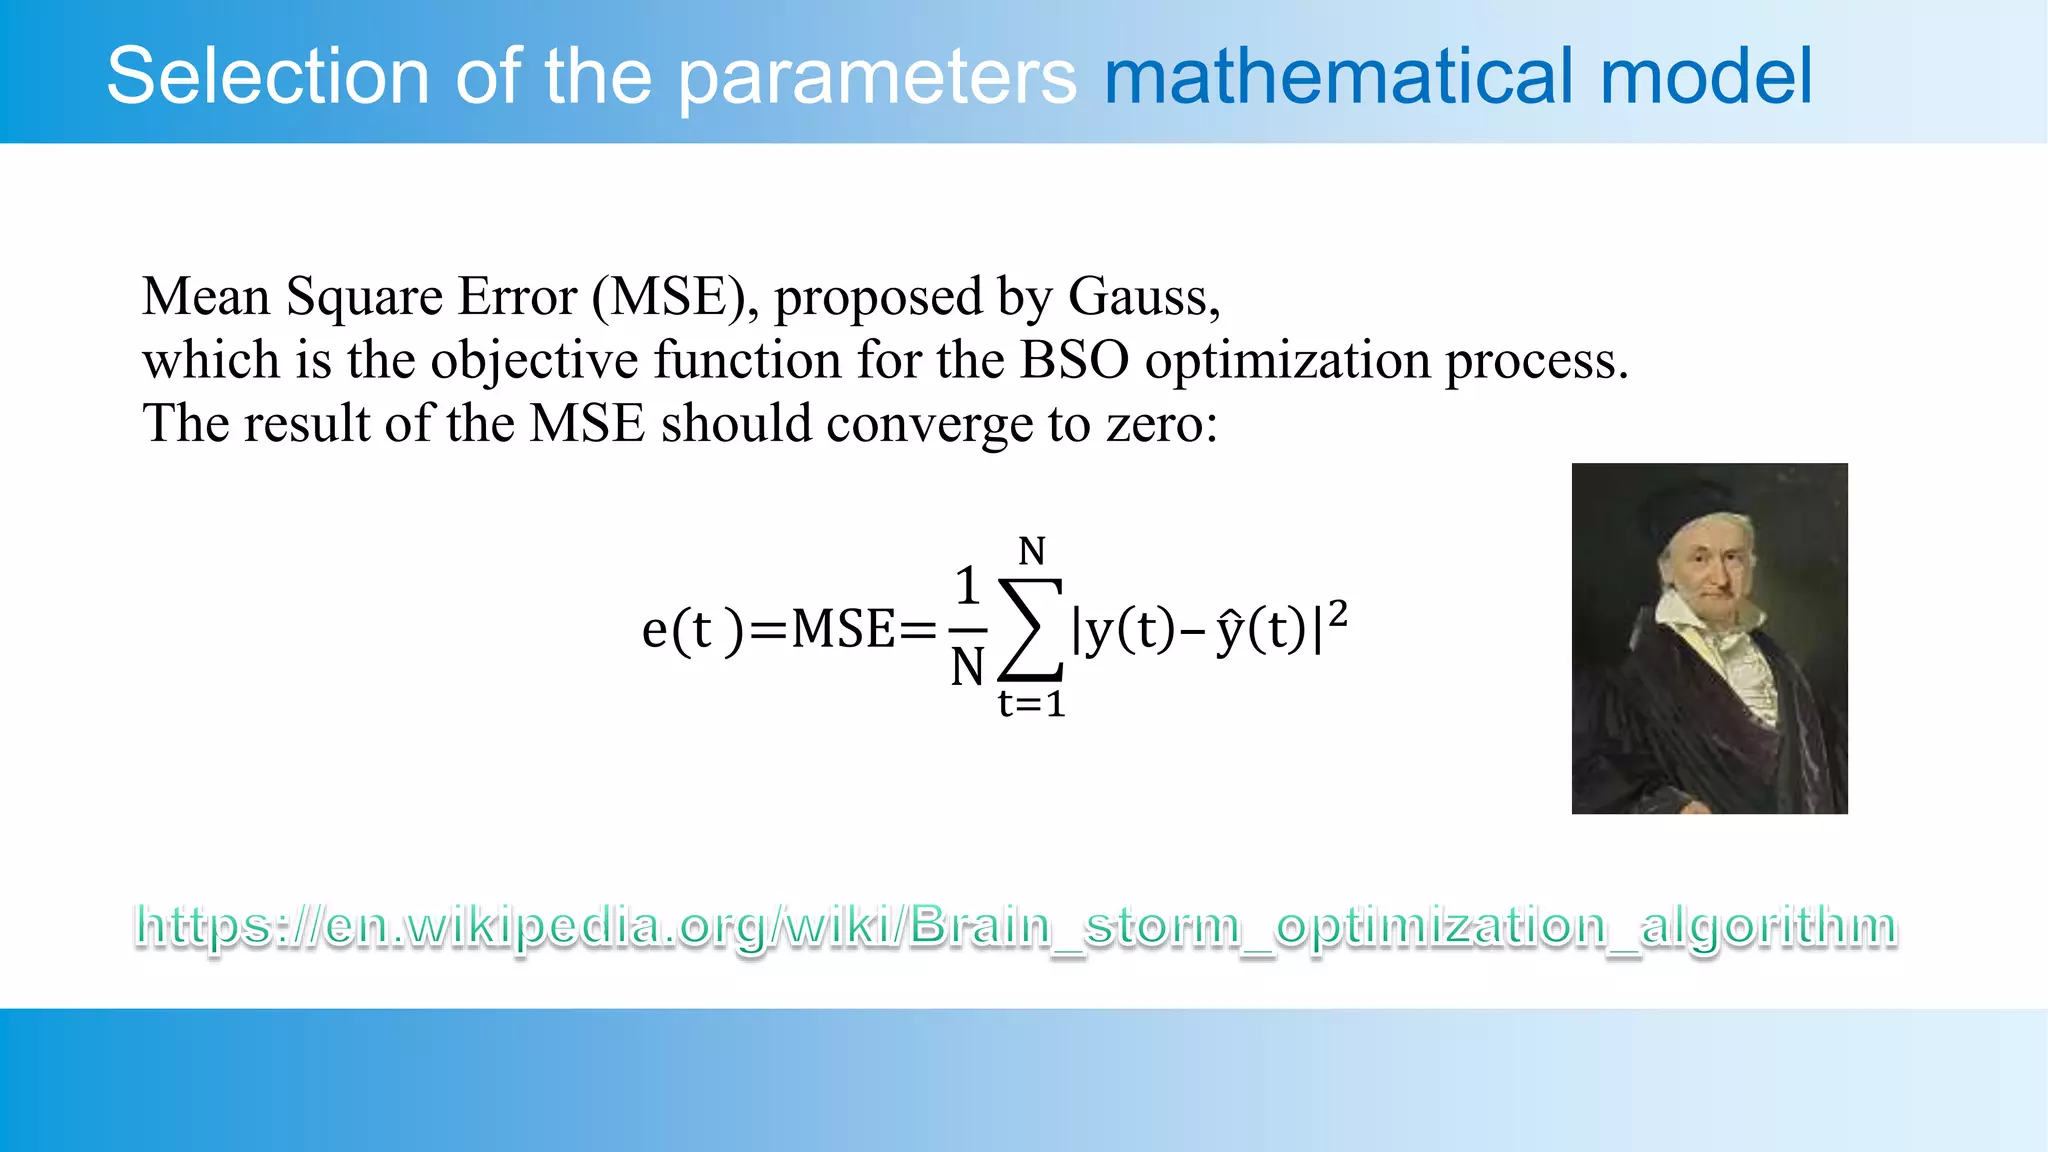


This document presents an analysis of a semiconductor-based micro refrigerator designed for quantum computing devices, focusing on optimization through a brain storm optimization algorithm. It discusses the development of a mathematical model for a thermoelectric cooler, including its application for cooling a photon avalanche diode, and details the processes involved in parametric system identification. The findings include a quick convergence of the mean square error as the objective function, demonstrating the effectiveness of the optimization method employed.