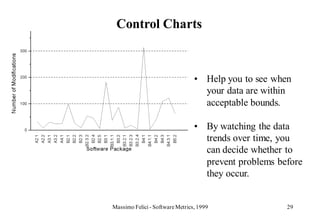
SlideShare a Scribd company logo
1 of 119
Software Metrics
         Massimo Felici


   Massimo Felici - Software Metrics, 1999   1
Overview


Part I:      Introduction to Software Metrics

Part II:     Introduction to SQUID

Part III:    Case Studies

Part IV:     SQUID Tool Demo


            Massimo Felici - Software Metrics, 1999   2
Part I
Introduction to Software Metrics


          Massimo Felici - Software Metrics, 1999   3
Introduction to Software Metrics
             Overview
• Measurement: what is it and why do it?
• The basic of measurement
• Software metrics data collection
• Analysing software measurement data
• Measuring internal product attributes: size
• Measuring internal product attribute: structure
• Measuring external product attribute
• Software reliability: measurement and prediction

             Massimo Felici - Software Metrics, 1999   4
Measurement: what is it and why do it?


     “Measurement is the process by which
     numbers or symbols are assigned to attributes
     of entities in the real world in such a way as to
     describe them according to clearly defined
     rules.”


             Massimo Felici - Software Metrics, 1999     5
Measurement Examples


         height
                                                   speed


weight


         Massimo Felici - Software Metrics, 1999           6
Measurement in Software Engineering

• Neglect of measurement in software engineering (e.g.,
  unclear objectives, unclear costs, prediction vs
  production, not evidence for new technologies)

• Objectives for software measurement (e.g., manager and
  engineer viewpoints)

• Measurement for understanding, control and improvement


                  Massimo Felici - Software Metrics, 1999   7
Diverse Quality Viewpoints


           I want it easy to
        understand and cheap
              to modify


                I want low risk and
               an easy demonstration


     Massimo Felici - Software Metrics, 1999   8
Diverse Quality Needs
  Different Systems
  or Different Parts                             Management
  of Same System                                 Statistics


   Food
                                                          Don’t Apply Critical
                                                          Qualities to Total Systems


                                                                   Guidance
Engine Control          Seat Bookings

                         Massimo Felici - Software Metrics, 1999                 9
User View
• Software that meets user’s needs
• Based around users tasks
     – Sometimes very context dependent
• Supported by
     – Reliability modelling
     – Performance modelling
     – Usability laboratories


                    Massimo Felici - Software Metrics, 1999   10
The Scope of Software Metrics
• Cost and effort estimation
• Productivity models and measures
• Data collection
• Quality models and measures (ISO 9126)
• Reliability models
• Performance evaluation and models
• Structural and complexity metrics
• Management by metrics
• Evaluation of methods and tools
• Capability maturity assessment (CMM)

         Massimo Felici - Software Metrics, 1999   11
The Basics of Measurement
• Empirical relations (that is, mappings from the empirical
  real world to a formal mathematical world)

• The rules of mapping
   “measurement is defined as a mapping from the
   empirical world to the formal relational world.
   Consequently, a measure is the number or symbol
   assigned to an entity by this mapping in order to
   characterise an attribute”

• The representation condition of measurement:
   “a mapping has to preserve an empirical relation by a
   numerical relation”
                  Massimo Felici - Software Metrics, 1999     12
An Example of Measure
         Mr. A                   Mr. B                       Mr. C


Empirical relation:
A taller than B taller than C
Mathematical relation:
height of A greater than height of B greater than height of C
height_A=1,7m > height_B=1,6m > height_C=1,5m

                   Massimo Felici - Software Metrics, 1999           13
Measurement and Models

• Defining attributes (e.g., size, complexity, etc.)

• Direct and indirect measurement

• Measurement for prediction
   “A prediction system consists of a mathematical model
   together with a set of prediction procedures for determining
   unknown parameters and interpreting results” (Littewood, 1988)


                       Massimo Felici - Software Metrics, 1999   14
Examples of Common Indirect Measures
Programmer productivity                             LOC produced
                                                person months of effort

Module defect density                           number of defects
                                                   module size

Defect detection efficiency                     number of defects detected
                                                  total number of defects

Requirements stability                          number of initial requiremen ts
                                                 total number of requiremen ts

Test effectiveness ratio                        number of items covered
                                                  total number of items

System spoilage                                 effort spent fixing faults
                                                   total project effort
                    Massimo Felici - Software Metrics, 1999                       15
Measurement Scales and Scale Types

 • Nominal (e.g., labelling, classifying entities)

 • Ordinal (e.g., level of severity)

 • Interval (e.g., temperature in degree Celsius)

 • Ratio (e.g., length of physical objects)

 • Absolute (e.g., counting entities)


             Massimo Felici - Software Metrics, 1999   16
An Example of Interval Scale

• Measure air temperature on a Fahrenheit or Celsius scale

• Transform Celsius to Fahrenheit by using the transformation

    F    9 5 C 32

• Compare intervals between the two scales

• Not compare ratio of the two scales (e.g., by two-thirds, 50%, etc.)


                       Massimo Felici - Software Metrics, 1999      17
Meaningfulness in Measurement


“A statement involving measurement is
meaningful if its truth value is invariant to
transformations of allowable scales.”


           Massimo Felici - Software Metrics, 1999   18
Software Metrics Data Collection

What is good data?
Correctness: Are they correct?
Accuracy:     Are they accurate?
Precision:    Are they appropriately precise?
Consistent:   Are they consistent?
Timed:        Are they associated with a particular
              activity or time period?
Repeatable: Can they be replicated?


               Massimo Felici - Software Metrics, 1999   19
How to define data
Derived Attributes
      Value                      Indirect
                                 Measurement

  Refined Data


                                 Direct
    Raw Data                     Measurement


    Process
    Product
    Resource


      Massimo Felici - Software Metrics, 1999   20
Terminology
                                                                   error
• A fault occurs when a human error results in
  a mistake in some software product. That is,
  the fault is the encoding of the human error.
                                                                      fault
• A failure is the departure of a system from its
  required behaviour.

• In order to remove faults we make changes.                                  failure
  One fault can result in multiple changes to
  one product (such as changing several section
  of a piece of code) or multiple changes to
  multiple products (such as change to
  requirements, design and code).                                   changes

                         Massimo Felici - Software Metrics, 1999                  21
What do we need to record of a problem?

   Location:       Where did the problem occur?
   Timing:         When did it occur?
   Symptom:        What was observed?
   End result:     Which consequence resulted?
   Mechanism: How did it occur?
   Cause:          Why did it occur?
   Severity:       How much was the user affected?
   Cost:           How much did it cost?

                 Massimo Felici - Software Metrics, 1999   22
Notice

Location     • This is only a generic schema for the information
               relevant to all type of incidents.
Timing
             • We can collect information about errors, faults,
Symptom
               failures and changes.
End result
             • Depending on the particular measurement
Mechanism      objectives (and the current sophistication of the
               metric program), it may not be necessary to
Cause
               collect all the information for each incident.
Severity
             • You cannot use the same form to capture fault and
Cost           failure data


                    Massimo Felici - Software Metrics, 1999        23
What do we need else?


 • Orthogonal classification

 • Levels of granularity

 • Data collection forms

 • Database


  Massimo Felici - Software Metrics, 1999   24
Analysing Software-Measurement Data


          • The nature of the data: sampling,
            population and data distribution

          • Purpose of the experiment: confirming a
            theory or exploring a relationship

          • Design consideration


          Massimo Felici - Software Metrics, 1999   25
Examples of Simple Analysis Techniques


         • Box plots
         • Scatter plots
         • Control charts
         • Bar graphs
         • Correlation
         • Fitting


            Massimo Felici - Software Metrics, 1999   26
Box Plots
Lower
           Median         Upper                                            Graphical
 Tail                      Tail           Outliners                        representation of the
                                                                           spread of data
                                  x                                    x

Lower Quartile   Upper Quartile


 0      20 40 60 80 100 120 140 160 180 200 220
                                              Control Flow Paths
                            Median: middle-ranked item in the data set
                            Upper Quartile: median of the values that are more than Median
                            Lower Quartile: median of the values that are less than Median
                            Box Length = Upper Quartile - Lower Quartile
                            Upper Tail=Upper Quartile + 1.5 Box Length
                            Lower Tail=Lower Quartile - 1.5 Box Length

                             Massimo Felici - Software Metrics, 1999                        27
Scatter Plot
                   18
                   16
                   14
Number of faults


                   12
                   10
                    8
                    6
                    4
                    2
                    0
                        0   100   200         300        400         500          600
                                             LOC

                                                            Scatter plots are used to represent
                                                            data for which two measures are
                                                            given for each entity.

                                        Massimo Felici - Software Metrics, 1999             28
Control Charts


                                 • Help you to see when
                                   your data are within
                                   acceptable bounds.

                                 • By watching the data
                                   trends over time, you
                                   can decide whether to
                                   prevent problems before
                                   they occur.


Massimo Felici - Software Metrics, 1999               29
Bar Graphs


Massimo Felici - Software Metrics, 1999   30
Measuring Internal Product Attributes: Size


                                           length


                                                        functionality


                                           complexity


             Massimo Felici - Software Metrics, 1999              31
Measuring Internal Product Attributes: Size
The combination of
different measures of the
same attribute can give
additional information

                                       height_A height_B


                              weight_A                         weight_B


                     Massimo Felici - Software Metrics, 1999         32
Measuring Length: Line Of Code (LOC)

        • Definition of Line Of Code

        • Programming language

        • Non-textual or external code

        • Specifications and designs

        • Predicting length

        • Reuse of code


           Massimo Felici - Software Metrics, 1999   33
Measuring Size: Functionality


• Function points (external inputs, external outputs,
  external inquiries, external files, internal files)

• COCOMO 2.0 approach

• DeMarco’s approach


                Massimo Felici - Software Metrics, 1999   34
Measuring Size: Complexity


• Problem with indirect measures (e.g., elapsed time)

• Complexity of a problem (e.g., algorithm complexity)


                Massimo Felici - Software Metrics, 1999   35
Measuring Internal Product Attributes: Structure

     • The control flow addresses the sequence in which
     instructions are executed in a program.


     • Data flow follows the trail of data item as it is
     created or handled by a program.


     • Data structure if the organisation of data itself,
     independent of the program.


                   Massimo Felici - Software Metrics, 1999   36
Flowgraph Model of Structure


A flowgraph is a directed graph in which two nodes,
the start node and the stop node, obey special
properties. The stop node has not leaving arcs, and
every node lies on some path from the start node to the
stop node.


             Massimo Felici - Software Metrics, 1999      37
Common Flowgraphs from Program Structure Models

           X1          X2            X3      Xn-1      Xn          X1; X2; X3; …; Xn-1; Xn;

                           A         if A then X                                  A         if A then X
                t                                                          t       f             else Y
     X                f                                            X                    Y


                      A                   case A of                    A       while A do X                    X
      a1        a2         an               a1: X1
                                            a2: X2             f                                                   f
X1   X2              ···        Xn
                                            …
                                                                   t
                                                                                                          t
                                            an: Xn                     X         repeat X until A              A


                                              Massimo Felici - Software Metrics, 1999                         38
Sequencing and Nesting

• Let F1 and F2 be two flowgraphs. Then the sequence of F1
  and F2 is the flowgraph formed by merging the stop node of
  F1 with the start node of F2.


• Let F1 and F2 be two flowgraphs. Suppose F1 has a procedure
  node x. Then the nesting of F2 onto F1 at x is the flowgraph
  formed from F1 by replacing the arc from x with the whole of
  F2 .


                    Massimo Felici - Software Metrics, 1999      39
Prime Flowgraphs


Prime flowgraphs are flowgraphs
that cannot be decomposed non-
trivially by sequencing and nesting.


   Massimo Felici - Software Metrics, 1999   40
The Generalised Notion of Structuredness

   Let S be a family of prime flowgraphs. A family of
graphs is S-structured (or, more simply, that the members
are S-graphs) if it satisfies the following recursive rules:
• Each member of S is S-structured.
• If F and F’ are S-structured graphs, then so are
   - the sequence of F and F’
   - the nesting of F’ on to F (whenever nesting of F’ onto
      F is defined).
• No flowgraph is an S-structured graph unless it can be
shown to be generated by a finite number of applications of
the above step.

                  Massimo Felici - Software Metrics, 1999      41
Prime Decomposition


Prime decomposition theorem:
Every flowgraph has a unique
decomposition into a hierarchy of
primes. (Fenton and Whitty, 1986)


     Massimo Felici - Software Metrics, 1999   42
Example of Hierarchical Measures


Number of nodes measure n

M1 : n ( F )   number of node in F for each prime F
                      k
M 2 : n F1 ;; Fk          n Fi        k 1
                     i 1
                                       k
M 3 : n F F1 ; Fk         nF               n Fi        2k for each prime F
                                      i 1


                     Massimo Felici - Software Metrics, 1999              43
Hierarchical Measures


Number of edges measure e

M1 : e F    number of edges in F for each prime F
                        k
M 2 : e F1 ;; Fk            n Fi
                       i 1
                                          k
M 3 : e F F1 ;; Fk          eF                e Fi        k for each prime F
                                         i 1


                      Massimo Felici - Software Metrics, 1999               44
Another Measure of Complexity


McCabe’s cyclomatic complexity measure

            vF            e n 2


         Massimo Felici - Software Metrics, 1999   45
Test Strategies

     • Black-box (or closed-box) testing, in
       which the test cases are derived from
       the specification or requirements
       without reference to the code itself or
       its structure.

     • White-box (or open-box) testing, in
       which the test cases are selected based
       on knowledge of the internal program
       structure.


Massimo Felici - Software Metrics, 1999      46
Test Coverage Strategies


Statement coverage, in which every program
statement is executed al least once.

Branch (or edge) coverage, in which every
edge lies on at least one path of the test cases.

Path coverage, in which every possible
program path is executed at least once.


            Massimo Felici - Software Metrics, 1999   47
Test Measures

Let T be a testing strategies that requires us to cover a class
of objects (e.g., paths, simple paths, linearly independent
paths, edges, statements, etc.). Two of the most important
test measures are

Minimum number of test cases = minimal number of
paths required to exercise all the objects T at least once.

Test Effectiveness Ratio (TER)
              number of T objects exercised at least once
       TER
                      total number of T objects


                   Massimo Felici - Software Metrics, 1999        48
Modularity and Information Flow Attributes


       “A module is a contiguous sequence of
       program statements, bounded by boundary
       elements, having an aggregate identifier.”
       (Yourdon and Constantine, 1979)


               Massimo Felici - Software Metrics, 1999   49
Module Call-Graph

                  Main
                                        scores
scores

Read_Scores                             Average
                   scores                                average

                                      average
               Calc_Av                                   Print_Av


               Massimo Felici - Software Metrics, 1999              50
Coupling


“Coupling is the degree of interdependence between
modules.” (Yourdon and Constantine, 1979)


           Massimo Felici - Software Metrics, 1999   51
An Ordinal Classification for Coupling
No coupling relation R0: x and y have no communication.
Data coupling relation R1: x and y communicate by
parameters.
Stamp coupling relation R2: x and y accept the same
record type as a parameter.
Control coupling relation R3: x passes a parameter to y
with the intention of controlling its behaviour (e.g., flag).
Common coupling relation R4: x and y refer to the same
global data.
Content coupling relation R5: x refers to the inside of y.

                  Massimo Felici - Software Metrics, 1999       52
A Measure of Coupling


              n
c x, y   i
            n 1
i   worst coupling relation Ri between x and y
n   number of interconne ctions between x and y
                     (Fenton and Melton, 1990)


             Massimo Felici - Software Metrics, 1999   53
Cohesion


“The cohesion of a module is the extent
to which its individual components are
needed to perform the same task.”


       Massimo Felici - Software Metrics, 1999   54
An Ordinal Scale for Cohesion
Functional: the module performs a single well-defined function.
Sequential: the module performs more than one function, but they
occur in an order prescribed by the specification.
Communicational: the module performs multiple functions, but all
on the same body of data.
Procedural: the module performs more than one function, and they
are related only to a general procedure affected by the software.
Temporal: the module performs more than one function, and they
are related only by the fact that they must occur within the same
timespan.
Logical: the module performs more than one function, and they are
related only logically.
Coincidental: the module performs more than one function, and
they are unrelated.
                   Massimo Felici - Software Metrics, 1999          55
A Simple Measure of Cohesion


                 number of modules having functional cohesion
Cohesion ratio
                           total number of modules


                     Massimo Felici - Software Metrics, 1999   56
Information Flow

Local direct flow exists if either a module invokes a second
module and passes information to it or the invoked module
returns a result to the caller.

Local indirect flow exists if the invoked module returns
information that is subsequently passed to a second invoked
module.

Global flow exists if information flows from one module to
another via a global data structure.


                   Massimo Felici - Software Metrics, 1999   57
Measures of Information Flow

fan-in(M) is the number of local flows that terminate at M, plus the
number of data structures from which information is retrieved by M.

fan-out(M) is the number of local flows that emanate from M, plus the
number of data structures that are updated by M.

Information flow complexity(M)=length(M)*(fan-in(M)*fan-out(M))2,
Henry and Kafura

Shepperd complexity(M)=(fan-in(M)*fan-out(M))2, Shepperd


                       Massimo Felici - Software Metrics, 1999   58
Object-Oriented Metrics

Metric 1: weighted methods per class (WMC)

Metric 2: depth of inheritance tree (DIT)

Metric 3: number of children (NOC)

Metric 4: coupling between object classes (CBO)

Metric 5: response for class (RFC)

Metric 6: lack of cohesion metric (LCOM)


             Massimo Felici - Software Metrics, 1999   59
Data Structure Metrics

There have been few attempts to define measures of actual
data items and their structure. Two examples:


Number of distinct operand = number of variables + number of
unique constants + number of labels


              Database size in bytes or characteres
D/P
        Program size in delivered source instructio n (DSI)
                                                             (Boehm)

                   Massimo Felici - Software Metrics, 1999             60
Measuring External Product Attributes

• What is quality for the final product?

• What is quality for the end user?

• How can external quality be measured?

• What is the relation between external and internal attributes?

• Is quality a general concept?


                    Massimo Felici - Software Metrics, 1999        61
Modeling Software Quality: ISO 9126
                        Suitability      Functionality, a set of attributes that bear on the existence of
Functionality
                        Accuracy
                                         a set of functions and their specified properties. The
                      Interoperability
                                         functions are those that satisfy stated or implied needs.
                         Security

  Reliability
                         Maturity        Reliability, a set of attributes that bear on the capability of
                     Fault tolerance     software to maintain its level of performance under stated
                      Recoverability
                                         conditions for a stated period of time.
                    Understandability
   Usability
                       Learnability      Usability, a set of attributes that bear on the effort needed
                        Operability      for use, and on the individual assessment of such use, by a
  Efficiency         Time behaviour      stated or implied set of users.
                    Resouce behaviour

                       Analysability     Efficiency, a set of attributes that bear on the relationship
Maintainability       Changeability      between the level of performance of the software and the
                         Stability       amount of resources used, under stated conditions.
                        Testability

                       Adaptability
                                         Maintainability, a set of attributes that bear on the effort
  Portability
                       Installability
                                         needed to make specified modifications.
                                         Portability, a set of attributes that bear on the ability of
                      Conformance

                      Replaceability
                                         software to be transferred from one environment to another.

                                         Massimo Felici - Software Metrics, 1999                      62
Measuring Aspects of Quality

Defects-based quality measures


                                       Usability measures


Maintainability measures


           Massimo Felici - Software Metrics, 1999          63
Defect Density Measure


                    number of known defects
defect density
                         product size


          Massimo Felici - Software Metrics, 1999   64
Defect Density Warnings

• definition of defect
• distinction between defect density and defect rate
• definition of software size
• interpretation of defect density measures (defect finding)
• no faults free
• seriousness of faults
• variability of users


                   Massimo Felici - Software Metrics, 1999     65
Usability Measures


• difficult to define usability

• internal measures of usability

• the external view of usability is environment dependent


                   Massimo Felici - Software Metrics, 1999   66
Maintainability Measures


• corrective maintainability

• adaptive maintainability

• preventive maintainability

• perfective maintainability


     Massimo Felici - Software Metrics, 1999   67
External View of Maintainability

 Mean Time To Repair (MTTR)
 • problem recognition time
 • administrative delay time
 • maintenance tools collection time
 • problem analysis time
 • change specification time
 • changing time (including testing and review)


          Massimo Felici - Software Metrics, 1999   68
Other Environmental-Dependent
       Maintainability Measures

• ratio of total change implementation time to total
  number of changes implemented

• number of unresolved problems

• time spent on unresolved problems

• percentage of changes that introduce new faults

• number of modules modified to implement a change


                Massimo Felici - Software Metrics, 1999   69
Software Reliability
Measurement and Prediction


 • What is software reliability?

 • Software reliability vs. hardware reliability


   Massimo Felici - Software Metrics, 1999         70
The Basic Problem of Reliability Theory

  • The basic problem of reliability theory is to
    predict when a system will eventually fail.

  • Hardware reliability concerns normally with
    component failures due to physical wear (e.g.,
    corrosion, shock, over-heating, etc.).

  • Such failures are probabilistic in nature, that is,
    we usually do not know exactly when something
    will fail, but we know that the product eventually
    will fail, so we can assign a probability that the
    product will fail at a particular point in time.

               Massimo Felici - Software Metrics, 1999    71
Basic Reliability Theory


Probability density function                          f t

                                                             t
Distribution function                                Ft          f t dt
                                                            0


Reliability function                                 Rt     1 Ft


                  Massimo Felici - Software Metrics, 1999                 72
Basic Reliability Theory


Mean Time To Failure (MTTF)                        ET       t f t dt

Mean Time To Recover (MTTR)


Mean Time Between Failure (MTBF)                   MTBF = MTTF + MTTR


                  Massimo Felici - Software Metrics, 1999          73
The Software Reliability Problem
     Software Reliability vs. Hardware Reliability

• There are many reasons for software to fail, but none
  involves wear and tear.
• Usually, software fails because of a design problem.
• Other failures occur when the code is written, or
  when changes (e.g., changed requirements, revised
  design, corrections of existing problems, etc.) are
  introduced to a working system.
• Ideally, we want our changes implemented without
  introducing new faults, so that by fixing a known
  problem we increase the overall reliability of the
  system.

             Massimo Felici - Software Metrics, 1999      74
The Software Reliability Problem
       Software Reliability vs. Hardware Reliability


• When hardware fails, the problem is fixed by replacing
  the failed component with a new or repaired one, so that
  the system is restored to its previous reliability. Rather
  than growing, the reliability is simply maintained.
• The key distinction between software reliability and
  hardware reliability is the difference between intellectual
  failure (usually due to design faults) and physical failure.
• Although hardware reliability can also suffer from design
  faults, the extensive theory of hardware reliability does
  not deal with them.

               Massimo Felici - Software Metrics, 1999      75
Parametric Reliability Growth Model

       • Geometric

       • Jelinski-Moranda

       • Littlewood-Verrall

       • Musa basic


          Massimo Felici - Software Metrics, 1999   76
Failure Data for Reliability Modeling (Musa)


             Massimo Felici - Software Metrics, 1999   77
Comparison of Several Reliability Models


            Massimo Felici - Software Metrics, 1999   78
Choosing the Best Model


• Uncertainty about the operational environment

• Uncertainty about the effect of fault removal

• The behaviour of models depends greatly on the data
  to witch they are applied. In fact, the accuracy of
  models also varies from one data set to another.
  Sometimes no parametric prediction system can
  produce reasonably accurate results.


                Massimo Felici - Software Metrics, 1999   79
Resource Measurement

    Productivity


                                        Teams


    Tools


   Massimo Felici - Software Metrics, 1999      80
Standards and Approaches

• ISO 9126
• IEEE 912
• Capability Maturity Model (CMM)
  Software Engineering Institute (SEI)
• SPICE
  European Software Institute (ESI)
• Goal Question Metric (GQM)
  Victor Basili
• SQUID

       Massimo Felici - Software Metrics, 1999   81
Goal Question Metric (GQM)

The Goal Question Metric approach provides a
framework involving three main steps:

1. List the major goals of the development or
maintenance project.

2. Derive from each goal the questions that must be
answered to determine if the goals are being met.

3 Decide what must be measured in order to be able
to answer the questions adequately.


              Massimo Felici - Software Metrics, 1999   82
Capability Maturity Model (CMM)
                                                     Level 5:
                                                    Optimizing
                                     Level 4:
                                     Managed
                        Level 3:
                        Define
            Level 2:                    Level 1: Initial
           Repeatable                       No attempt to standardise process
Level 1:                                Level 2: Repeatable
 Initial                                    Disciplined process
                                        Level 3: Defined
                                            Standard, consistent process
                                        Level 4: Managed
                                            Predictable process
                                        Level 5: Optimising
                                            Continuously improving process

                            Massimo Felici - Software Metrics, 1999             83
References
Fenton, N.E., Pfleeger, S.L.: Software Metrics: A Rigorous & Practical Approach,
Second Edition. International Thomson Computer Press, 1996.
ISO/IEC 9126, Information technology - Software quality characteristics and metrics.
IEEE Std 982.1-1988, IEEE Standard Dictionary of Measures to Produce Reliable
Software. IEEE, 1988.
IEEE Std 982.2-1988, IEEE Guide for the Use of IEEE Standard Dictionary of
Measures to Produce Reliable Software. IEEE, 1988.
Lyu, M. (Ed.): Handbook of Software Reliability Engineering, IEEE Computer
Society Press, 1996.
Musa, J., Iannino, A., Okomuto, K.: Software Reliability: Measurement, Prediction
and Application. McGraw-Hill, New York, 1987.
Salamon, W.J., Wallace, D.R.: NISTIR 5459, Quality Characteristics and Metrics for
Reusable Software.


                           Massimo Felici - Software Metrics, 1999                     84
Part II
Introduction to SQUID


     Massimo Felici - Software Metrics, 1999   85
Massimo Felici - Software Metrics, 1999   86
Software QUality In the Development Process


The SQUID Project P8436 has been funded by the European
Commission within the ESPRIT Programme

SQUID Partners:
Keele University (UK), DELTA (DK), ENEA (IT), Engineering
Ingegneria Informatica S.p.A. (IT), TÜV-Nord (DE)


                  Massimo Felici - Software Metrics, 1999   87
SQUID Approach
• Provides support for product quality specification, control and
  evaluation
• Measurement-based
• Two types of measure
      – Internal measures relating to software and its development process
      – External measures relating to operational behaviour and the support
        process
• Problem
      – Software engineering research can not show a functional relationship
        between internal measures and external measures
• SQUID View
      – Controlling internal quality is likely to improve product quality
      – Collecting and analysing data will confirm whether any relationships
        exist in your own organisation
                        Massimo Felici - Software Metrics, 1999            88
Four Steps to Quality

• Specify product quality requirements objectively:
      – Target values of measurable properties
• Assess feasibility of quality requirements before starting
      – Address feasibility problems as necessary
• Monitor progress towards achieving quality requirements
      – Set Targets for measures arising during product development
      – Monitor and control these measures
• Evaluate final product quality by comparing target values
  with actuals


                    Massimo Felici - Software Metrics, 1999           89
SQUID Approach
• SQUID approach requires
     – Integration of different types of measure (internal & external)
     – Integration of different models (quality models & development
       models)
• Problem
     – There are many different quality models
        • Different quality models lead to different external measures
     – Different organisations will have use different development models
        • Different development methods lead to different internal
           measures
• SQUID toolset supports configuration
     – Definition of organisation specific models and measures
     – Analysis methods independent of specific models and measures

                     Massimo Felici - Software Metrics, 1999           90
SQUID Approach


• SQUID support various processes needed to manage quality
     –   Quality Specification
     –   Quality Planning
     –   Quality Monitoring
     –   Quality Evaluation
• Basis of SQUID toolset functions


                       Massimo Felici - Software Metrics, 1999   91
SQUID Quality Process
   USER                         QUALITY                 USER
   NEEDS                         IN USE                 LAYER


   QUALITY                    QUALITY                  EXTERNAL
SPECIFICATION                EVALUATION                  LAYER


   QUALITY                     QUALITY                 INTERNAL
  PLANNING                     CONTROL                   LAYER

             Massimo Felici - Software Metrics, 1999              92
Quality Specification


User or organisational product requirements:
   – Mapped to appropriate elements of a quality model
   – Converted to required                  values          of   measurable
     operational properties
   – Checked for feasibility


                  Massimo Felici - Software Metrics, 1999                     93
Modeling the Development Process


            Development model                   Project Object

                          comprises
                                                       belongs to
        Project Object type


 Deliverable type             Development                Review point type
                              Activity type


                    Massimo Felici - Software Metrics, 1999                  94
Creating a Quality Model

                         Quality requirement           leads_to
                           specification                                 Product behavioural
                                                                            requirement

                                        addresses

                                                         belongs_to
                             Quality Characteristic                        Quality Model
           refine


                                                                             influences


 Internal Quality                                     External Quality
  Characteristic                                      Characteristic
                                 indicates


             quantified_by                                        quantified_by


Internal attribute                                    External Attribute


                        Massimo Felici - Software Metrics, 1999                                95
The SQUID View of Measurement


                            quantifies
     Unit                                         Attribute


        using
                                                              exhibits

                        measures
   Value                                              Project Object


       in_accordance_with

  Counting Rule


                Massimo Felici - Software Metrics, 1999                  96
Quality Planning
• After quality specification agreed
• Development process must be defined
   – Assumed to be one of several company standard
     methods
• Set targets for internal measures
   – SQUID assumes that controlling internal measures
     will deliver required quality
   – To monitor progress internal measures should be
     associated with different development activities
     and intermediate deliverables
   – Target values can be based on past performance:
       • What internal values where observed on project
         that achieved similar requirements
                Massimo Felici - Software Metrics, 1999   97
Quality Monitoring

• Compares actual values with target values during software
  production
   – To assess current status
• Compares estimates of future quality measures with target
  values
   – To re-assess feasibility
• Identifies “anomalies”
   – Unusual components (modules, documents, programs)
   – Possible problem components


                    Massimo Felici - Software Metrics, 1999   98
The SQUID Toolset Architecture

                                     Conf iguration


 Quality Evaluation                                          Quality Specif ication

                                   SQUID Database


                                                              Quality Planning
   Quality Monitoring


                                      Data Collation


                        Massimo Felici - Software Metrics, 1999                       99
Part III
Case Studies


Massimo Felici - Software Metrics, 1999   100
Case Studies


• A railways traffic control system for
  the Italian National Railways


• Antarctica TELESCIENCE Project


        Massimo Felici - Software Metrics, 1999   101
A Railways Traffic Control System
                            Project Summary

      Customer:                   Italian National Railways (FS)

      Project Type:               Research, Prototyping

      Target:                     Developing a new Control System

      System Aims:                Controlling Train Traffic in real-time
                                  No Safety

      Design Approach:            User Centred Design


Railways Traffic Control   Massimo Felici - Software Metrics, 1999         102
System
User Centred Design Approach
                           General Properties
       • Based on user activity
       • Iterative design process
       • User participation
       • Prototypes
             based on scenarios
             frequent modification
       • Instruments used for designing, analysing and evaluating
              video/record taping
              questionnaires
              interviews
Railways Traffic Control   Massimo Felici - Software Metrics, 1999   103
System
Phases of the Design Process

                                       Task analysis


                                                                     p
                                                                     r
                           Task allocation                           o
                                                                     t
                                                                     o
                                                   System design     t
                                                                     y
                                                                     p
                                                                     i
                             Job design                              n
                                                                     g


                                          Evaluation


Railways Traffic Control   Massimo Felici - Software Metrics, 1999       104
System
Schema of the Control System


                            Real System


                                                   Man Machine
                           System Monitor                                     Operator
                                                    Interface


                       Decision Support
                           System


Railways Traffic Control            Massimo Felici - Software Metrics, 1999              105
System
Quality Model

                                       Quality Model


Reliability            Usability        Functionality             Efficiency   Maintainability

                                    characteristic layer


                               subcharacteristic layers

                           attribute layer (internal/external)

Railways Traffic Control       Massimo Felici - Software Metrics, 1999                  106
System
Quality Requirements

                   Each system component:
                              - performs different tasks
                              - has different quality requirements

                    Component            Quality       Quality Subcharacteristic   Requirement
                                     Characteristic                                    Level
             System Monitor         Reliability                                    Very High
                                    Functionality     Function completeness        High
                                                      Function correctness         High
                                    Efficiency                                     Medium
                                    Maintainability   Corrective Maintainability   High
                                                      Adaptive Maintainability     Very High


Railways Traffic Control         Massimo Felici - Software Metrics, 1999                         107
System
Quantitative Targets


        Quantitative targets to monitor progress of components


    System      Quality         Quality              Quality              Attribute            Target
  Component Characteristic Subcharacteristic    Subsubcharacteristic
  System    Reliability    Estimated                                   Mean time            1*10E3 hours
  Monitor                  Reliability                                 between failures
                           Correctness                                 Module fault         10 faults per
                                                                       density            module
                            Test Accuracy      Test Coverage           Function           = 100 %
                                                                       coverage
                                                                       Branch coverage      70%
        .             .             .                     .                    .                  .
        .             .             .                     .                    .                  .
        .             .             .                     .                    .                  .


Railways Traffic Control        Massimo Felici - Software Metrics, 1999                                     108
System
Selection Criteria for Metrics

             • Objective
             • Observable
             • Repeatable
             • Predictive
             • Easy to collect
             • Valid across further projects

             • User Centred Design aspects (new methods
               and tools that should be exploited by metrics)

Railways Traffic Control   Massimo Felici - Software Metrics, 1999   109
System
Critical Issues


                           • Frequent modifications

                           • Iterative design process

                           • User Centred Design aspects


Railways Traffic Control       Massimo Felici - Software Metrics, 1999   110
System
Data Collection Activity


        • Use of the SQUID tool

        • Tools in order to automate the data collection activity

        • Reports


Railways Traffic Control      Massimo Felici - Software Metrics, 1999   111
System
Conclusion

          • Software Quality in User Centred Design

          • Interpretation of metrics within a specific context

          • Critical issues
               frequent modifications
               iterative design process
               User Centred Design aspects

          • Definition of new (user centred design) metrics


Railways Traffic Control   Massimo Felici - Software Metrics, 1999   112
System
Antarctica Telescience Project


      • The Telescience Project was launched end 1993 in the
        framework of the Italian National Antarctic Research
        Programme.

      • The aim is the development of an Advanced
        Supervision and Telecontrol System to remotely
        perform experimental activities in Antarctica during
        the austral winter.


Antarctica Telescience   Massimo Felici - Software Metrics, 1999   113
Project
Project Description
Development responsibility:                       ENEA, Division INN RIN INFAV
Estimated number of modules:                      40
Estimated code size:                              19.000 LOC
Expected man power required:                      7 staff year
Personnel assigned to the project staff:          8
Experience of the staff with CASE tools: Good
Experience of the staff with
quality measurement tools:                        None
Use of quality control tools
(other than SQUID):                               None
Programming language:                             C

Antarctica Telescience    Massimo Felici - Software Metrics, 1999            114
Project
Antarctica Telescience Project
                             Main Systems


• A set of Remote Laboratories in Antarctica

• A Supervision and Telecontrol Room in Antarctica

• An Electric Power Supply & Distribution System in Antarctica

• A Telecommunication System in Antarctica

• A Remote Man-Machine Interface System in Italy


Antarctica Telescience   Massimo Felici - Software Metrics, 1999   115
Project
Architecture of the Advanced Supervision and Telecontrol System

       Remote                Remote                   Remote                                 Remote
      lab. N° 1             lab. N° 2                lab. N° 3                              lab. N° n


                                                                          Supervision and
                                                                         Telecontrol Room


                                                                     Telecommunication
                                                                           System
Electric Power Supply
& Distribution System             Antarctica
                                                                   Remote Man-Machine
                                              Italy                  Interface System

   Antarctica Telescience      Massimo Felici - Software Metrics, 1999                         116
   Project
The Electric Power Supply and Distribution System
      • The Electric Power Supply & Distribution System
        (EPSDS) ensures that electricity produced by the on-site
        diesel generators is available to the equipment.
      • The experimental activities is intended to run
        unmanned for 8 months in Antarctica and the EPSDS
        must guarantee the power supply for such period
        without interruptions.
      • The EPSDS has stringent requirements.
      • The real-time control software is duplicated.
      • If the software fails catastrophically in both versions of
        the Electric Power Supply Subsystem, a back-up battery
        power can run for one hour.
  Antarctica Telescience   Massimo Felici - Software Metrics, 1999   117
  Project
The Remote Man-Machine Interface System

    • The MMI allows to perform scientific activities as well as
      to control and monitor the Antarctica base.

    • There are two types of users operators and scientists.

    • The Remote MMI system is based on 7 main subsystems:
       1. Data acquisition
       2. Information Presentation
       3. Command sending
       4. Simulation
       5. Operator training
       7. Data elaboration

Antarctica Telescience   Massimo Felici - Software Metrics, 1999   118
Project
Product Portion

Subproject                Product Portion Components

Electric Power Supply     PP1                   Electric Power Supply subsystem

Distribution system       PP2                   Electric Power Distribution subsystem

Remote MMI system 1       PP3                   Information presentation subsystem
                                                Command sending subsystem
                                                Simulation subsystem

Remote MMI system 2       PP4                   Mission planning support subsystem
                                                Operator training subsystem
                                                Data elaboration subsystem
                                                Data acquisition subsystem


 Antarctica Telescience   Massimo Felici - Software Metrics, 1999                 119
 Project

More Related Content

What's hot

Software architecture design ppt
Software architecture design pptSoftware architecture design ppt
Software architecture design pptfarazimlak
 
Software engineering project management
Software engineering project managementSoftware engineering project management
Software engineering project managementjhudyne
 
Pressman ch-22-process-and-project-metrics
Pressman ch-22-process-and-project-metricsPressman ch-22-process-and-project-metrics
Pressman ch-22-process-and-project-metricsSeema Kamble
 
Chapter 15 software product metrics
Chapter 15 software product metricsChapter 15 software product metrics
Chapter 15 software product metricsSHREEHARI WADAWADAGI
 
Software testing methods, levels and types
Software testing methods, levels and typesSoftware testing methods, levels and types
Software testing methods, levels and typesConfiz
 
Architecture design in software engineering
Architecture design in software engineeringArchitecture design in software engineering
Architecture design in software engineeringPreeti Mishra
 
Software Configuration Management (SCM)
Software Configuration Management (SCM)Software Configuration Management (SCM)
Software Configuration Management (SCM)Er. Shiva K. Shrestha
 
Software Metrics - Software Engineering
Software Metrics - Software EngineeringSoftware Metrics - Software Engineering
Software Metrics - Software EngineeringDrishti Bhalla
 
Types of software testing
Types of software testingTypes of software testing
Types of software testingPrachi Sasankar
 
Design Concepts in Software Engineering-1.pptx
Design Concepts in Software Engineering-1.pptxDesign Concepts in Software Engineering-1.pptx
Design Concepts in Software Engineering-1.pptxKarthigaiSelviS3
 
Software design, software engineering
Software design, software engineeringSoftware design, software engineering
Software design, software engineeringRupesh Vaishnav
 

What's hot (20)

Software design
Software designSoftware design
Software design
 
Software architecture design ppt
Software architecture design pptSoftware architecture design ppt
Software architecture design ppt
 
Software engineering project management
Software engineering project managementSoftware engineering project management
Software engineering project management
 
Pressman ch-22-process-and-project-metrics
Pressman ch-22-process-and-project-metricsPressman ch-22-process-and-project-metrics
Pressman ch-22-process-and-project-metrics
 
Software Reliability
Software ReliabilitySoftware Reliability
Software Reliability
 
Software Maintenance
Software MaintenanceSoftware Maintenance
Software Maintenance
 
Chapter 15 software product metrics
Chapter 15 software product metricsChapter 15 software product metrics
Chapter 15 software product metrics
 
Software testing methods, levels and types
Software testing methods, levels and typesSoftware testing methods, levels and types
Software testing methods, levels and types
 
Software metrics
Software metricsSoftware metrics
Software metrics
 
Software testing
Software testing Software testing
Software testing
 
Architecture design in software engineering
Architecture design in software engineeringArchitecture design in software engineering
Architecture design in software engineering
 
System testing
System testingSystem testing
System testing
 
Software Configuration Management (SCM)
Software Configuration Management (SCM)Software Configuration Management (SCM)
Software Configuration Management (SCM)
 
Sqa plan
Sqa planSqa plan
Sqa plan
 
Sdlc models
Sdlc modelsSdlc models
Sdlc models
 
Software process
Software processSoftware process
Software process
 
Software Metrics - Software Engineering
Software Metrics - Software EngineeringSoftware Metrics - Software Engineering
Software Metrics - Software Engineering
 
Types of software testing
Types of software testingTypes of software testing
Types of software testing
 
Design Concepts in Software Engineering-1.pptx
Design Concepts in Software Engineering-1.pptxDesign Concepts in Software Engineering-1.pptx
Design Concepts in Software Engineering-1.pptx
 
Software design, software engineering
Software design, software engineeringSoftware design, software engineering
Software design, software engineering
 

Similar to Software Metrics

Software Engineering 2 lecture slide
Software Engineering 2 lecture slideSoftware Engineering 2 lecture slide
Software Engineering 2 lecture slideAdil Mehmoood
 
Software Engineering.ppt
Software Engineering.pptSoftware Engineering.ppt
Software Engineering.pptHODCOMPUTER10
 
Week_01-Intro to Software Engineering-1.ppt
Week_01-Intro to Software Engineering-1.pptWeek_01-Intro to Software Engineering-1.ppt
Week_01-Intro to Software Engineering-1.ppt23017156038
 
Different Methodologies For Testing Web Application Testing
Different Methodologies For Testing Web Application TestingDifferent Methodologies For Testing Web Application Testing
Different Methodologies For Testing Web Application TestingRachel Davis
 
SOFTWARE ENGINEERING & ARCHITECTURE - SHORT NOTES
SOFTWARE ENGINEERING & ARCHITECTURE - SHORT NOTESSOFTWARE ENGINEERING & ARCHITECTURE - SHORT NOTES
SOFTWARE ENGINEERING & ARCHITECTURE - SHORT NOTESsuthi
 
Software Productivity Measurement
Software Productivity MeasurementSoftware Productivity Measurement
Software Productivity MeasurementAjeng Savitri
 
V1_I2_2012_Paper3.doc
V1_I2_2012_Paper3.docV1_I2_2012_Paper3.doc
V1_I2_2012_Paper3.docpraveena06
 
Improvement of Software Maintenance and Reliability using Data Mining Techniques
Improvement of Software Maintenance and Reliability using Data Mining TechniquesImprovement of Software Maintenance and Reliability using Data Mining Techniques
Improvement of Software Maintenance and Reliability using Data Mining Techniquesijdmtaiir
 
Intro softwareeng
Intro softwareengIntro softwareeng
Intro softwareengPINKU29
 
David vernon software_engineering_notes
David vernon software_engineering_notesDavid vernon software_engineering_notes
David vernon software_engineering_notesmitthudwivedi
 
Introduction to Software Engineering
Introduction to Software EngineeringIntroduction to Software Engineering
Introduction to Software EngineeringMadhar Khan Pathan
 
Vishal_Final_Evaluation_PPT
Vishal_Final_Evaluation_PPTVishal_Final_Evaluation_PPT
Vishal_Final_Evaluation_PPTVishal Sharma
 
Chapter 1-Object Oriented Software Engineering.pptx
Chapter 1-Object Oriented Software Engineering.pptxChapter 1-Object Oriented Software Engineering.pptx
Chapter 1-Object Oriented Software Engineering.pptxaroraritik30
 
Unit 2 SEPM_ Requirement Engineering
Unit 2 SEPM_ Requirement EngineeringUnit 2 SEPM_ Requirement Engineering
Unit 2 SEPM_ Requirement EngineeringKanchanPatil34
 
Software quality assurance (sqa) Parte II- Métricas del Software y Modelos d...
Software quality assurance (sqa)  Parte II- Métricas del Software y Modelos d...Software quality assurance (sqa)  Parte II- Métricas del Software y Modelos d...
Software quality assurance (sqa) Parte II- Métricas del Software y Modelos d...Renato Gonzalez
 
Software quality assurance lecture 1
Software quality assurance lecture 1Software quality assurance lecture 1
Software quality assurance lecture 1Abdul Basit
 
Software Engineering (Metrics for Process and Projects)
Software Engineering (Metrics for Process and Projects)Software Engineering (Metrics for Process and Projects)
Software Engineering (Metrics for Process and Projects)ShudipPal
 

Similar to Software Metrics (20)

Software Engineering 2 lecture slide
Software Engineering 2 lecture slideSoftware Engineering 2 lecture slide
Software Engineering 2 lecture slide
 
Software Engineering.ppt
Software Engineering.pptSoftware Engineering.ppt
Software Engineering.ppt
 
Week_01-Intro to Software Engineering-1.ppt
Week_01-Intro to Software Engineering-1.pptWeek_01-Intro to Software Engineering-1.ppt
Week_01-Intro to Software Engineering-1.ppt
 
Sw engg two mark question
Sw engg two mark questionSw engg two mark question
Sw engg two mark question
 
Different Methodologies For Testing Web Application Testing
Different Methodologies For Testing Web Application TestingDifferent Methodologies For Testing Web Application Testing
Different Methodologies For Testing Web Application Testing
 
SOFTWARE ENGINEERING & ARCHITECTURE - SHORT NOTES
SOFTWARE ENGINEERING & ARCHITECTURE - SHORT NOTESSOFTWARE ENGINEERING & ARCHITECTURE - SHORT NOTES
SOFTWARE ENGINEERING & ARCHITECTURE - SHORT NOTES
 
SE
SESE
SE
 
Software Productivity Measurement
Software Productivity MeasurementSoftware Productivity Measurement
Software Productivity Measurement
 
V1_I2_2012_Paper3.doc
V1_I2_2012_Paper3.docV1_I2_2012_Paper3.doc
V1_I2_2012_Paper3.doc
 
Improvement of Software Maintenance and Reliability using Data Mining Techniques
Improvement of Software Maintenance and Reliability using Data Mining TechniquesImprovement of Software Maintenance and Reliability using Data Mining Techniques
Improvement of Software Maintenance and Reliability using Data Mining Techniques
 
Intro softwareeng
Intro softwareengIntro softwareeng
Intro softwareeng
 
David vernon software_engineering_notes
David vernon software_engineering_notesDavid vernon software_engineering_notes
David vernon software_engineering_notes
 
Introduction to Software Engineering
Introduction to Software EngineeringIntroduction to Software Engineering
Introduction to Software Engineering
 
Vishal_Final_Evaluation_PPT
Vishal_Final_Evaluation_PPTVishal_Final_Evaluation_PPT
Vishal_Final_Evaluation_PPT
 
Chapter 1-Object Oriented Software Engineering.pptx
Chapter 1-Object Oriented Software Engineering.pptxChapter 1-Object Oriented Software Engineering.pptx
Chapter 1-Object Oriented Software Engineering.pptx
 
Software metrics
Software metricsSoftware metrics
Software metrics
 
Unit 2 SEPM_ Requirement Engineering
Unit 2 SEPM_ Requirement EngineeringUnit 2 SEPM_ Requirement Engineering
Unit 2 SEPM_ Requirement Engineering
 
Software quality assurance (sqa) Parte II- Métricas del Software y Modelos d...
Software quality assurance (sqa)  Parte II- Métricas del Software y Modelos d...Software quality assurance (sqa)  Parte II- Métricas del Software y Modelos d...
Software quality assurance (sqa) Parte II- Métricas del Software y Modelos d...
 
Software quality assurance lecture 1
Software quality assurance lecture 1Software quality assurance lecture 1
Software quality assurance lecture 1
 
Software Engineering (Metrics for Process and Projects)
Software Engineering (Metrics for Process and Projects)Software Engineering (Metrics for Process and Projects)
Software Engineering (Metrics for Process and Projects)
 

Software Metrics

  • 1. Software Metrics Massimo Felici Massimo Felici - Software Metrics, 1999 1
  • 2. Overview Part I: Introduction to Software Metrics Part II: Introduction to SQUID Part III: Case Studies Part IV: SQUID Tool Demo Massimo Felici - Software Metrics, 1999 2
  • 3. Part I Introduction to Software Metrics Massimo Felici - Software Metrics, 1999 3
  • 4. Introduction to Software Metrics Overview • Measurement: what is it and why do it? • The basic of measurement • Software metrics data collection • Analysing software measurement data • Measuring internal product attributes: size • Measuring internal product attribute: structure • Measuring external product attribute • Software reliability: measurement and prediction Massimo Felici - Software Metrics, 1999 4
  • 5. Measurement: what is it and why do it? “Measurement is the process by which numbers or symbols are assigned to attributes of entities in the real world in such a way as to describe them according to clearly defined rules.” Massimo Felici - Software Metrics, 1999 5
  • 6. Measurement Examples height speed weight Massimo Felici - Software Metrics, 1999 6
  • 7. Measurement in Software Engineering • Neglect of measurement in software engineering (e.g., unclear objectives, unclear costs, prediction vs production, not evidence for new technologies) • Objectives for software measurement (e.g., manager and engineer viewpoints) • Measurement for understanding, control and improvement Massimo Felici - Software Metrics, 1999 7
  • 8. Diverse Quality Viewpoints I want it easy to understand and cheap to modify I want low risk and an easy demonstration Massimo Felici - Software Metrics, 1999 8
  • 9. Diverse Quality Needs Different Systems or Different Parts Management of Same System Statistics Food Don’t Apply Critical Qualities to Total Systems Guidance Engine Control Seat Bookings Massimo Felici - Software Metrics, 1999 9
  • 10. User View • Software that meets user’s needs • Based around users tasks – Sometimes very context dependent • Supported by – Reliability modelling – Performance modelling – Usability laboratories Massimo Felici - Software Metrics, 1999 10
  • 11. The Scope of Software Metrics • Cost and effort estimation • Productivity models and measures • Data collection • Quality models and measures (ISO 9126) • Reliability models • Performance evaluation and models • Structural and complexity metrics • Management by metrics • Evaluation of methods and tools • Capability maturity assessment (CMM) Massimo Felici - Software Metrics, 1999 11
  • 12. The Basics of Measurement • Empirical relations (that is, mappings from the empirical real world to a formal mathematical world) • The rules of mapping “measurement is defined as a mapping from the empirical world to the formal relational world. Consequently, a measure is the number or symbol assigned to an entity by this mapping in order to characterise an attribute” • The representation condition of measurement: “a mapping has to preserve an empirical relation by a numerical relation” Massimo Felici - Software Metrics, 1999 12
  • 13. An Example of Measure Mr. A Mr. B Mr. C Empirical relation: A taller than B taller than C Mathematical relation: height of A greater than height of B greater than height of C height_A=1,7m > height_B=1,6m > height_C=1,5m Massimo Felici - Software Metrics, 1999 13
  • 14. Measurement and Models • Defining attributes (e.g., size, complexity, etc.) • Direct and indirect measurement • Measurement for prediction “A prediction system consists of a mathematical model together with a set of prediction procedures for determining unknown parameters and interpreting results” (Littewood, 1988) Massimo Felici - Software Metrics, 1999 14
  • 15. Examples of Common Indirect Measures Programmer productivity LOC produced person months of effort Module defect density number of defects module size Defect detection efficiency number of defects detected total number of defects Requirements stability number of initial requiremen ts total number of requiremen ts Test effectiveness ratio number of items covered total number of items System spoilage effort spent fixing faults total project effort Massimo Felici - Software Metrics, 1999 15
  • 16. Measurement Scales and Scale Types • Nominal (e.g., labelling, classifying entities) • Ordinal (e.g., level of severity) • Interval (e.g., temperature in degree Celsius) • Ratio (e.g., length of physical objects) • Absolute (e.g., counting entities) Massimo Felici - Software Metrics, 1999 16
  • 17. An Example of Interval Scale • Measure air temperature on a Fahrenheit or Celsius scale • Transform Celsius to Fahrenheit by using the transformation F 9 5 C 32 • Compare intervals between the two scales • Not compare ratio of the two scales (e.g., by two-thirds, 50%, etc.) Massimo Felici - Software Metrics, 1999 17
  • 18. Meaningfulness in Measurement “A statement involving measurement is meaningful if its truth value is invariant to transformations of allowable scales.” Massimo Felici - Software Metrics, 1999 18
  • 19. Software Metrics Data Collection What is good data? Correctness: Are they correct? Accuracy: Are they accurate? Precision: Are they appropriately precise? Consistent: Are they consistent? Timed: Are they associated with a particular activity or time period? Repeatable: Can they be replicated? Massimo Felici - Software Metrics, 1999 19
  • 20. How to define data Derived Attributes Value Indirect Measurement Refined Data Direct Raw Data Measurement Process Product Resource Massimo Felici - Software Metrics, 1999 20
  • 21. Terminology error • A fault occurs when a human error results in a mistake in some software product. That is, the fault is the encoding of the human error. fault • A failure is the departure of a system from its required behaviour. • In order to remove faults we make changes. failure One fault can result in multiple changes to one product (such as changing several section of a piece of code) or multiple changes to multiple products (such as change to requirements, design and code). changes Massimo Felici - Software Metrics, 1999 21
  • 22. What do we need to record of a problem? Location: Where did the problem occur? Timing: When did it occur? Symptom: What was observed? End result: Which consequence resulted? Mechanism: How did it occur? Cause: Why did it occur? Severity: How much was the user affected? Cost: How much did it cost? Massimo Felici - Software Metrics, 1999 22
  • 23. Notice Location • This is only a generic schema for the information relevant to all type of incidents. Timing • We can collect information about errors, faults, Symptom failures and changes. End result • Depending on the particular measurement Mechanism objectives (and the current sophistication of the metric program), it may not be necessary to Cause collect all the information for each incident. Severity • You cannot use the same form to capture fault and Cost failure data Massimo Felici - Software Metrics, 1999 23
  • 24. What do we need else? • Orthogonal classification • Levels of granularity • Data collection forms • Database Massimo Felici - Software Metrics, 1999 24
  • 25. Analysing Software-Measurement Data • The nature of the data: sampling, population and data distribution • Purpose of the experiment: confirming a theory or exploring a relationship • Design consideration Massimo Felici - Software Metrics, 1999 25
  • 26. Examples of Simple Analysis Techniques • Box plots • Scatter plots • Control charts • Bar graphs • Correlation • Fitting Massimo Felici - Software Metrics, 1999 26
  • 27. Box Plots Lower Median Upper Graphical Tail Tail Outliners representation of the spread of data x x Lower Quartile Upper Quartile 0 20 40 60 80 100 120 140 160 180 200 220 Control Flow Paths Median: middle-ranked item in the data set Upper Quartile: median of the values that are more than Median Lower Quartile: median of the values that are less than Median Box Length = Upper Quartile - Lower Quartile Upper Tail=Upper Quartile + 1.5 Box Length Lower Tail=Lower Quartile - 1.5 Box Length Massimo Felici - Software Metrics, 1999 27
  • 28. Scatter Plot 18 16 14 Number of faults 12 10 8 6 4 2 0 0 100 200 300 400 500 600 LOC Scatter plots are used to represent data for which two measures are given for each entity. Massimo Felici - Software Metrics, 1999 28
  • 29. Control Charts • Help you to see when your data are within acceptable bounds. • By watching the data trends over time, you can decide whether to prevent problems before they occur. Massimo Felici - Software Metrics, 1999 29
  • 30. Bar Graphs Massimo Felici - Software Metrics, 1999 30
  • 31. Measuring Internal Product Attributes: Size length functionality complexity Massimo Felici - Software Metrics, 1999 31
  • 32. Measuring Internal Product Attributes: Size The combination of different measures of the same attribute can give additional information height_A height_B weight_A weight_B Massimo Felici - Software Metrics, 1999 32
  • 33. Measuring Length: Line Of Code (LOC) • Definition of Line Of Code • Programming language • Non-textual or external code • Specifications and designs • Predicting length • Reuse of code Massimo Felici - Software Metrics, 1999 33
  • 34. Measuring Size: Functionality • Function points (external inputs, external outputs, external inquiries, external files, internal files) • COCOMO 2.0 approach • DeMarco’s approach Massimo Felici - Software Metrics, 1999 34
  • 35. Measuring Size: Complexity • Problem with indirect measures (e.g., elapsed time) • Complexity of a problem (e.g., algorithm complexity) Massimo Felici - Software Metrics, 1999 35
  • 36. Measuring Internal Product Attributes: Structure • The control flow addresses the sequence in which instructions are executed in a program. • Data flow follows the trail of data item as it is created or handled by a program. • Data structure if the organisation of data itself, independent of the program. Massimo Felici - Software Metrics, 1999 36
  • 37. Flowgraph Model of Structure A flowgraph is a directed graph in which two nodes, the start node and the stop node, obey special properties. The stop node has not leaving arcs, and every node lies on some path from the start node to the stop node. Massimo Felici - Software Metrics, 1999 37
  • 38. Common Flowgraphs from Program Structure Models X1 X2 X3 Xn-1 Xn X1; X2; X3; …; Xn-1; Xn; A if A then X A if A then X t t f else Y X f X Y A case A of A while A do X X a1 a2 an a1: X1 a2: X2 f f X1 X2 ··· Xn … t t an: Xn X repeat X until A A Massimo Felici - Software Metrics, 1999 38
  • 39. Sequencing and Nesting • Let F1 and F2 be two flowgraphs. Then the sequence of F1 and F2 is the flowgraph formed by merging the stop node of F1 with the start node of F2. • Let F1 and F2 be two flowgraphs. Suppose F1 has a procedure node x. Then the nesting of F2 onto F1 at x is the flowgraph formed from F1 by replacing the arc from x with the whole of F2 . Massimo Felici - Software Metrics, 1999 39
  • 40. Prime Flowgraphs Prime flowgraphs are flowgraphs that cannot be decomposed non- trivially by sequencing and nesting. Massimo Felici - Software Metrics, 1999 40
  • 41. The Generalised Notion of Structuredness Let S be a family of prime flowgraphs. A family of graphs is S-structured (or, more simply, that the members are S-graphs) if it satisfies the following recursive rules: • Each member of S is S-structured. • If F and F’ are S-structured graphs, then so are - the sequence of F and F’ - the nesting of F’ on to F (whenever nesting of F’ onto F is defined). • No flowgraph is an S-structured graph unless it can be shown to be generated by a finite number of applications of the above step. Massimo Felici - Software Metrics, 1999 41
  • 42. Prime Decomposition Prime decomposition theorem: Every flowgraph has a unique decomposition into a hierarchy of primes. (Fenton and Whitty, 1986) Massimo Felici - Software Metrics, 1999 42
  • 43. Example of Hierarchical Measures Number of nodes measure n M1 : n ( F ) number of node in F for each prime F k M 2 : n F1 ;; Fk n Fi k 1 i 1 k M 3 : n F F1 ; Fk nF n Fi 2k for each prime F i 1 Massimo Felici - Software Metrics, 1999 43
  • 44. Hierarchical Measures Number of edges measure e M1 : e F number of edges in F for each prime F k M 2 : e F1 ;; Fk n Fi i 1 k M 3 : e F F1 ;; Fk eF e Fi k for each prime F i 1 Massimo Felici - Software Metrics, 1999 44
  • 45. Another Measure of Complexity McCabe’s cyclomatic complexity measure vF e n 2 Massimo Felici - Software Metrics, 1999 45
  • 46. Test Strategies • Black-box (or closed-box) testing, in which the test cases are derived from the specification or requirements without reference to the code itself or its structure. • White-box (or open-box) testing, in which the test cases are selected based on knowledge of the internal program structure. Massimo Felici - Software Metrics, 1999 46
  • 47. Test Coverage Strategies Statement coverage, in which every program statement is executed al least once. Branch (or edge) coverage, in which every edge lies on at least one path of the test cases. Path coverage, in which every possible program path is executed at least once. Massimo Felici - Software Metrics, 1999 47
  • 48. Test Measures Let T be a testing strategies that requires us to cover a class of objects (e.g., paths, simple paths, linearly independent paths, edges, statements, etc.). Two of the most important test measures are Minimum number of test cases = minimal number of paths required to exercise all the objects T at least once. Test Effectiveness Ratio (TER) number of T objects exercised at least once TER total number of T objects Massimo Felici - Software Metrics, 1999 48
  • 49. Modularity and Information Flow Attributes “A module is a contiguous sequence of program statements, bounded by boundary elements, having an aggregate identifier.” (Yourdon and Constantine, 1979) Massimo Felici - Software Metrics, 1999 49
  • 50. Module Call-Graph Main scores scores Read_Scores Average scores average average Calc_Av Print_Av Massimo Felici - Software Metrics, 1999 50
  • 51. Coupling “Coupling is the degree of interdependence between modules.” (Yourdon and Constantine, 1979) Massimo Felici - Software Metrics, 1999 51
  • 52. An Ordinal Classification for Coupling No coupling relation R0: x and y have no communication. Data coupling relation R1: x and y communicate by parameters. Stamp coupling relation R2: x and y accept the same record type as a parameter. Control coupling relation R3: x passes a parameter to y with the intention of controlling its behaviour (e.g., flag). Common coupling relation R4: x and y refer to the same global data. Content coupling relation R5: x refers to the inside of y. Massimo Felici - Software Metrics, 1999 52
  • 53. A Measure of Coupling n c x, y i n 1 i worst coupling relation Ri between x and y n number of interconne ctions between x and y (Fenton and Melton, 1990) Massimo Felici - Software Metrics, 1999 53
  • 54. Cohesion “The cohesion of a module is the extent to which its individual components are needed to perform the same task.” Massimo Felici - Software Metrics, 1999 54
  • 55. An Ordinal Scale for Cohesion Functional: the module performs a single well-defined function. Sequential: the module performs more than one function, but they occur in an order prescribed by the specification. Communicational: the module performs multiple functions, but all on the same body of data. Procedural: the module performs more than one function, and they are related only to a general procedure affected by the software. Temporal: the module performs more than one function, and they are related only by the fact that they must occur within the same timespan. Logical: the module performs more than one function, and they are related only logically. Coincidental: the module performs more than one function, and they are unrelated. Massimo Felici - Software Metrics, 1999 55
  • 56. A Simple Measure of Cohesion number of modules having functional cohesion Cohesion ratio total number of modules Massimo Felici - Software Metrics, 1999 56
  • 57. Information Flow Local direct flow exists if either a module invokes a second module and passes information to it or the invoked module returns a result to the caller. Local indirect flow exists if the invoked module returns information that is subsequently passed to a second invoked module. Global flow exists if information flows from one module to another via a global data structure. Massimo Felici - Software Metrics, 1999 57
  • 58. Measures of Information Flow fan-in(M) is the number of local flows that terminate at M, plus the number of data structures from which information is retrieved by M. fan-out(M) is the number of local flows that emanate from M, plus the number of data structures that are updated by M. Information flow complexity(M)=length(M)*(fan-in(M)*fan-out(M))2, Henry and Kafura Shepperd complexity(M)=(fan-in(M)*fan-out(M))2, Shepperd Massimo Felici - Software Metrics, 1999 58
  • 59. Object-Oriented Metrics Metric 1: weighted methods per class (WMC) Metric 2: depth of inheritance tree (DIT) Metric 3: number of children (NOC) Metric 4: coupling between object classes (CBO) Metric 5: response for class (RFC) Metric 6: lack of cohesion metric (LCOM) Massimo Felici - Software Metrics, 1999 59
  • 60. Data Structure Metrics There have been few attempts to define measures of actual data items and their structure. Two examples: Number of distinct operand = number of variables + number of unique constants + number of labels Database size in bytes or characteres D/P Program size in delivered source instructio n (DSI) (Boehm) Massimo Felici - Software Metrics, 1999 60
  • 61. Measuring External Product Attributes • What is quality for the final product? • What is quality for the end user? • How can external quality be measured? • What is the relation between external and internal attributes? • Is quality a general concept? Massimo Felici - Software Metrics, 1999 61
  • 62. Modeling Software Quality: ISO 9126 Suitability Functionality, a set of attributes that bear on the existence of Functionality Accuracy a set of functions and their specified properties. The Interoperability functions are those that satisfy stated or implied needs. Security Reliability Maturity Reliability, a set of attributes that bear on the capability of Fault tolerance software to maintain its level of performance under stated Recoverability conditions for a stated period of time. Understandability Usability Learnability Usability, a set of attributes that bear on the effort needed Operability for use, and on the individual assessment of such use, by a Efficiency Time behaviour stated or implied set of users. Resouce behaviour Analysability Efficiency, a set of attributes that bear on the relationship Maintainability Changeability between the level of performance of the software and the Stability amount of resources used, under stated conditions. Testability Adaptability Maintainability, a set of attributes that bear on the effort Portability Installability needed to make specified modifications. Portability, a set of attributes that bear on the ability of Conformance Replaceability software to be transferred from one environment to another. Massimo Felici - Software Metrics, 1999 62
  • 63. Measuring Aspects of Quality Defects-based quality measures Usability measures Maintainability measures Massimo Felici - Software Metrics, 1999 63
  • 64. Defect Density Measure number of known defects defect density product size Massimo Felici - Software Metrics, 1999 64
  • 65. Defect Density Warnings • definition of defect • distinction between defect density and defect rate • definition of software size • interpretation of defect density measures (defect finding) • no faults free • seriousness of faults • variability of users Massimo Felici - Software Metrics, 1999 65
  • 66. Usability Measures • difficult to define usability • internal measures of usability • the external view of usability is environment dependent Massimo Felici - Software Metrics, 1999 66
  • 67. Maintainability Measures • corrective maintainability • adaptive maintainability • preventive maintainability • perfective maintainability Massimo Felici - Software Metrics, 1999 67
  • 68. External View of Maintainability Mean Time To Repair (MTTR) • problem recognition time • administrative delay time • maintenance tools collection time • problem analysis time • change specification time • changing time (including testing and review) Massimo Felici - Software Metrics, 1999 68
  • 69. Other Environmental-Dependent Maintainability Measures • ratio of total change implementation time to total number of changes implemented • number of unresolved problems • time spent on unresolved problems • percentage of changes that introduce new faults • number of modules modified to implement a change Massimo Felici - Software Metrics, 1999 69
  • 70. Software Reliability Measurement and Prediction • What is software reliability? • Software reliability vs. hardware reliability Massimo Felici - Software Metrics, 1999 70
  • 71. The Basic Problem of Reliability Theory • The basic problem of reliability theory is to predict when a system will eventually fail. • Hardware reliability concerns normally with component failures due to physical wear (e.g., corrosion, shock, over-heating, etc.). • Such failures are probabilistic in nature, that is, we usually do not know exactly when something will fail, but we know that the product eventually will fail, so we can assign a probability that the product will fail at a particular point in time. Massimo Felici - Software Metrics, 1999 71
  • 72. Basic Reliability Theory Probability density function f t t Distribution function Ft f t dt 0 Reliability function Rt 1 Ft Massimo Felici - Software Metrics, 1999 72
  • 73. Basic Reliability Theory Mean Time To Failure (MTTF) ET t f t dt Mean Time To Recover (MTTR) Mean Time Between Failure (MTBF) MTBF = MTTF + MTTR Massimo Felici - Software Metrics, 1999 73
  • 74. The Software Reliability Problem Software Reliability vs. Hardware Reliability • There are many reasons for software to fail, but none involves wear and tear. • Usually, software fails because of a design problem. • Other failures occur when the code is written, or when changes (e.g., changed requirements, revised design, corrections of existing problems, etc.) are introduced to a working system. • Ideally, we want our changes implemented without introducing new faults, so that by fixing a known problem we increase the overall reliability of the system. Massimo Felici - Software Metrics, 1999 74
  • 75. The Software Reliability Problem Software Reliability vs. Hardware Reliability • When hardware fails, the problem is fixed by replacing the failed component with a new or repaired one, so that the system is restored to its previous reliability. Rather than growing, the reliability is simply maintained. • The key distinction between software reliability and hardware reliability is the difference between intellectual failure (usually due to design faults) and physical failure. • Although hardware reliability can also suffer from design faults, the extensive theory of hardware reliability does not deal with them. Massimo Felici - Software Metrics, 1999 75
  • 76. Parametric Reliability Growth Model • Geometric • Jelinski-Moranda • Littlewood-Verrall • Musa basic Massimo Felici - Software Metrics, 1999 76
  • 77. Failure Data for Reliability Modeling (Musa) Massimo Felici - Software Metrics, 1999 77
  • 78. Comparison of Several Reliability Models Massimo Felici - Software Metrics, 1999 78
  • 79. Choosing the Best Model • Uncertainty about the operational environment • Uncertainty about the effect of fault removal • The behaviour of models depends greatly on the data to witch they are applied. In fact, the accuracy of models also varies from one data set to another. Sometimes no parametric prediction system can produce reasonably accurate results. Massimo Felici - Software Metrics, 1999 79
  • 80. Resource Measurement Productivity Teams Tools Massimo Felici - Software Metrics, 1999 80
  • 81. Standards and Approaches • ISO 9126 • IEEE 912 • Capability Maturity Model (CMM) Software Engineering Institute (SEI) • SPICE European Software Institute (ESI) • Goal Question Metric (GQM) Victor Basili • SQUID Massimo Felici - Software Metrics, 1999 81
  • 82. Goal Question Metric (GQM) The Goal Question Metric approach provides a framework involving three main steps: 1. List the major goals of the development or maintenance project. 2. Derive from each goal the questions that must be answered to determine if the goals are being met. 3 Decide what must be measured in order to be able to answer the questions adequately. Massimo Felici - Software Metrics, 1999 82
  • 83. Capability Maturity Model (CMM) Level 5: Optimizing Level 4: Managed Level 3: Define Level 2: Level 1: Initial Repeatable No attempt to standardise process Level 1: Level 2: Repeatable Initial Disciplined process Level 3: Defined Standard, consistent process Level 4: Managed Predictable process Level 5: Optimising Continuously improving process Massimo Felici - Software Metrics, 1999 83
  • 84. References Fenton, N.E., Pfleeger, S.L.: Software Metrics: A Rigorous & Practical Approach, Second Edition. International Thomson Computer Press, 1996. ISO/IEC 9126, Information technology - Software quality characteristics and metrics. IEEE Std 982.1-1988, IEEE Standard Dictionary of Measures to Produce Reliable Software. IEEE, 1988. IEEE Std 982.2-1988, IEEE Guide for the Use of IEEE Standard Dictionary of Measures to Produce Reliable Software. IEEE, 1988. Lyu, M. (Ed.): Handbook of Software Reliability Engineering, IEEE Computer Society Press, 1996. Musa, J., Iannino, A., Okomuto, K.: Software Reliability: Measurement, Prediction and Application. McGraw-Hill, New York, 1987. Salamon, W.J., Wallace, D.R.: NISTIR 5459, Quality Characteristics and Metrics for Reusable Software. Massimo Felici - Software Metrics, 1999 84
  • 85. Part II Introduction to SQUID Massimo Felici - Software Metrics, 1999 85
  • 86. Massimo Felici - Software Metrics, 1999 86
  • 87. Software QUality In the Development Process The SQUID Project P8436 has been funded by the European Commission within the ESPRIT Programme SQUID Partners: Keele University (UK), DELTA (DK), ENEA (IT), Engineering Ingegneria Informatica S.p.A. (IT), TÜV-Nord (DE) Massimo Felici - Software Metrics, 1999 87
  • 88. SQUID Approach • Provides support for product quality specification, control and evaluation • Measurement-based • Two types of measure – Internal measures relating to software and its development process – External measures relating to operational behaviour and the support process • Problem – Software engineering research can not show a functional relationship between internal measures and external measures • SQUID View – Controlling internal quality is likely to improve product quality – Collecting and analysing data will confirm whether any relationships exist in your own organisation Massimo Felici - Software Metrics, 1999 88
  • 89. Four Steps to Quality • Specify product quality requirements objectively: – Target values of measurable properties • Assess feasibility of quality requirements before starting – Address feasibility problems as necessary • Monitor progress towards achieving quality requirements – Set Targets for measures arising during product development – Monitor and control these measures • Evaluate final product quality by comparing target values with actuals Massimo Felici - Software Metrics, 1999 89
  • 90. SQUID Approach • SQUID approach requires – Integration of different types of measure (internal & external) – Integration of different models (quality models & development models) • Problem – There are many different quality models • Different quality models lead to different external measures – Different organisations will have use different development models • Different development methods lead to different internal measures • SQUID toolset supports configuration – Definition of organisation specific models and measures – Analysis methods independent of specific models and measures Massimo Felici - Software Metrics, 1999 90
  • 91. SQUID Approach • SQUID support various processes needed to manage quality – Quality Specification – Quality Planning – Quality Monitoring – Quality Evaluation • Basis of SQUID toolset functions Massimo Felici - Software Metrics, 1999 91
  • 92. SQUID Quality Process USER QUALITY USER NEEDS IN USE LAYER QUALITY QUALITY EXTERNAL SPECIFICATION EVALUATION LAYER QUALITY QUALITY INTERNAL PLANNING CONTROL LAYER Massimo Felici - Software Metrics, 1999 92
  • 93. Quality Specification User or organisational product requirements: – Mapped to appropriate elements of a quality model – Converted to required values of measurable operational properties – Checked for feasibility Massimo Felici - Software Metrics, 1999 93
  • 94. Modeling the Development Process Development model Project Object comprises belongs to Project Object type Deliverable type Development Review point type Activity type Massimo Felici - Software Metrics, 1999 94
  • 95. Creating a Quality Model Quality requirement leads_to specification Product behavioural requirement addresses belongs_to Quality Characteristic Quality Model refine influences Internal Quality External Quality Characteristic Characteristic indicates quantified_by quantified_by Internal attribute External Attribute Massimo Felici - Software Metrics, 1999 95
  • 96. The SQUID View of Measurement quantifies Unit Attribute using exhibits measures Value Project Object in_accordance_with Counting Rule Massimo Felici - Software Metrics, 1999 96
  • 97. Quality Planning • After quality specification agreed • Development process must be defined – Assumed to be one of several company standard methods • Set targets for internal measures – SQUID assumes that controlling internal measures will deliver required quality – To monitor progress internal measures should be associated with different development activities and intermediate deliverables – Target values can be based on past performance: • What internal values where observed on project that achieved similar requirements Massimo Felici - Software Metrics, 1999 97
  • 98. Quality Monitoring • Compares actual values with target values during software production – To assess current status • Compares estimates of future quality measures with target values – To re-assess feasibility • Identifies “anomalies” – Unusual components (modules, documents, programs) – Possible problem components Massimo Felici - Software Metrics, 1999 98
  • 99. The SQUID Toolset Architecture Conf iguration Quality Evaluation Quality Specif ication SQUID Database Quality Planning Quality Monitoring Data Collation Massimo Felici - Software Metrics, 1999 99
  • 100. Part III Case Studies Massimo Felici - Software Metrics, 1999 100
  • 101. Case Studies • A railways traffic control system for the Italian National Railways • Antarctica TELESCIENCE Project Massimo Felici - Software Metrics, 1999 101
  • 102. A Railways Traffic Control System Project Summary Customer: Italian National Railways (FS) Project Type: Research, Prototyping Target: Developing a new Control System System Aims: Controlling Train Traffic in real-time No Safety Design Approach: User Centred Design Railways Traffic Control Massimo Felici - Software Metrics, 1999 102 System
  • 103. User Centred Design Approach General Properties • Based on user activity • Iterative design process • User participation • Prototypes based on scenarios frequent modification • Instruments used for designing, analysing and evaluating video/record taping questionnaires interviews Railways Traffic Control Massimo Felici - Software Metrics, 1999 103 System
  • 104. Phases of the Design Process Task analysis p r Task allocation o t o System design t y p i Job design n g Evaluation Railways Traffic Control Massimo Felici - Software Metrics, 1999 104 System
  • 105. Schema of the Control System Real System Man Machine System Monitor Operator Interface Decision Support System Railways Traffic Control Massimo Felici - Software Metrics, 1999 105 System
  • 106. Quality Model Quality Model Reliability Usability Functionality Efficiency Maintainability characteristic layer subcharacteristic layers attribute layer (internal/external) Railways Traffic Control Massimo Felici - Software Metrics, 1999 106 System
  • 107. Quality Requirements Each system component: - performs different tasks - has different quality requirements Component Quality Quality Subcharacteristic Requirement Characteristic Level System Monitor Reliability Very High Functionality Function completeness High Function correctness High Efficiency Medium Maintainability Corrective Maintainability High Adaptive Maintainability Very High Railways Traffic Control Massimo Felici - Software Metrics, 1999 107 System
  • 108. Quantitative Targets Quantitative targets to monitor progress of components System Quality Quality Quality Attribute Target Component Characteristic Subcharacteristic Subsubcharacteristic System Reliability Estimated Mean time 1*10E3 hours Monitor Reliability between failures Correctness Module fault 10 faults per density module Test Accuracy Test Coverage Function = 100 % coverage Branch coverage 70% . . . . . . . . . . . . . . . . . . Railways Traffic Control Massimo Felici - Software Metrics, 1999 108 System
  • 109. Selection Criteria for Metrics • Objective • Observable • Repeatable • Predictive • Easy to collect • Valid across further projects • User Centred Design aspects (new methods and tools that should be exploited by metrics) Railways Traffic Control Massimo Felici - Software Metrics, 1999 109 System
  • 110. Critical Issues • Frequent modifications • Iterative design process • User Centred Design aspects Railways Traffic Control Massimo Felici - Software Metrics, 1999 110 System
  • 111. Data Collection Activity • Use of the SQUID tool • Tools in order to automate the data collection activity • Reports Railways Traffic Control Massimo Felici - Software Metrics, 1999 111 System
  • 112. Conclusion • Software Quality in User Centred Design • Interpretation of metrics within a specific context • Critical issues frequent modifications iterative design process User Centred Design aspects • Definition of new (user centred design) metrics Railways Traffic Control Massimo Felici - Software Metrics, 1999 112 System
  • 113. Antarctica Telescience Project • The Telescience Project was launched end 1993 in the framework of the Italian National Antarctic Research Programme. • The aim is the development of an Advanced Supervision and Telecontrol System to remotely perform experimental activities in Antarctica during the austral winter. Antarctica Telescience Massimo Felici - Software Metrics, 1999 113 Project
  • 114. Project Description Development responsibility: ENEA, Division INN RIN INFAV Estimated number of modules: 40 Estimated code size: 19.000 LOC Expected man power required: 7 staff year Personnel assigned to the project staff: 8 Experience of the staff with CASE tools: Good Experience of the staff with quality measurement tools: None Use of quality control tools (other than SQUID): None Programming language: C Antarctica Telescience Massimo Felici - Software Metrics, 1999 114 Project
  • 115. Antarctica Telescience Project Main Systems • A set of Remote Laboratories in Antarctica • A Supervision and Telecontrol Room in Antarctica • An Electric Power Supply & Distribution System in Antarctica • A Telecommunication System in Antarctica • A Remote Man-Machine Interface System in Italy Antarctica Telescience Massimo Felici - Software Metrics, 1999 115 Project
  • 116. Architecture of the Advanced Supervision and Telecontrol System Remote Remote Remote Remote lab. N° 1 lab. N° 2 lab. N° 3 lab. N° n Supervision and Telecontrol Room Telecommunication System Electric Power Supply & Distribution System Antarctica Remote Man-Machine Italy Interface System Antarctica Telescience Massimo Felici - Software Metrics, 1999 116 Project
  • 117. The Electric Power Supply and Distribution System • The Electric Power Supply & Distribution System (EPSDS) ensures that electricity produced by the on-site diesel generators is available to the equipment. • The experimental activities is intended to run unmanned for 8 months in Antarctica and the EPSDS must guarantee the power supply for such period without interruptions. • The EPSDS has stringent requirements. • The real-time control software is duplicated. • If the software fails catastrophically in both versions of the Electric Power Supply Subsystem, a back-up battery power can run for one hour. Antarctica Telescience Massimo Felici - Software Metrics, 1999 117 Project
  • 118. The Remote Man-Machine Interface System • The MMI allows to perform scientific activities as well as to control and monitor the Antarctica base. • There are two types of users operators and scientists. • The Remote MMI system is based on 7 main subsystems: 1. Data acquisition 2. Information Presentation 3. Command sending 4. Simulation 5. Operator training 7. Data elaboration Antarctica Telescience Massimo Felici - Software Metrics, 1999 118 Project
  • 119. Product Portion Subproject Product Portion Components Electric Power Supply PP1 Electric Power Supply subsystem Distribution system PP2 Electric Power Distribution subsystem Remote MMI system 1 PP3 Information presentation subsystem Command sending subsystem Simulation subsystem Remote MMI system 2 PP4 Mission planning support subsystem Operator training subsystem Data elaboration subsystem Data acquisition subsystem Antarctica Telescience Massimo Felici - Software Metrics, 1999 119 Project