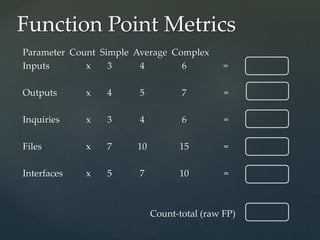
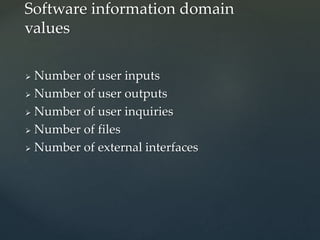
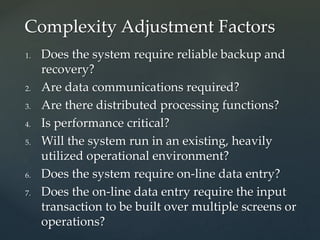
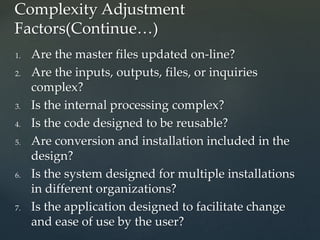
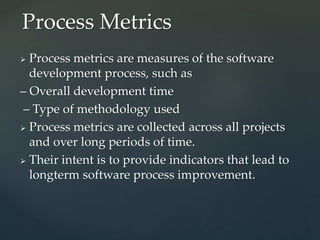
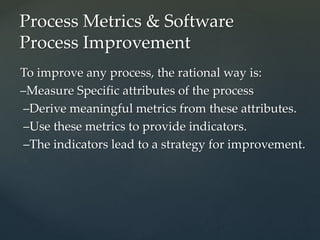
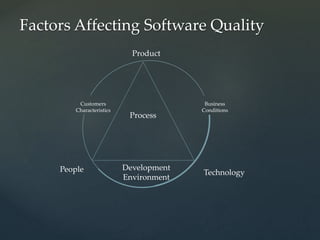
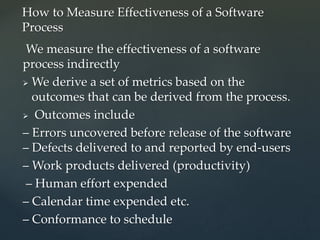
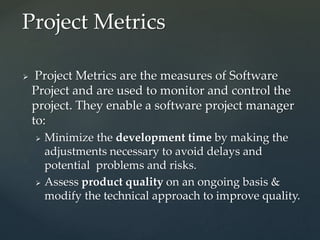
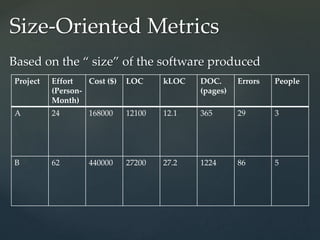
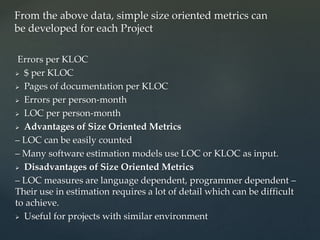
{
Software Metrics
Presented by: Mirza Talal Baig
Mudassir Tufail
 Measure - Quantitative indication of the extent,
amount, dimension, capacity or size of some
attribute of a product or process
 Measurement - The act of determining a
measure
 Metric - A quantitative measure of the degree to
which a system, component, or process possesses
a given attribute (IEEE Standard Glossary of
Software Engineering Terms)
 Indicator – An indicator is a metric or
combination of metrics that provide insight into
the software process, a software project or the
product itself.
Definitions
1. Process Metrics
2. Product Metrics
3. Project Metrics
Types of Metrics
 Process metrics are measures of the software
development process, such as
– Overall development time
– Type of methodology used
 Process metrics are collected across all projects
and over long periods of time.
 Their intent is to provide indicators that lead to
longterm software process improvement.
Process Metrics
To improve any process, the rational way is:
–Measure Specific attributes of the process
–Derive meaningful metrics from these attributes.
–Use these metrics to provide indicators.
–The indicators lead to a strategy for improvement.
Process Metrics & Software
Process Improvement
Factors Affecting Software Quality
Business
Conditions
Customers
Characteristics
Process
TechnologyPeople
Product
Development
Environment
We measure the effectiveness of a software
process indirectly
 We derive a set of metrics based on the
outcomes that can be derived from the process.
 Outcomes include
– Errors uncovered before release of the software
– Defects delivered to and reported by end-users
– Work products delivered (productivity)
– Human effort expended
– Calendar time expended etc.
– Conformance to schedule
How to Measure Effectiveness of a Software
Process
 Project Metrics are the measures of Software
Project and are used to monitor and control the
project. They enable a software project manager
to:
 Minimize the development time by making the
adjustments necessary to avoid delays and
potential problems and risks.
 Assess product quality on an ongoing basis &
modify the technical approach to improve quality.
Project Metrics
 Used in estimation techniques & other technical
work.
 Metrics collected from past projects are used as
a basis from which effort and time estimates are
made for current software project.
 As a project proceeds, actual values of human
effort & calendar time expended are compared
to the original estimates.
 This data is used by the project manager to
monitor & control the project.
Project Metrics
 Product metrics are measures of the software
product at any stage of its development, from
requirements to installed system. Product
metrics may measure:
– the complexity of the software design
– the size of the final program
– the number of pages of documentation
produced
Product metrics
 Direct measures
– Easy to collect
– E.g. Cost, Effort, Lines of codes (LOC),
Execution Speed, Memory size, Defects etc.
• Indirect measures
– More difficult to assess & can be measured
indirectly only.
– Quality, Functionality, Complexity, Reliability,
Efficiency, Maintainability etc.
Types of Software Measurements
An Example
 2 different project
teams are working to
record errors in a
software process
 Team A – Finds 342
errors during software
process before release
 Team B- Finds 184
errors
Which team do
you think is
more effective
in finding
errors?
 To answer this we need to know the size &
complexity of the projects.
 But if we normalize the measures, it is possible
to compare the two
 For normalization we have 2 ways
–Function Oriented Metrics
–Size-Oriented Metrics
Normalization of Metrics
Size-Oriented Metrics
Based on the “ size” of the software produced
Project Effort
(Person-
Month)
Cost ($) LOC kLOC DOC.
(pages)
Errors People
A 24 168000 12100 12.1 365 29 3
B 62 440000 27200 27.2 1224 86 5
Errors per KLOC
 $ per KLOC
 Pages of documentation per KLOC
 Errors per person-month
 LOC per person-month
 Advantages of Size Oriented Metrics
– LOC can be easily counted
– Many software estimation models use LOC or KLOC as input.
 Disadvantages of Size Oriented Metrics
– LOC measures are language dependent, programmer dependent –
Their use in estimation requires a lot of detail which can be difficult
to achieve.
 Useful for projects with similar environment
From the above data, simple size oriented metrics can
be developed for each Project
 Based on “functionality” delivered by the software
 Functionality is measured indirectly using a
measure called function point.
 Function points (FP) - derived using an empirical
relationship based on countable measures of
software & assessments of software complexity
Function-Oriented Metrics
1. Count the measurement parameters.
2. Assess the complexity of the values.
3. Calculate the raw FP (see next table).
4. Rate the complexity factors to produce the
complexity adjustment value (CAV)
5. Calculate the adjusted FP as follows:
FP = raw FP x [0.65 + 0.01 x CAV]
Steps In Calculating FP
Parameter Count Simple Average Complex
Inputs x 3 4 6 =
Outputs x 4 5 7 =
Inquiries x 3 4 6 =
Files x 7 10 15 =
Interfaces x 5 7 10 =
Count-total (raw FP)
Function Point Metrics
 Number of user inputs
 Number of user outputs
 Number of user inquiries
 Number of files
 Number of external interfaces
Software information domain
values
1. Does the system require reliable backup and
recovery?
2. Are data communications required?
3. Are there distributed processing functions?
4. Is performance critical?
5. Will the system run in an existing, heavily
utilized operational environment?
6. Does the system require on-line data entry?
7. Does the on-line data entry require the input
transaction to be built over multiple screens or
operations?
Complexity Adjustment Factors
1. Are the master files updated on-line?
2. Are the inputs, outputs, files, or inquiries
complex?
3. Is the internal processing complex?
4. Is the code designed to be reusable?
5. Are conversion and installation included in the
design?
6. Is the system designed for multiple installations
in different organizations?
7. Is the application designed to facilitate change
and ease of use by the user?
Complexity Adjustment
Factors(Continue…)
 The rating for all the factors, F1 to F14, are summed
to produce the complexity adjustment value (CAV)
 CAV is then used in the calculation of the function
point (FP) of the software
Complexity Adjustment Value
 Errors per FP
 Defects per FP
 $ per FP
 Pages of documentation per FP
 FP per person month
Example of Function-Oriented Metrics
 Advantages: language independent, based on data
known early in project, good for estimation
 Disadvantages: calculation complexity, subjective
assessments, FP has no physical meaning (just a
number)
FP Characteristics
 simple, precisely definable—so that it is
 clear how the metric can be evaluated;
 objective, to the greatest extent possible;
 easily obtainable (i.e., at reasonable cost);
 valid—the metric should measure what it
 is intended to measure; and • robust—relatively
insensitive to (intuitive• ly) insignificant changes
in the process or
 product.
Qualities of a good metric
Thank you for your time

Software metrics

  • 1.
    { Software Metrics Presented by:Mirza Talal Baig Mudassir Tufail
  • 2.
     Measure -Quantitative indication of the extent, amount, dimension, capacity or size of some attribute of a product or process  Measurement - The act of determining a measure  Metric - A quantitative measure of the degree to which a system, component, or process possesses a given attribute (IEEE Standard Glossary of Software Engineering Terms)  Indicator – An indicator is a metric or combination of metrics that provide insight into the software process, a software project or the product itself. Definitions
  • 3.
    1. Process Metrics 2.Product Metrics 3. Project Metrics Types of Metrics
  • 4.
     Process metricsare measures of the software development process, such as – Overall development time – Type of methodology used  Process metrics are collected across all projects and over long periods of time.  Their intent is to provide indicators that lead to longterm software process improvement. Process Metrics
  • 5.
    To improve anyprocess, the rational way is: –Measure Specific attributes of the process –Derive meaningful metrics from these attributes. –Use these metrics to provide indicators. –The indicators lead to a strategy for improvement. Process Metrics & Software Process Improvement
  • 6.
    Factors Affecting SoftwareQuality Business Conditions Customers Characteristics Process TechnologyPeople Product Development Environment
  • 7.
    We measure theeffectiveness of a software process indirectly  We derive a set of metrics based on the outcomes that can be derived from the process.  Outcomes include – Errors uncovered before release of the software – Defects delivered to and reported by end-users – Work products delivered (productivity) – Human effort expended – Calendar time expended etc. – Conformance to schedule How to Measure Effectiveness of a Software Process
  • 8.
     Project Metricsare the measures of Software Project and are used to monitor and control the project. They enable a software project manager to:  Minimize the development time by making the adjustments necessary to avoid delays and potential problems and risks.  Assess product quality on an ongoing basis & modify the technical approach to improve quality. Project Metrics
  • 9.
     Used inestimation techniques & other technical work.  Metrics collected from past projects are used as a basis from which effort and time estimates are made for current software project.  As a project proceeds, actual values of human effort & calendar time expended are compared to the original estimates.  This data is used by the project manager to monitor & control the project. Project Metrics
  • 10.
     Product metricsare measures of the software product at any stage of its development, from requirements to installed system. Product metrics may measure: – the complexity of the software design – the size of the final program – the number of pages of documentation produced Product metrics
  • 11.
     Direct measures –Easy to collect – E.g. Cost, Effort, Lines of codes (LOC), Execution Speed, Memory size, Defects etc. • Indirect measures – More difficult to assess & can be measured indirectly only. – Quality, Functionality, Complexity, Reliability, Efficiency, Maintainability etc. Types of Software Measurements
  • 12.
    An Example  2different project teams are working to record errors in a software process  Team A – Finds 342 errors during software process before release  Team B- Finds 184 errors Which team do you think is more effective in finding errors?
  • 13.
     To answerthis we need to know the size & complexity of the projects.  But if we normalize the measures, it is possible to compare the two  For normalization we have 2 ways –Function Oriented Metrics –Size-Oriented Metrics Normalization of Metrics
  • 14.
    Size-Oriented Metrics Based onthe “ size” of the software produced Project Effort (Person- Month) Cost ($) LOC kLOC DOC. (pages) Errors People A 24 168000 12100 12.1 365 29 3 B 62 440000 27200 27.2 1224 86 5
  • 15.
    Errors per KLOC $ per KLOC  Pages of documentation per KLOC  Errors per person-month  LOC per person-month  Advantages of Size Oriented Metrics – LOC can be easily counted – Many software estimation models use LOC or KLOC as input.  Disadvantages of Size Oriented Metrics – LOC measures are language dependent, programmer dependent – Their use in estimation requires a lot of detail which can be difficult to achieve.  Useful for projects with similar environment From the above data, simple size oriented metrics can be developed for each Project
  • 16.
     Based on“functionality” delivered by the software  Functionality is measured indirectly using a measure called function point.  Function points (FP) - derived using an empirical relationship based on countable measures of software & assessments of software complexity Function-Oriented Metrics
  • 17.
    1. Count themeasurement parameters. 2. Assess the complexity of the values. 3. Calculate the raw FP (see next table). 4. Rate the complexity factors to produce the complexity adjustment value (CAV) 5. Calculate the adjusted FP as follows: FP = raw FP x [0.65 + 0.01 x CAV] Steps In Calculating FP
  • 18.
    Parameter Count SimpleAverage Complex Inputs x 3 4 6 = Outputs x 4 5 7 = Inquiries x 3 4 6 = Files x 7 10 15 = Interfaces x 5 7 10 = Count-total (raw FP) Function Point Metrics
  • 19.
     Number ofuser inputs  Number of user outputs  Number of user inquiries  Number of files  Number of external interfaces Software information domain values
  • 20.
    1. Does thesystem require reliable backup and recovery? 2. Are data communications required? 3. Are there distributed processing functions? 4. Is performance critical? 5. Will the system run in an existing, heavily utilized operational environment? 6. Does the system require on-line data entry? 7. Does the on-line data entry require the input transaction to be built over multiple screens or operations? Complexity Adjustment Factors
  • 21.
    1. Are themaster files updated on-line? 2. Are the inputs, outputs, files, or inquiries complex? 3. Is the internal processing complex? 4. Is the code designed to be reusable? 5. Are conversion and installation included in the design? 6. Is the system designed for multiple installations in different organizations? 7. Is the application designed to facilitate change and ease of use by the user? Complexity Adjustment Factors(Continue…)
  • 22.
     The ratingfor all the factors, F1 to F14, are summed to produce the complexity adjustment value (CAV)  CAV is then used in the calculation of the function point (FP) of the software Complexity Adjustment Value
  • 23.
     Errors perFP  Defects per FP  $ per FP  Pages of documentation per FP  FP per person month Example of Function-Oriented Metrics
  • 24.
     Advantages: languageindependent, based on data known early in project, good for estimation  Disadvantages: calculation complexity, subjective assessments, FP has no physical meaning (just a number) FP Characteristics
  • 25.
     simple, preciselydefinable—so that it is  clear how the metric can be evaluated;  objective, to the greatest extent possible;  easily obtainable (i.e., at reasonable cost);  valid—the metric should measure what it  is intended to measure; and • robust—relatively insensitive to (intuitive• ly) insignificant changes in the process or  product. Qualities of a good metric
  • 26.
    Thank you foryour time