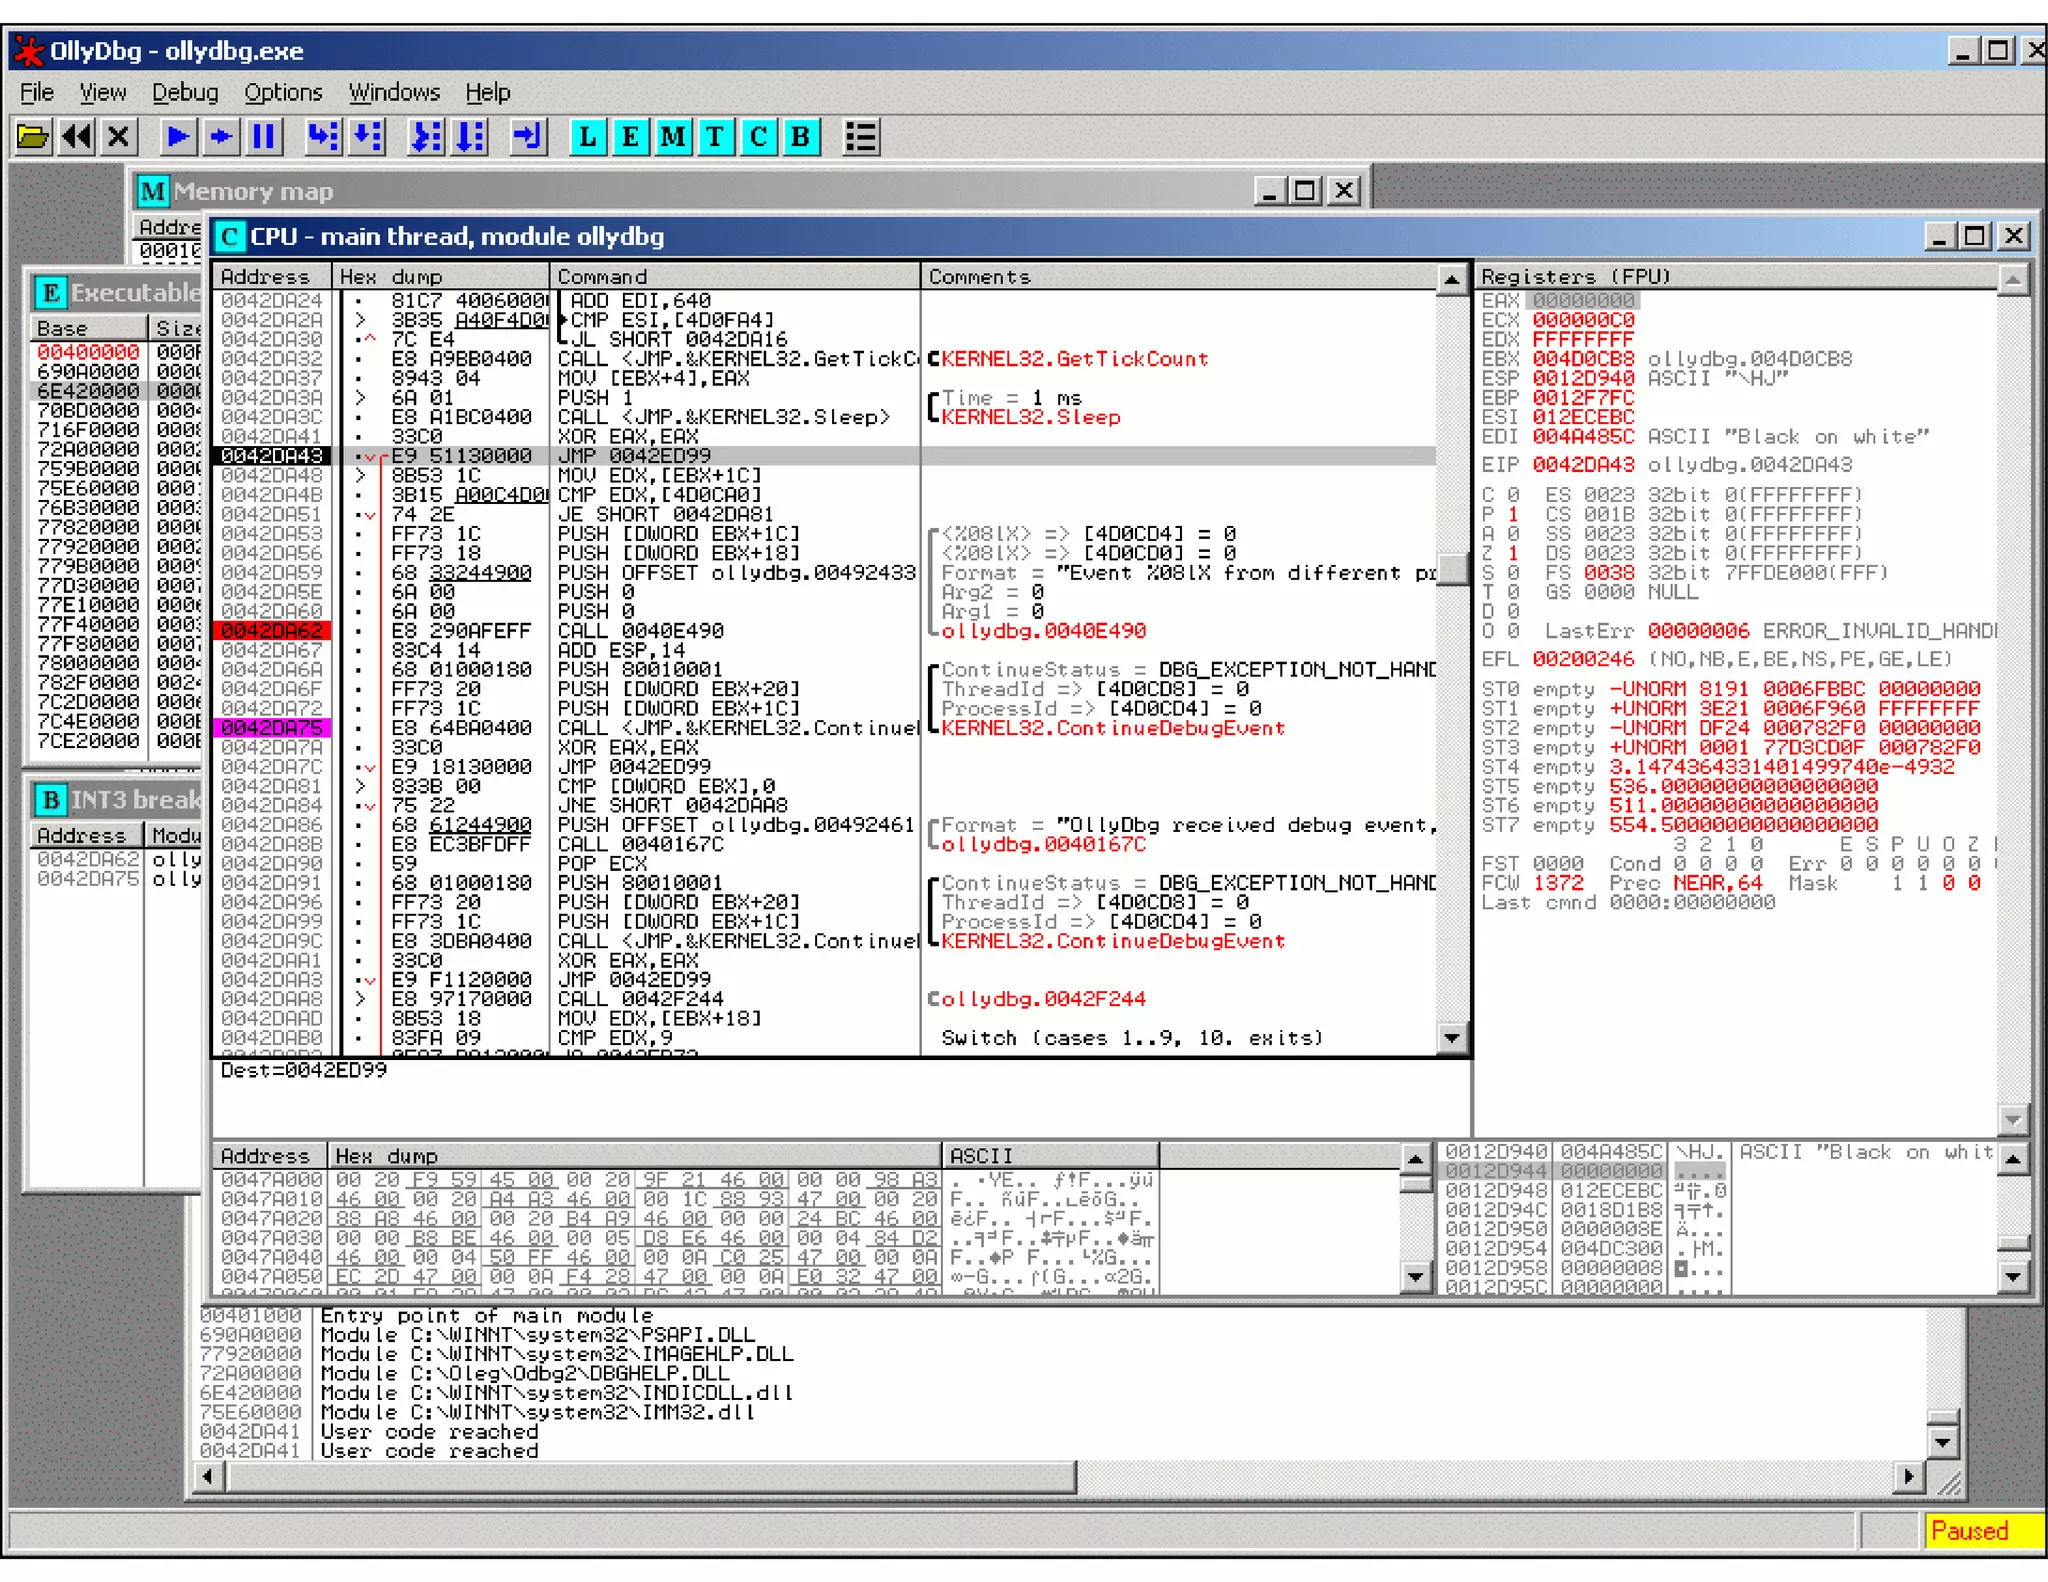
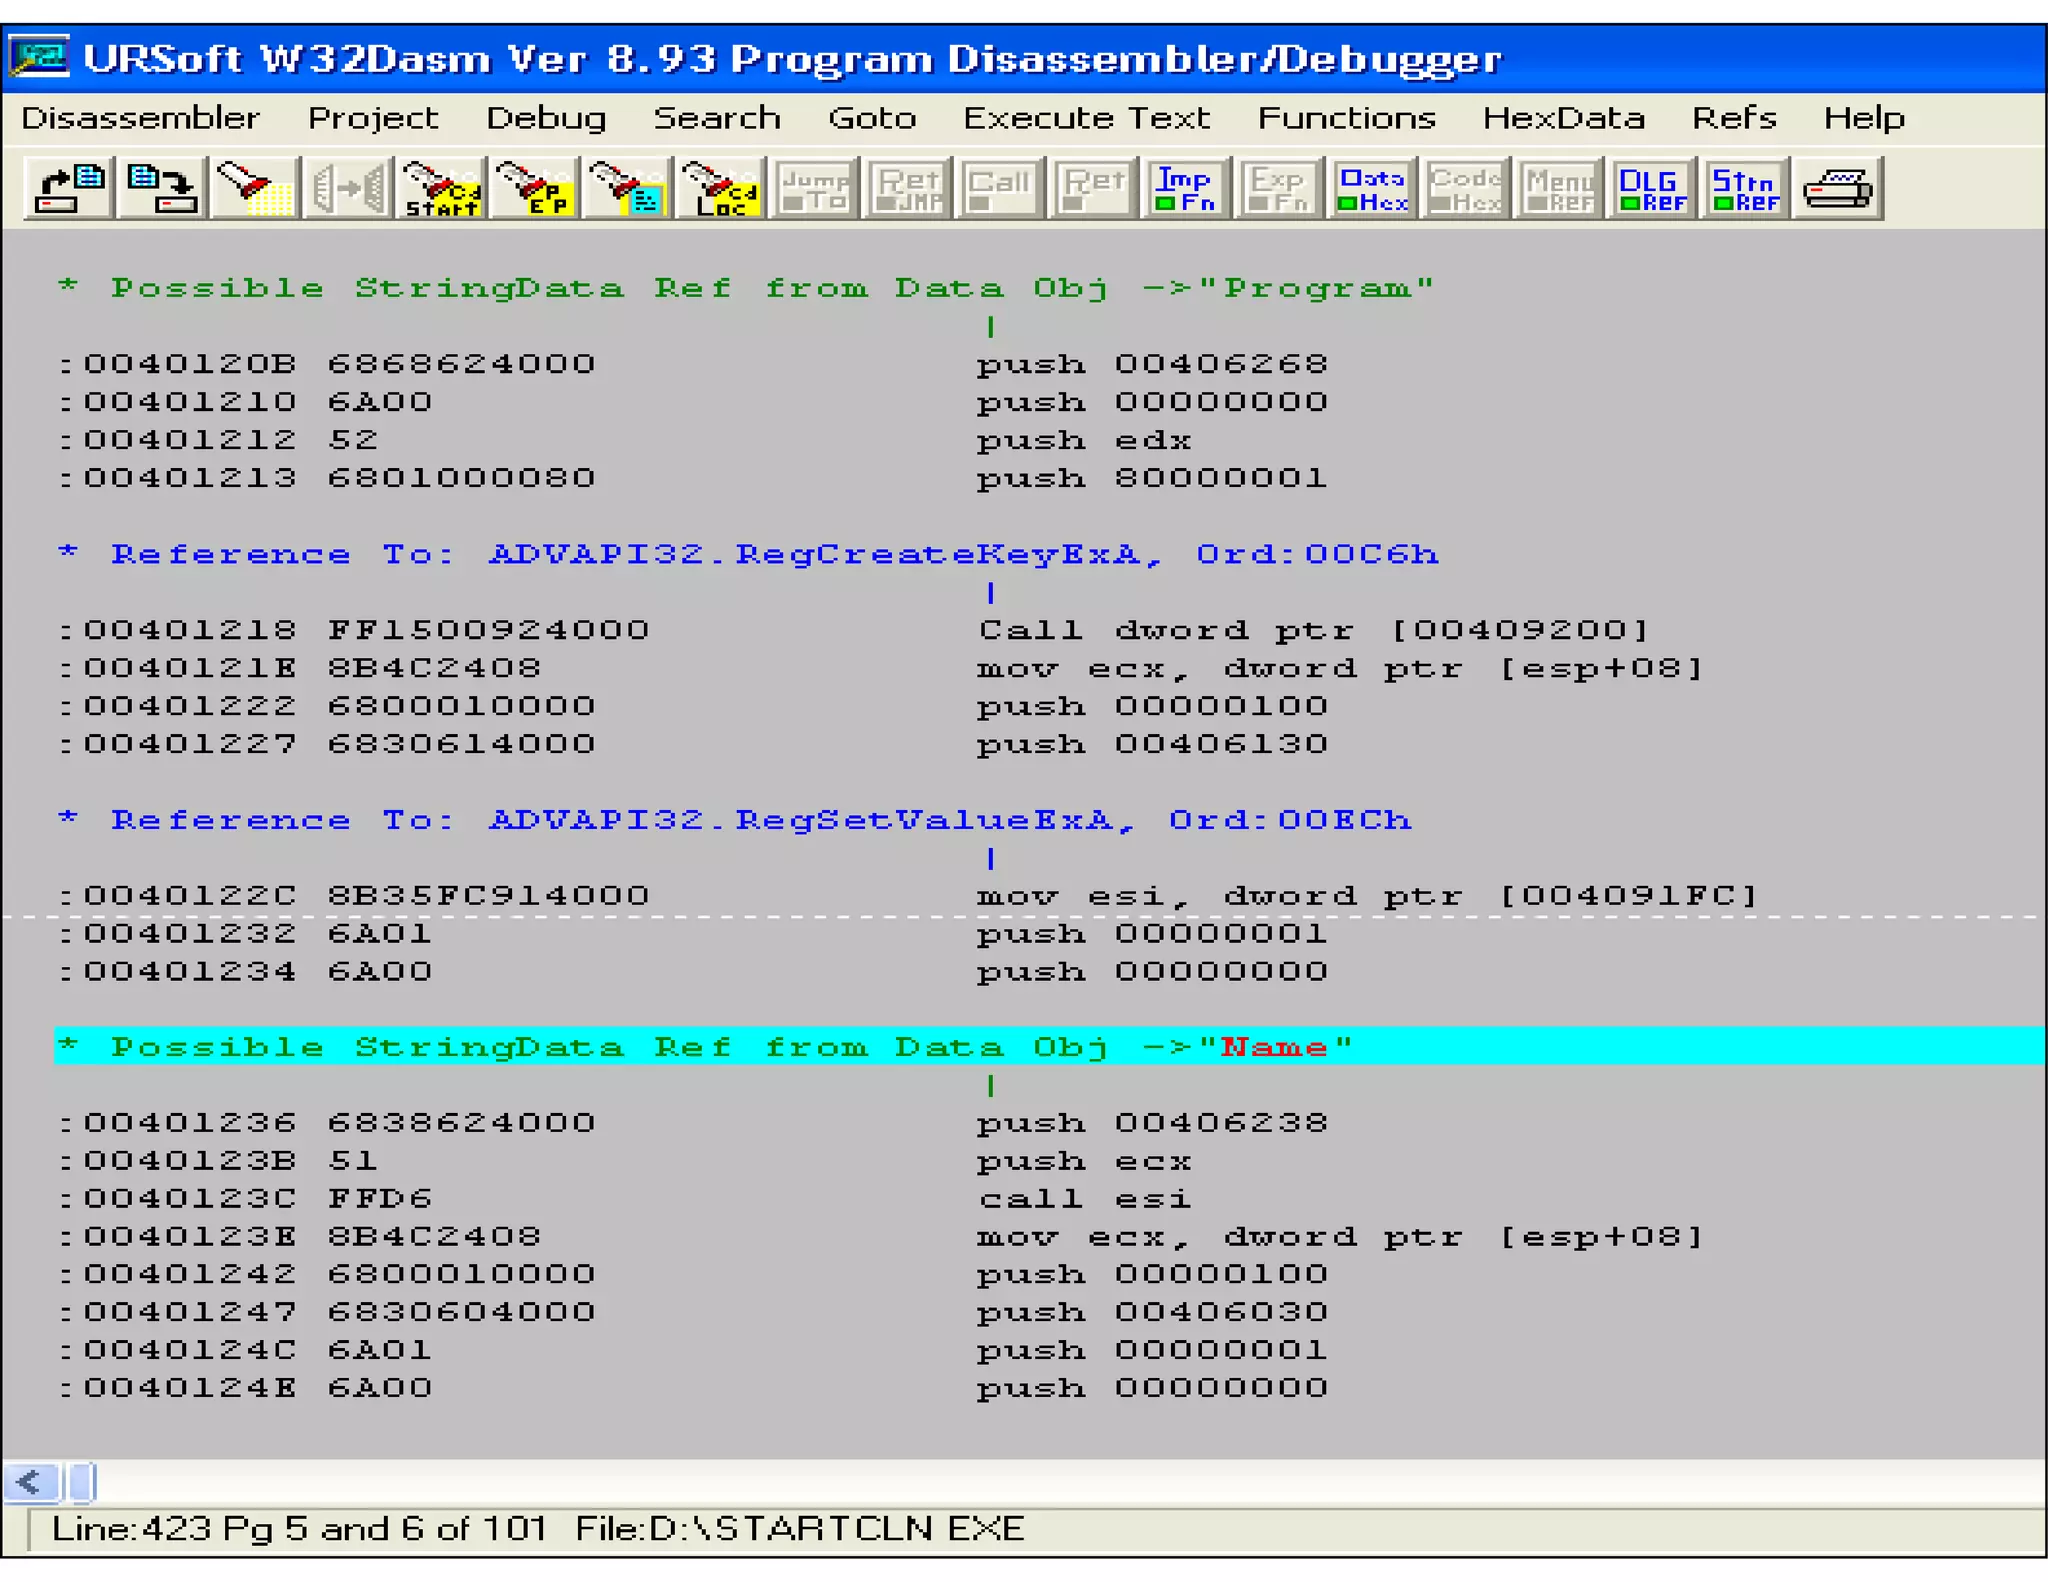
This document discusses reverse engineering software programs. It begins by defining reverse engineering as the process of understanding how a machine works by examining its behavior and structure without access to internal designs. It describes using debuggers and disassemblers to analyze a program's logical flow and machine code. The document notes that reverse engineering provides critical insights into how a program functions, which can enable changing its structure and patching code. While it can be used for good or bad ends, common techniques discussed include error tracing, input tracing, and using breakpoints to speed up the decompilation process.
Solving the Hidden Costs of Kubernetes with ObservabilityDevOps.com
Kubernetes has enabled software organizations to realize the benefits of microservices through its convenient and powerful abstractions. Deploying, scaling, and running distributed software at scale is much easier through the use of Kubernetes.
However, these benefits have not come without costs compared to traditional software operations. Spiraling monitoring expenses, the creation of single points of human failure, and a lack of understanding of service dependencies all contribute to significant hidden costs associated with running software with Kubernetes.
In this talk, we’ll discuss how observability addresses these costs and helps you quantify and understand them. You’ll learn how new open source tools such as OpenTelemetry can help you understand performance of cloud-native software, and how you can easily get started using them today. Come be a part of the future of cloud-native observability!
Distributed tracing - get a grasp on your productionnklmish
Slides from my presentation on distributed tracing, explaining what is latency and why it matters. We took a look at openzipkin and its concepts like how the core annotations works, what are tags/logs, etc. Followed by a demo application created using golang and java (spring boot , spring cloud sleuth zipkin) . You can find source code here
https://github.com/nklmish/go-distributed-tracing-demo
https://github.com/nklmish/java-distributed-tracing-demo
Everything You wanted to Know About Distributed TracingAmuhinda Hungai
In the age of microservices, understanding how applications are executing in a highly distributed environment can be complicated. Looking at log files only gives a snapshot of the whole story and looking at a single service in isolation simply does not give enough information. Each service is just one side of a bigger story. Distributed tracing has emerged as an invaluable technique that succeeds in summarizing all sides of the story into a shared timeline. Yet deploying it can be quite challenging, especially in the large scale, polyglot environments of modern companies that mix together many different technologies. During this session, we will take a look at patterns and means to implement Tracing for services. After introducing the basic concepts we will cover how the tracing model works, and how to safely use it in production to troubleshoot and diagnose issues.
In this slide, we go through the Google Dapper, OpenTracing, Jaeger to OpenTelemetry. By reading and studying the history of Dapper, we could lean the experience and design theory of a large-scale distributed tracing system and then know how it affects other solutions, like OpenTracing and Jaeger.
We also discuss the difference between the OpenTracing and Jaeger and also demonstrate how Jaeger works and looks like.
After, we talked about the future of OpenTracing, the new organization called OpenTelemetry, what's its goal and how to do that.
Juraci Paixão Kröhling - All you need to know about OpenTelemetryJuliano Costa
OpenTelemetry is one of the newest projects in the realm of Observability at the CNCF and is already the second most active project there. In this session, Juraci Paixão Kröhling will talk about the different subprojects and how to get started using them. Even if you heard about OpenTelemetry before, you'll leave this session with a better understanding of what this is all about, the several faces of OpenTelemetry, and what you can do to make your projects more observable.
Everyone wants observability into their system, but find themselves with too many vendors and tools, each with its own API, SDK, agent and collectors.
In this talk I will present OpenTelemetry, an ambitious open source project with the promise of a unified framework for collecting observability data. With OpenTelemetry you could instrument your application in a vendor-agnostic way, and then analyze the telemetry data in your backend tool of choice, whether Prometheus, Jaeger, Zipkin, or others.
I will cover the current state of the various projects of OpenTelemetry (across programming languages, exporters, receivers, protocols), some of which not even GA yet, and provide useful guidance on how to get started with it.
This discussion focuses on the observability of WSO2 products, the tools for observability, and how WSO2 will make its next generation products observable by default using well-known standards like OpenTracing specification.
Microservices architecture involves many services that are being distributed over the network resulting in many more ways of failure. This session will try to cover the available tools that can help you when designing/building such distributed system in Go
The monolith to cloud-native, microservices evolution has driven a shift from monitoring to observability. OpenTelemetry, a merger of the OpenTracing and OpenCensus projects, is enabling Observability 2.0. This talk gives an overview of the OpenTelemetry project and then outlines some production-proven architectures for improving the observability of your applications and systems.
Architectures That Scale Deep - Regaining Control in Deep SystemsC4Media
Video and slides synchronized, mp3 and slide download available at URL https://bit.ly/2FWc5Sk.
Ben Sigelman talks about "Deep Systems", their common properties and re-introduces the fundamentals of control theory from the 1960s, including the original conceptualizations of Observability & Controllability. He uses examples from Google & other companies to illustrate how deep systems have damaged people's ability to observe software, and what needs to be done in order to regain control. Filmed at qconsf.com.
Ben Sigelman is a co-founder and the CEO at LightStep, a co-creator of Dapper (Google’s distributed tracing system), and co-creator of the OpenTracing and OpenTelemetry projects (both part of the CNCF). His work and interests gravitate towards observability, especially where microservices, high transaction volumes, and large engineering organizations are involved.
Reactive programming is a general programming term focused on reacting to changes, such as data values or events. It can and often is done imperatively. A callback, delegate is an approach to reactive programming done imperatively.
Reactive Programming In Java Using: Project ReactorKnoldus Inc.
The session provides details about reactive programming with reactive streams. The purpose of Reactive Streams is to provide a standard for asynchronous stream processing with non-blocking backpressure.”
This concept is explained using Project reactor.
Monitoring Cloud Native Applications with PrometheusJacopo Nardiello
This talk is a quick intro to Prometheus with an overview on all its components. The presentation points to a generally available demo so that you can see all its components in action.
The monolith to cloud-native, microservices evolution has driven a shift from monitoring to observability. OpenTelemetry, a merger of the OpenTracing and OpenCensus projects, is enabling Observability 2.0. This talk covers the latest concepts in observability and then demonstrates how to configure and deploy various OpenTelemetry components to effectively meet your SLO's.
Presentation by Rob Brinkman, Senior Advisor Safe and Resilient Infrastructure, at Deltares, at the webinar Probabilistic Toolkit (PTK), during Delft Software Days - Edition 2021. Tuesday, 2 November 2021.
WJAX 2019 - Taking Distributed Tracing to the next levelFrank Pfleger
The shift from monolithic applications to microservices led to many new challenges we haven’t had before. Especially analyzing problems and tracking down erroneous components of a distributed system has become much more difficult as slicing and decoupling applications advances. We now have to answer questions like: How do we find out which services were involved when processing a specific request and how long did it take to respond? How do we figure out which service is causing a request to fail and why? These issues are addressed by Distributed Tracing tools like Zipkin, Jaeger, OpenTracing and OpenCensus. But how can we leverage the data we are gathering using such tools to gain new insights into our business processes, instead of just focussing on the technical aspects?
Jiangping Xu, Microsoft
With a rapid growing of M365 Office customers, the security scanning coverage has been tripled in years and it keeps scaling. Making all Office service machines compliant and security patching up to date within different product environments is challenging and require a growing mindset and scalable engineering solution. In this session, we introduce approaches and security scanning infrastructures we build to support large scale of service machines. We will discuss how to detect unhealthy scanners and hosts across M365 services and how to make monitoring and alerts intelligent and action based.
Not my problem - Delegating responsibility to infrastructureYshay Yaacobi
Slides for for my talk, appeared on Code-Europe Poznan 12.06.2018
(https://www.codeeurope.pl/en/speakers/yshay-yaacobi)
https://github.com/yshayy/not-my-problem-talk
https://github.com/Yshayy/not-my-problem-talk/blob/master/slides/demo.md
Evolution of Monitoring and Prometheus (Dublin 2018)Brian Brazil
This talk looks at the evolution of monitoring over time, the ways in which you can approach monitoring, where Prometheus fit into all this, and how Prometheus itself has grown over time.
Observability in Java: Getting Started with OpenTelemetryDevOps.com
Our software is more complex than ever: applications must be reliable, predictable, and easy to use to meet modern expectations. As developers, this means our responsibilities have grown while the things we can control have stayed the same. In order to better understand our systems and create truly modern software, we need observability.
This workshop will walk through what observability means for Java developers and how to achieve it in our systems with the least amount of work using the open source observability project OpenTelemetry.
Deep Dive into the Idea of Software ArchitectureMatthew Clarke
This talk was an experiment in combining a number of ideas I'd been learning and thinking about into a coherent presentation, that would hopefully be useful. The was to give a solid grounding to the idea of software architecture, including taking a critical look at what it is and if it really matters. It then moves into the topics of boundaries and abstractions, horizontal and vertical layers, cross-cutting concerns, "Clean Architecture" and the Dependency Rule it rests upon. It was presented internally at Genesis Energy in September 2018.
Capability Building for Cyber Defense: Software Walk through and Screening Maven Logix
Dr. Fahim Arif who is the Director R&D at MCS, principal investigator and GHQ authorized consultant for Nexsource Pak (Pvt) Ltd) discussed the capability of building cyber defense in the Data Protection and Cyber Security event that was hosted recently by Maven Logix. In his session he gave the audience valuable information about the life cycle of a cyber-threat discussing what and how to take measures by performing formal code reviews, code inspections. He discussed essential elements of code review, paired programming and alternatives to treat and tackle cyber-threat
Possibility of arbitrary code execution by Step-Oriented Programming by Hiroa...CODE BLUE
An embedded system has a stub to connect with a host PC and debug a program on the system remotely. A stub is an independent control program that controls a main program to enable debugging by a debugger. A stub is simplified by only processing the simple controls such as reading or writing of the register or of a memory, and a debugger processes a complicated analysis on the host PC.
Communication with a debugger on the host PC and a stub on the embedded system is performed by a protocol called Remote Serial Protocol (RSP) over a serial communication or TCP/IP communication. If this communication is taken away, it becomes possible to operate a stub arbitrarily. We considered what kind of attack possibility there was in that case, and identified that execution of arbitrary code constructed from pieces of machine code, combined with (SOP: Step-Oriented Programming) is possible by repeating step execution while changing the value of the program counter. Therefore it is possible to construct an arbitrary code and execute it from existing machine code, even if execution of the injected machine code is impossible because execution on data area is prevented by DEP or only machine code on the flash ROM are allowed execution.
I will explain about an attack principle by SOP and the results from constructed attack code and actual inspection.
Anoushiravan Ghamsari, known as Anoush Ghamsari is a brilliant architect, the way he uses his creativity to create phenomenal concepts is beyond this world.
A case study why Zoominfo uses Terraform Cloud in high-scale environment. Tal Hibner
We hosted Tal Hibner, Senior DevOps Engineer from ZoomInfo, and he shared a case study why they use Terraform Cloud in high-scale environment. To get the summary, full recording and transcription visit here: https://www.almtoolbox.com/blog_he/terraform-cloud-webinar-zoominfo/
How to Position Your Globus Data Portal for Success Ten Good PracticesGlobus
Science gateways allow science and engineering communities to access shared data, software, computing services, and instruments. Science gateways have gained a lot of traction in the last twenty years, as evidenced by projects such as the Science Gateways Community Institute (SGCI) and the Center of Excellence on Science Gateways (SGX3) in the US, The Australian Research Data Commons (ARDC) and its platforms in Australia, and the projects around Virtual Research Environments in Europe. A few mature frameworks have evolved with their different strengths and foci and have been taken up by a larger community such as the Globus Data Portal, Hubzero, Tapis, and Galaxy. However, even when gateways are built on successful frameworks, they continue to face the challenges of ongoing maintenance costs and how to meet the ever-expanding needs of the community they serve with enhanced features. It is not uncommon that gateways with compelling use cases are nonetheless unable to get past the prototype phase and become a full production service, or if they do, they don't survive more than a couple of years. While there is no guaranteed pathway to success, it seems likely that for any gateway there is a need for a strong community and/or solid funding streams to create and sustain its success. With over twenty years of examples to draw from, this presentation goes into detail for ten factors common to successful and enduring gateways that effectively serve as best practices for any new or developing gateway.
In software engineering, the right architecture is essential for robust, scalable platforms. Wix has undergone a pivotal shift from event sourcing to a CRUD-based model for its microservices. This talk will chart the course of this pivotal journey.
Event sourcing, which records state changes as immutable events, provided robust auditing and "time travel" debugging for Wix Stores' microservices. Despite its benefits, the complexity it introduced in state management slowed development. Wix responded by adopting a simpler, unified CRUD model. This talk will explore the challenges of event sourcing and the advantages of Wix's new "CRUD on steroids" approach, which streamlines API integration and domain event management while preserving data integrity and system resilience.
Participants will gain valuable insights into Wix's strategies for ensuring atomicity in database updates and event production, as well as caching, materialization, and performance optimization techniques within a distributed system.
Join us to discover how Wix has mastered the art of balancing simplicity and extensibility, and learn how the re-adoption of the modest CRUD has turbocharged their development velocity, resilience, and scalability in a high-growth environment.
Code reviews are vital for ensuring good code quality. They serve as one of our last lines of defense against bugs and subpar code reaching production.
Yet, they often turn into annoying tasks riddled with frustration, hostility, unclear feedback and lack of standards. How can we improve this crucial process?
In this session we will cover:
- The Art of Effective Code Reviews
- Streamlining the Review Process
- Elevating Reviews with Automated Tools
By the end of this presentation, you'll have the knowledge on how to organize and improve your code review proces
Cyaniclab : Software Development Agency Portfolio.pdfCyanic lab
CyanicLab, an offshore custom software development company based in Sweden,India, Finland, is your go-to partner for startup development and innovative web design solutions. Our expert team specializes in crafting cutting-edge software tailored to meet the unique needs of startups and established enterprises alike. From conceptualization to execution, we offer comprehensive services including web and mobile app development, UI/UX design, and ongoing software maintenance. Ready to elevate your business? Contact CyanicLab today and let us propel your vision to success with our top-notch IT solutions.
We describe the deployment and use of Globus Compute for remote computation. This content is aimed at researchers who wish to compute on remote resources using a unified programming interface, as well as system administrators who will deploy and operate Globus Compute services on their research computing infrastructure.
Advanced Flow Concepts Every Developer Should KnowPeter Caitens
Tim Combridge from Sensible Giraffe and Salesforce Ben presents some important tips that all developers should know when dealing with Flows in Salesforce.
Field Employee Tracking System| MiTrack App| Best Employee Tracking Solution|...informapgpstrackings
Keep tabs on your field staff effortlessly with Informap Technology Centre LLC. Real-time tracking, task assignment, and smart features for efficient management. Request a live demo today!
For more details, visit us : https://informapuae.com/field-staff-tracking/
Quarkus Hidden and Forbidden ExtensionsMax Andersen
Quarkus has a vast extension ecosystem and is known for its subsonic and subatomic feature set. Some of these features are not as well known, and some extensions are less talked about, but that does not make them less interesting - quite the opposite.
Come join this talk to see some tips and tricks for using Quarkus and some of the lesser known features, extensions and development techniques.
Multiple Your Crypto Portfolio with the Innovative Features of Advanced Crypt...Hivelance Technology
Cryptocurrency trading bots are computer programs designed to automate buying, selling, and managing cryptocurrency transactions. These bots utilize advanced algorithms and machine learning techniques to analyze market data, identify trading opportunities, and execute trades on behalf of their users. By automating the decision-making process, crypto trading bots can react to market changes faster than human traders
Hivelance, a leading provider of cryptocurrency trading bot development services, stands out as the premier choice for crypto traders and developers. Hivelance boasts a team of seasoned cryptocurrency experts and software engineers who deeply understand the crypto market and the latest trends in automated trading, Hivelance leverages the latest technologies and tools in the industry, including advanced AI and machine learning algorithms, to create highly efficient and adaptable crypto trading bots
OpenFOAM solver for Helmholtz equation, helmholtzFoam / helmholtzBubbleFoamtakuyayamamoto1800
In this slide, we show the simulation example and the way to compile this solver.
In this solver, the Helmholtz equation can be solved by helmholtzFoam. Also, the Helmholtz equation with uniformly dispersed bubbles can be simulated by helmholtzBubbleFoam.
How Recreation Management Software Can Streamline Your Operations.pptxwottaspaceseo
Recreation management software streamlines operations by automating key tasks such as scheduling, registration, and payment processing, reducing manual workload and errors. It provides centralized management of facilities, classes, and events, ensuring efficient resource allocation and facility usage. The software offers user-friendly online portals for easy access to bookings and program information, enhancing customer experience. Real-time reporting and data analytics deliver insights into attendance and preferences, aiding in strategic decision-making. Additionally, effective communication tools keep participants and staff informed with timely updates. Overall, recreation management software enhances efficiency, improves service delivery, and boosts customer satisfaction.
Into the Box Keynote Day 2: Unveiling amazing updates and announcements for modern CFML developers! Get ready for exciting releases and updates on Ortus tools and products. Stay tuned for cutting-edge innovations designed to boost your productivity.
A Comprehensive Look at Generative AI in Retail App Testing.pdfkalichargn70th171
Traditional software testing methods are being challenged in retail, where customer expectations and technological advancements continually shape the landscape. Enter generative AI—a transformative subset of artificial intelligence technologies poised to revolutionize software testing.
Enhancing Research Orchestration Capabilities at ORNL.pdfGlobus
Cross-facility research orchestration comes with ever-changing constraints regarding the availability and suitability of various compute and data resources. In short, a flexible data and processing fabric is needed to enable the dynamic redirection of data and compute tasks throughout the lifecycle of an experiment. In this talk, we illustrate how we easily leveraged Globus services to instrument the ACE research testbed at the Oak Ridge Leadership Computing Facility with flexible data and task orchestration capabilities.
Innovating Inference - Remote Triggering of Large Language Models on HPC Clus...Globus
Large Language Models (LLMs) are currently the center of attention in the tech world, particularly for their potential to advance research. In this presentation, we'll explore a straightforward and effective method for quickly initiating inference runs on supercomputers using the vLLM tool with Globus Compute, specifically on the Polaris system at ALCF. We'll begin by briefly discussing the popularity and applications of LLMs in various fields. Following this, we will introduce the vLLM tool, and explain how it integrates with Globus Compute to efficiently manage LLM operations on Polaris. Attendees will learn the practical aspects of setting up and remotely triggering LLMs from local machines, focusing on ease of use and efficiency. This talk is ideal for researchers and practitioners looking to leverage the power of LLMs in their work, offering a clear guide to harnessing supercomputing resources for quick and effective LLM inference.
First Steps with Globus Compute Multi-User EndpointsGlobus
In this presentation we will share our experiences around getting started with the Globus Compute multi-user endpoint. Working with the Pharmacology group at the University of Auckland, we have previously written an application using Globus Compute that can offload computationally expensive steps in the researcher's workflows, which they wish to manage from their familiar Windows environments, onto the NeSI (New Zealand eScience Infrastructure) cluster. Some of the challenges we have encountered were that each researcher had to set up and manage their own single-user globus compute endpoint and that the workloads had varying resource requirements (CPUs, memory and wall time) between different runs. We hope that the multi-user endpoint will help to address these challenges and share an update on our progress here.
Strategies for Successful Data Migration Tools.pptxvarshanayak241
Data migration is a complex but essential task for organizations aiming to modernize their IT infrastructure and leverage new technologies. By understanding common challenges and implementing these strategies, businesses can achieve a successful migration with minimal disruption. Data Migration Tool like Ask On Data play a pivotal role in this journey, offering features that streamline the process, ensure data integrity, and maintain security. With the right approach and tools, organizations can turn the challenge of data migration into an opportunity for growth and innovation.
top nidhi software solution freedownloadvrstrong314
This presentation emphasizes the importance of data security and legal compliance for Nidhi companies in India. It highlights how online Nidhi software solutions, like Vector Nidhi Software, offer advanced features tailored to these needs. Key aspects include encryption, access controls, and audit trails to ensure data security. The software complies with regulatory guidelines from the MCA and RBI and adheres to Nidhi Rules, 2014. With customizable, user-friendly interfaces and real-time features, these Nidhi software solutions enhance efficiency, support growth, and provide exceptional member services. The presentation concludes with contact information for further inquiries.
2. Introduction to Software Technology
Introduction to Software Technology
• Software is a set of instructions that determines what a general-
purpose computer will do. Thus, in some sense, a software
program is an instantiation of a particular machine (made up of
the computer and its instructions).
• Machines like this obviously have explicit rules and well-defined
behavior. Although we can watch this behavior unfold as we run
a program on a machine, looking at the code and coming to an
understanding of the inner workings of a program sometimes
takes more effort.
3. Reverse Engineering
Reverse Engineering
Reverse Engineering
Reverse Engineering
• Reverse engineering is the process of creating a blueprint of a
machine to discern its rules by looking only at the machine and
its behavior. At a high level, this process involves taking
something that you may not completely understand technically
when you start, and coming to understand completely its
function, its internals, and its construction.
• A good reverse engineer attempts to understand the details of
software, which by necessity involves understanding how the
overall computing machinery that the software runs on
functions. A reverse engineer requires a deep understanding of
both the hardware and the software, and how it all works
together.
4.
5. Reverse Engineering (Cont.)
Reverse Engineering (Cont.)
• Think about how external input is handled by a software
program. External "user" input can contain commands and
data. Each code path in the target involves a number of control
decisions that are made based on input. Sometimes a code path
will be wide and will allow any number of messages to pass
through successfully.
• Other times a code path will be narrow, closing things down or
even halting if the input isn't formatted exactly the right way.
This series of twists and turns can be mapped if you have the
right tools.
6.
7. Reverse Engineering (cont.)
Reverse Engineering (cont.)
• Generally speaking, the deeper you go as you wander into a
program, the longer the code path between the input where you
"start" and the place where you end up. Getting to a particular
location in this house of logic requires following paths to various
rooms (hopefully where the valuables are).
• Each internal door you pass through imposes rules on the kinds
of messages that may pass. Wandering from room to room thus
involves negotiating multiple sets of rules regarding the input
that will be accepted. This makes crafting an input stream that
can pass through lots of doors (both external and internal) a real
challenge. In general, attack input becomes progressively more
refined and specific as it digs deeper into a target program.
8.
9. Why Reverse Engineering?
Why Reverse Engineering?
• Reverse Engineering allows you to learn about a program's
structure and its logic. Reverse Engineering thus leads to critical
insights regarding how a program functions. This kind of
insight is extremely useful when you exploit software. There are
obvious advantages to be had from reverse engineering.
• For example, you can learn the kind of system functions a target
program is using. You can learn the files the target program
accesses. You can learn the protocols the target software uses
and how it communicates with other parts of the target network.
10.
11. Why Reverse Engineering (cont.)
Why Reverse Engineering (cont.)
• The most powerful advantage to reversing is that you can change
a program's structure and thus directly affect its logical flow.
Technically this activity is called patching, because it involves
placing new code patches (in a seamless manner) over the
original code, much like a patch stitched on a blanket.
Like any skill, reverse engineering can be used for good and for bad ends.
• Patching allows you to add commands or change the way
particular function calls work. This enables you to add secret
features, remove or disable functions, and fix security bugs
without source code. A common use of patching in the
computer underground involves removing copy protection
mechanisms.
Note: Like any skill, Reverse Engineering can be used for Good and for Bad Ends
12. Debugger
Debugger
Debugger
Debugger
• A Debugger is a software program that attaches to and controls
other software programs. A debugger allows single stepping of
code, debug tracing, setting breakpoints, and viewing variables
and memory state in the target program as it executes in a
stepwise fashion.
• Debuggers are invaluable in determining logical program flow.
• Olly Debugger, Soft Ice, IDA Pro are some of the very famous
Software Debuggers
13.
14. Disassembler
Disassembler
Disassembler
Disassembler
• A Disassembler is a tool that converts machine-readable code
into assembly language. Assembly language is a human-readable
form of machine code (well, more human readable than a string
of bits anyway). Disassemblers reveal which machine
instructions are being used in the code.
• Machine code is usually specific to a given hardware architecture
(such as the PowerPC chip or Intel Pentium chip). Thus,
Disassemblers are written expressly for the target hardware
architecture.
15.
16. Methods of Reverse Engineering
Methods of Reverse Engineering
• There are several methods that can be used while reverse
engineering software. Each has benefits and each has resource
and time requirements. A typical approach uses a mixture of
methods when decompiling and examining software. The best
method mix depends entirely on your goals. For example, you
may first want to run a quick scan of the code for obvious
vulnerabilities.
• Next, you may want to perform a detailed input trace on the
user-supplied data. You may not have time to trace each and
every path, so you may use complex breakpoints and other tools
to speed up the process. What follows is a brief description of
several basic methods.
17.
18. Error Tracing
Error Tracing
Error Tracing
Error Tracing
• Error tracing is the most thorough of all Software Cracking
methods.
• First you identify the Text Strings in the software code and then
look for the error message displayed to the user when a wrong
serial number is provided to the software product.
• Identify the working and flow of Program or Function