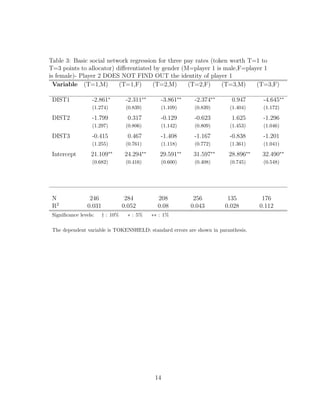
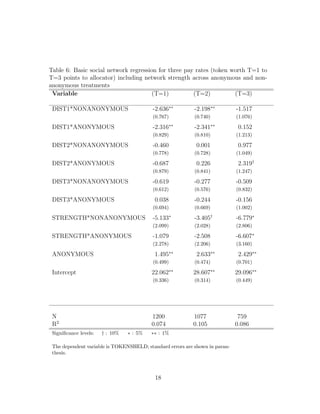
This document summarizes a study that measures social capital within a social network. It defines two types of social capital: 1) preference-based social capital, which is based on altruism toward friends and declines with social distance; and 2) cooperative social capital, which arises from repeated interactions and cooperation between agents. The study finds evidence of both types of social capital - preference-based social capital increases the weight on a friend's utility by 15% while cooperative social capital adds another 5%.
MATCHING STRUCTURE AND THE EVOLUTION OF COOPERATION IN THE PRISONER’S DILEMMAijcsit
With the help of both an experiment and analytical techniques, Axelrod and Hamilton [1] showedthat
cooperation can evolve in a Prisoner’s Dilemma game when pairsof individuals interact repeatedly. They
also demonstrated that, whenpairing of individual is not completely random, cooperating behaviour canevolve in a world initially dominated by defectors. This result leads usto address the following question:Since non-random pairing is a powerfulmechanism for the promotion of cooperation in a repeated Prisoner’sDilemma game, can this mechanism also promote the evolution of cooperationin a non-repeated version of the game? Computer simulations areused to study the relation between non-random pairing and the maintenanceof cooperative behaviour under evolutionary dynamics. We concludethat non-random pairing can secure cooperation also when the possibilityof repeated interaction among the same pairs of individuals is ruled out.
IOSR Journal of Computer Engineering (IOSR-JCE) is a double blind peer reviewed International Journal that provides rapid publication (within a month) of articles in all areas of computer engineering and its applications. The journal welcomes publications of high quality papers on theoretical developments and practical applications in computer technology. Original research papers, state-of-the-art reviews, and high quality technical notes are invited for publications.
A Game theoretic approach for competition over visibility in social networksjournalBEEI
Social Networks have known an important evolution in the last few years. These structures, made up of individuals who are tied by one or more specific types of interdependency, constitute the window for members to express their opinions and thoughts by sending posts to their own walls or others' timelines. Actually, when a content arrives, it's located on the top of the timeline pushing away older messages. This situation causes a permanent competition over visibility among subscribers who jump on opponents to promote conflict. Our study presents this competition as a non-cooperative game; each source has to choose frequencies which assure its visibility. We model it, exploring the theory of concave games, to reach a situation of equilibrium; a situation where no player has the ultimate ability to deviate from its current strategy. We formulate the named game, then we analyze it and prove that there is exactly one Nash equilibrium which is the convergence of all players' best responses. We finally provide some numerical results, taking into consideration a system of two sources with a specific frequency space, and analyze the effect of different parameters on sources' visibility on the walls of social networks.
From http://www.csdn.net/article/2015-12-17/2826501
《新加坡管理大学信息系统学院教授朱飞达 :大数据与金融创新:从研究到实战》
新加坡管理大学信息系统学院教授朱飞达分享了基于社交媒体大数据的个人征信应用模式,包括四个方面:提取社交维度特征,加入现在传统信用模型;采用产生式模式挖掘不同信用类别的隐含用户模型;基于社会关系网络的风险传递查询和探索引擎;实时反欺诈侦测和预警系统。
HLEG thematic workshop on Measuring Trust and Social Capital, John HelliwellStatsCommunications
HLEG thematic workshop on Measuring Trust and Social Capital, 10 June 2016, Paris, France. More information at: www.oecd.org/statistics/measuring-economic-social-progress/hleg-workshop-on-measuring-trust-and-social-capital-2016.htm
In the realm of public goods provision, the quest for optimality has long captivated researchers and policymakers alike. The allocation of resources to ensure the maximum benefit for society remains a complex challenge. One intriguing avenue of study in this pursuit is the application of replicator dynamics, a mathematical framework derived from evolutionary biology. This approach offers a unique lens through which we can explore the dynamics of public goods, uncovering strategies that evolve over time to enhance the overall welfare of a community. In this exploration, we delve into the concept of replicator dynamics as a tool to decipher the intricate puzzle of optimizing public goods allocation.
Reciprocity, the giving of benefits toanother in return fo.docxaudeleypearl
R
eciprocity, the giving of benefits to
another in return for benefits received, is
a defining feature of social exchange. As
Emerson noted, it is this feature that gives
exchange its name: “Benef its obtained
through social process are contingent upon
benefits provided ‘in exchange’” (1981:32).
Recognition of the importance of reciprocity
in social life is by no means restricted to
exchange theorists, however. Hobhouse
(1906:12) called reciprocity “the vital princi-
ple of society,” Becker (1956:1) referred to
our species as “homo reciprocus,” and Simmel
(1950:387) noted that social equilibrium and
cohesion could not exist without “the reci-
procity of service and return service.”
Gouldner (1960) proposed that an internalized
moral obligation—a “norm of reciprocity”—
helps assure that people help others who have
helped them in the past. More recently, Nowak
and Sigmund (2000) have described reciproc-
ity as the evolutionary basis for cooperation in
society.
While there is little question of reciproci-
ty’s value for society, there is far less research
on the aspects of reciprocity that give it value.
Many scholars assume that the value of reci-
procity lies primarily in the benef its
exchanged, and some restrict the definition of
reciprocity to returns of goods or services that
are at least roughly equivalent in value to
those received (Homans 1974; Malinowski
1922; Simmel 1950). This emphasis on bene-
fit value governs assessment of impersonal
market exchanges, and it is also prominent in
both classical and contemporary research on
social exchange, where studies of power use
and distributive justice focus primarily on the
equality or inequality of the benefits given and
received.
The value of reciprocal giving, however,
lies only partly in the goods and services that
people exchange. We propose two distinct
dimensions of the value of reciprocity: (1) its
Social Psychology Quarterly
2007, Vol. 70, No. 2, 199–217
The Value of Reciprocity*
LINDA D. MOLM
University of Arizona
DAVID R. SCHAEFER
Arizona State University
JESSICA L. COLLETT
University of Notre Dame
The value of reciprocity in social exchange potentially comprises both instrumental value
(the value of the actual benefits received from exchange) and communicative or symbolic
value (the expressive and uncertainty reduction value conveyed by features of the act of reci-
procity itself). While all forms of exchange provide instrumental value, we propose that the
voluntary and uncertain nature of recurring reciprocal exchanges, in which actors individ-
ually give benefits to each other without formal agreements, make the act of reciprocity
itself an important vehicle for conveying symbolic value. We experimentally test the value
actors place on partners’ voluntary acts of reciprocity—over and above the instrumental
benefits obtained—by providing subjects with computer-simulated partners who systemati-
cally vary in the instrumental value, probability, and predictability of thei ...
I provide a (very) brief introduction to game theory. I have developed these notes to
provide quick access to some of the basics of game theory; mainly as an aid for students
in courses in which I assumed familiarity with game theory but did not require it as a
prerequisite
With the passage of time, the development of communication technology and transportation
broke the isolation among people. Relationship tends to be complicated, pluralism, dynamism.
In the network where interpersonal relationship and evolved complex net based on game theory
work serve respectively as foundation architecture and theoretical model, with the combination
of game theory and regard public welfare as influencing factor, we artificially initialize that
closed network system. Through continual loop operation of the program ,we summarize the
changing rule of the cooperative behavior in the interpersonal relationship, so that we can
analyze the policies about welfare system about whole network and the relationship of
frequency of betrayal in cooperative behavior. Most analytical data come from some simple
investigations and some estimates based on internet and environment and the study put
emphasis on simulating social network and analyze influence of social welfare system on
Cooperative Behavior .
The Effect of Social Welfare System Based on the Complex Networkcsandit
With the passage of time, the development of communication technology and transportation
broke the isolation among people. Relationship tends to be complicated, pluralism, dynamism.
In the network where interpersonal relationship and evolved complex net based on game theory
work serve respectively as foundation architecture and theoretical model, with the combination
of game theory and regard public welfare as influencing factor, we artificially initialize that
closed network system. Through continual loop operation of the program ,we summarize the
changing rule of the cooperative behavior in the interpersonal relationship, so that we can
analyze the policies about welfare system about whole network and the relationship of
frequency of betrayal in cooperative behavior. Most analytical data come from some simple
investigations and some estimates based on internet and environment and the study put
emphasis on simulating social network and analyze influence of social welfare system on
Cooperative Behavior .
Kubernetes & AI - Beauty and the Beast !?! @KCD Istanbul 2024Tobias Schneck
As AI technology is pushing into IT I was wondering myself, as an “infrastructure container kubernetes guy”, how get this fancy AI technology get managed from an infrastructure operational view? Is it possible to apply our lovely cloud native principals as well? What benefit’s both technologies could bring to each other?
Let me take this questions and provide you a short journey through existing deployment models and use cases for AI software. On practical examples, we discuss what cloud/on-premise strategy we may need for applying it to our own infrastructure to get it to work from an enterprise perspective. I want to give an overview about infrastructure requirements and technologies, what could be beneficial or limiting your AI use cases in an enterprise environment. An interactive Demo will give you some insides, what approaches I got already working for real.
JMeter webinar - integration with InfluxDB and GrafanaRTTS
Watch this recorded webinar about real-time monitoring of application performance. See how to integrate Apache JMeter, the open-source leader in performance testing, with InfluxDB, the open-source time-series database, and Grafana, the open-source analytics and visualization application.
In this webinar, we will review the benefits of leveraging InfluxDB and Grafana when executing load tests and demonstrate how these tools are used to visualize performance metrics.
Length: 30 minutes
Session Overview
-------------------------------------------
During this webinar, we will cover the following topics while demonstrating the integrations of JMeter, InfluxDB and Grafana:
- What out-of-the-box solutions are available for real-time monitoring JMeter tests?
- What are the benefits of integrating InfluxDB and Grafana into the load testing stack?
- Which features are provided by Grafana?
- Demonstration of InfluxDB and Grafana using a practice web application
To view the webinar recording, go to:
https://www.rttsweb.com/jmeter-integration-webinar
UiPath Test Automation using UiPath Test Suite series, part 3DianaGray10
Welcome to UiPath Test Automation using UiPath Test Suite series part 3. In this session, we will cover desktop automation along with UI automation.
Topics covered:
UI automation Introduction,
UI automation Sample
Desktop automation flow
Pradeep Chinnala, Senior Consultant Automation Developer @WonderBotz and UiPath MVP
Deepak Rai, Automation Practice Lead, Boundaryless Group and UiPath MVP
Neuro-symbolic is not enough, we need neuro-*semantic*Frank van Harmelen
Neuro-symbolic (NeSy) AI is on the rise. However, simply machine learning on just any symbolic structure is not sufficient to really harvest the gains of NeSy. These will only be gained when the symbolic structures have an actual semantics. I give an operational definition of semantics as “predictable inference”.
All of this illustrated with link prediction over knowledge graphs, but the argument is general.
Epistemic Interaction - tuning interfaces to provide information for AI supportAlan Dix
Paper presented at SYNERGY workshop at AVI 2024, Genoa, Italy. 3rd June 2024
https://alandix.com/academic/papers/synergy2024-epistemic/
As machine learning integrates deeper into human-computer interactions, the concept of epistemic interaction emerges, aiming to refine these interactions to enhance system adaptability. This approach encourages minor, intentional adjustments in user behaviour to enrich the data available for system learning. This paper introduces epistemic interaction within the context of human-system communication, illustrating how deliberate interaction design can improve system understanding and adaptation. Through concrete examples, we demonstrate the potential of epistemic interaction to significantly advance human-computer interaction by leveraging intuitive human communication strategies to inform system design and functionality, offering a novel pathway for enriching user-system engagements.
Elevating Tactical DDD Patterns Through Object CalisthenicsDorra BARTAGUIZ
After immersing yourself in the blue book and its red counterpart, attending DDD-focused conferences, and applying tactical patterns, you're left with a crucial question: How do I ensure my design is effective? Tactical patterns within Domain-Driven Design (DDD) serve as guiding principles for creating clear and manageable domain models. However, achieving success with these patterns requires additional guidance. Interestingly, we've observed that a set of constraints initially designed for training purposes remarkably aligns with effective pattern implementation, offering a more ‘mechanical’ approach. Let's explore together how Object Calisthenics can elevate the design of your tactical DDD patterns, offering concrete help for those venturing into DDD for the first time!
Smart TV Buyer Insights Survey 2024 by 91mobiles.pdf91mobiles
91mobiles recently conducted a Smart TV Buyer Insights Survey in which we asked over 3,000 respondents about the TV they own, aspects they look at on a new TV, and their TV buying preferences.
UiPath Test Automation using UiPath Test Suite series, part 4DianaGray10
Welcome to UiPath Test Automation using UiPath Test Suite series part 4. In this session, we will cover Test Manager overview along with SAP heatmap.
The UiPath Test Manager overview with SAP heatmap webinar offers a concise yet comprehensive exploration of the role of a Test Manager within SAP environments, coupled with the utilization of heatmaps for effective testing strategies.
Participants will gain insights into the responsibilities, challenges, and best practices associated with test management in SAP projects. Additionally, the webinar delves into the significance of heatmaps as a visual aid for identifying testing priorities, areas of risk, and resource allocation within SAP landscapes. Through this session, attendees can expect to enhance their understanding of test management principles while learning practical approaches to optimize testing processes in SAP environments using heatmap visualization techniques
What will you get from this session?
1. Insights into SAP testing best practices
2. Heatmap utilization for testing
3. Optimization of testing processes
4. Demo
Topics covered:
Execution from the test manager
Orchestrator execution result
Defect reporting
SAP heatmap example with demo
Speaker:
Deepak Rai, Automation Practice Lead, Boundaryless Group and UiPath MVP
Encryption in Microsoft 365 - ExpertsLive Netherlands 2024Albert Hoitingh
In this session I delve into the encryption technology used in Microsoft 365 and Microsoft Purview. Including the concepts of Customer Key and Double Key Encryption.
Securing your Kubernetes cluster_ a step-by-step guide to success !KatiaHIMEUR1
Today, after several years of existence, an extremely active community and an ultra-dynamic ecosystem, Kubernetes has established itself as the de facto standard in container orchestration. Thanks to a wide range of managed services, it has never been so easy to set up a ready-to-use Kubernetes cluster.
However, this ease of use means that the subject of security in Kubernetes is often left for later, or even neglected. This exposes companies to significant risks.
In this talk, I'll show you step-by-step how to secure your Kubernetes cluster for greater peace of mind and reliability.
Connector Corner: Automate dynamic content and events by pushing a buttonDianaGray10
Here is something new! In our next Connector Corner webinar, we will demonstrate how you can use a single workflow to:
Create a campaign using Mailchimp with merge tags/fields
Send an interactive Slack channel message (using buttons)
Have the message received by managers and peers along with a test email for review
But there’s more:
In a second workflow supporting the same use case, you’ll see:
Your campaign sent to target colleagues for approval
If the “Approve” button is clicked, a Jira/Zendesk ticket is created for the marketing design team
But—if the “Reject” button is pushed, colleagues will be alerted via Slack message
Join us to learn more about this new, human-in-the-loop capability, brought to you by Integration Service connectors.
And...
Speakers:
Akshay Agnihotri, Product Manager
Charlie Greenberg, Host
Dev Dives: Train smarter, not harder – active learning and UiPath LLMs for do...UiPathCommunity
💥 Speed, accuracy, and scaling – discover the superpowers of GenAI in action with UiPath Document Understanding and Communications Mining™:
See how to accelerate model training and optimize model performance with active learning
Learn about the latest enhancements to out-of-the-box document processing – with little to no training required
Get an exclusive demo of the new family of UiPath LLMs – GenAI models specialized for processing different types of documents and messages
This is a hands-on session specifically designed for automation developers and AI enthusiasts seeking to enhance their knowledge in leveraging the latest intelligent document processing capabilities offered by UiPath.
Speakers:
👨🏫 Andras Palfi, Senior Product Manager, UiPath
👩🏫 Lenka Dulovicova, Product Program Manager, UiPath
Dev Dives: Train smarter, not harder – active learning and UiPath LLMs for do...
socialpref
1. Social Capital in Social Networks∗
Markus M. Mobius Do Quoc-Anh
Harvard University and NBER Harvard University
Tanya S. Rosenblat†
Wesleyan University and CBRSS
October 7, 2004
Abstract
We define and measure social capital within a large social network where
agents take actions which have externalities on other agents. Our concept
of social capital measures the extent to which agents are able to internalize
these externalities. We distinguish between preference-based social capital
(directed altruism) and cooperative social capital based on repeated interac-
tion between pairs or groups of agents. We find that preference-based social
capital increases an agent’s weight on a friend’s utility by about 15 percent
and cooperative social capital adds another 5 percent.
1 Introduction
Social capital helps to internalize externalities for which there is no market and
where transactions costs are too high to write complete contracts. Informal credit
arrangements, financial and in-kind assistance to neighbors and friends or invest-
ments in public goods are just one of the many examples of social capital.
In this paper we provide a simple definition of social capital with a community
or social network and measure social capital in a real-world social network using a
series of experiments by building on the work of Andreoni and Miller (2002).
Our methodology distinguishes between two sources of social capital: preference-
based and cooperative social capital. Preference-based social capital is based on
simple altruism - agents can obviously internalize externalities if they take each
∗
Preliminary and incomplete. Please do not cite.
†
Wesleyan University, PAC 123, 238 Church Street, Middletown CT 06459, Telephone: (860)
685 5351, Fax: (860) 685 2781. E-Mail: trosenblat@wesleyan.edu
1
2. other’s utility into account. However, we expect the strength of altruism to vary
systematically with the relative position of agents within the social structure which
makes the empirical calibration of such a model interesting. How strongly do agents
care about the utility of their friends, cliques or people who live close to them?
Cooperative social capital arises from repeated interactions between pairs or
groups of agents. This makes agents appear to act like altruists even if they have
perfectly selfish preferences. Due to the multiplicity of equilibria in repeated games
the empirical calibration of our model provides interesting insights into the extent
and relative important of cooperative social capital.
We find evidence of both cooperative and preference-based social capital. While
there is considerable heterogeneity in the base level of altruism amongst agents we
find that preference-based social capital increases the weight on a friend’s utility
by about 15 percent while cooperative social capital adds another 5 percent.
Our approach to social capital is quite different from other experimental work
which mostly builds on the trust game (Berg, Dickhaut, and McCabe 1995). The
trust game is typically played in a computer lab with anonymous players (Glaeser,
Laibson, Scheinkman, and Soutter (1999) is an important exception). In this
setting we expect that both preference-based and cooperative social capital are
weaker than within a non-anonymous social network setting. In this paper we
study social capital within a well-defined community. Moreover, the anonymous
interaction setting lacks the rich structure of the social network which makes it
more difficult to test micro models of social capital.
The balance of the paper is as follows. In sections 2 and 3 we develop a simple
theory framework and define what we mean with social capital. Section 4 discusses
the design of the experiment. Results are presented in section 5.
2 Theory Framework
2.1 Social Network
The social network consists of n agents who are either directly or indirectly con-
nected with each other. We define the network distance between two agents i and
j as the shortest chain which connects two agents. Friends are agent who live a
distance 1 away. Indirect Friends live a distance of 2 away.
2.2 Actions
Time is continuous and all agents share a common discount factor δ. At rate 1
an agent faces a decision problem of type q ∈ [0, q] with q > 1. The type is
distributed over [0, q] according to some distribution f (q). Agent i can take an
2
3. action ai ∈ [0, 1] which will impact both him and some other agent j. We assume
that the probability that agent i is matched to j is pij and that pij = pji .
If agent i takes action ai he generates the following outcomes xi and xj for
himself and player j:
xi = a i
xj = q(1 − ai ) (1)
Intuitively, player i is dividing a pie of size 1 between himself and the other player
where the price of a share of pie to the other player is q.
Note, that this setup implies that each agent j consumes on average at rate
2 - at rate 1 he enjoys utility from his own decisions and at the same rate he is
subject to decisions made by another player.
This setup is meant to capture the fact that our actions often affect our social
neighbors. An agent, who receives some cash, for example, might decide to con-
sume it herself or lend some of it to a friend who might have better use for the
money.
2.3 Utility
Agents derive ‘selfish’ instantaneous utility ui = v(xi ) from consuming xi where v
is a standard concave and increasing function such that v(0) = 0.
Agents are also altruistic when taking an action and they face the following
altruistic utility function which is a weighted average of their own selfish utility
and the utility of the other agent:
ui = sij v(xi ) + (1 − sij )v(xj ) (2)
We say that agent i is perfectly selfish towards agent j if sij = 0 and that he is
perfectly altruistic if sij = 1 .
2
Note, that we make the important assumption that an agent only derives utility
from altruism when making a decision herself. In particular, we assume implicitly
that she derives no utility from the actions of another agent who makes a decision
impacting a third agent. This keeps the setup particularly simple.
3 Preference-based and Cooperative Social Cap-
ital
Our framework allows us to define two types of social capital - preference-based
and cooperative social capital. We define both types of social capital with respect
to the benchmark of a social planner who has a utilitarian social welfare function
3
4. with equal weights on the utilities of each agent. This social planner always chooses
an agent which assumes equal weight sij = 1 on both agent i’s and j’s utility.
2
3.1 Preference-based Social Capital
The closer social welfare in the decentralized equilibrium is to social welfare in
social planner’s equilibrium the greater we say is social capital. We can capture
this notion formally by defining social capital as a matrix (sij ). If all agents value
the utility of the other agent as much as their own utility then the decentralized
equilibrium will be identical to the social planner’s solution.
However, we do not expect that altruistic preferences alone are strong enough
to bring about this solution. First of all, we expect that agents value their own
1
utility more than the utility of other agents such that sij ≥ 2 . Second, we expect
that altruistic preferences decline with social distance.
We call the social capital defined by the matrix (sij ) preference-based social cap-
ital. In contrast to cooperative social capital which we defined in the next section
preference-based social capital does not require agents to be forward-looking.
3.2 Cooperative Social Capital
If agents are forward-looking they can partially or fully internalize the action ex-
ternalities in our framework by cooperating through repeated game.
The simplest type of repeated game is bilateral cooperation played between
independent pairs of players i and j. We focus on the equilibrium which gives
both players the highest utility. We also assume for simplicity that there is only a
single decision problems of type q ∗ .
Since our setup is symmetric and pij = pji we can focus on symmetric trigger-
strategy equilibria where both players take action a∗ . This gives them discounted
utility U :
1
[(sij v(a∗ ) + (1 − sij )v(q(1 − a∗ ))) + δpij v(q(1 − a∗ ) ]
U= (3)
1 − δpij
altruistic utility from own utility derived
actions from actions of
other player
The equilibrium which gives both players the highest utility achievable through
bilateral cooperation is described by the action a∗ which maximizes this expression.
It is easy to see that this equilibrium essentially implements the same action as
a decision maker with some sij (sij , pij ) < sij . The higher the frequency pij of
ˆ
interaction the less selfish the agent will act.
4
5. We call (sij ) the preference-based component of social capital and (ˆij −sij ) the
s
cooperative component of social capital. The sum of both components describes
total social capital.
Cooperative social capital increases if cooperation is not just bilateral but in-
volves groups of cooperating agents. The highest degree of cooperation can be
achieved if the entire community forms one large group. In this case each indi-
vidual cooperates with the group at rate 1 rather than rate pij which implies an
increase in cooperative social capital.
3.3 Discussion
Our definition of preference-based and cooperative social capital allows us to com-
pare social capital across communities by comparing the social capital vectors.
This ordering is a partial ordering.
4 Design
Our experiment has two parts. First, we measure the social network through a
network elicitation game which is essentially a coordination game. This provides
us with measures of social distance between agents as well as measures for the
strength of links. we will use Granovetter’s concept of weak and strong links
(Granovetter 1973) according to which link strength increases with the number of
common friends.
In the second phase of the experiment we select pairs of subjects randomly to
play an allocation where player 1 (allocator) divides 0 tokens between himself and
player 2 (recipient). Each of these decision problems is presented in two possible
situations - in one situation the recipient is told about the action choices of player
1 and in the second situation the recipient is not old about the action choices.
This allows us to separately measure both sij (when the recipien is not told
about the choices of the other agent) and sij (when the recipient is told about the
ˆ
allocator’s choices).
4.1 Network Elicitation Game
In December 2003 Subjects were recruited through posters, flyers and mail invi-
tation and directed to go to a website (in our case www.houseexperiment.org).
Subjects provided their email address and were sent a password.1 After login sub-
jects were asked to specify their own names from a drop-down menu of all students
1
This allows us to exclude subjects without a valid email address.
5
6. in the university.2 All future earnings from the experiment were then transferred
to the electronic cash-card account of that student.3
To give subjects an incentive to make truthful reports we frame their choice as
a coordination game: subjects receive 50 cents with 50 percent probability if they
name each other. We consider the expected payoff of 25 cents to be sufficiently
large to give subjects an incentive to report their friends truthfully but not large
enough to induce ‘gaming’. The randomization helps to avoid disappointment if a
subject is not being named by his or her list of friends because there is always the
possibility that a small number of matches is the result of bad luck.
The total earnings of subjects in our pilot consisted of a baseline compensation
for completing the full online survey (network elicitation game plus an additional
questionnaire collecting socio-economic data from subjects) and the earnings from
the network game. Subjects also entered a raffle where they could win valuable
prizes nine months later provided they completed the initial surveys plus all follow-
up treatments.
The network elicitation game can be easily modified to provide further infor-
mation on friendship links. For example, we also wanted to know how much time
friends spent on average per week together (in half hour increments) as a measure
of link strength. If subjects agreed on this dimension of their friendship the win-
ning probability increased from 50 percent to 75 percent. It is equally simple to
add further dimensions, such as length of friendship, whether friends met in their
dorm, in class or at some social event etc.
Our coordination game worked very well and provided high-quality social net-
work data that is comparable to data obtained with traditional (and very expen-
sive) survey techniques. Our pilot focused on two dorms with 806 students of
whom 569 signed up. The survey netted 5690 one-way links. Of those, 2086 links
were symmetric links were both agents had named each other. Most participants
spent less than half an hour with their 10th friend which indicated that a rooster of
10 friends is sufficient to measure the network or ‘real’ friends. Across symmetric
links subjects agreed in 80 percent of the cases on the time they spend together
in a typical week (± half an hour). The average cluster coefficient was 0.58 - it
measures the average probability that a friend’s friend is also my friend. The net-
work defined by symmetric links is mostly connected - there is a ‘giant connected
cluster’ that indirectly linked all but 34 agents to each other. This is a typical
2
The registrar provided us with a complete list of upper-class students from the university
including full campus address and room number but without email. Emails had to be provided
by students themselves. Subjects could select their name by choosing first their dorm and class
year which narrowed down the selection to about 100 names. To protect subjects’ privacy we
only provided the first name and the initial of the second name.
3
Most universities provide such cards to purchase food and beverages and these cards are
ideally suited to make multiple small transfers on a large scale.
6
7. feature of social networks (Watts and Strogatz 1998).
4.2 Treatment Phase
In May 2004 we ran various treatments to measure social preferences of students
in our sample. Within each house we randomly selected an equal number of player
1’s and player 2’s. Player 1’s were allocators in a modified dictator game. During
the course of the experiment they were matched with 5 potential player 2’s:
• one direct friend
• one indirect friend
• one friend of an indirect friend
• a student in the same staircase/floor who is at least a distance 4 removed
from the student
• a randomly selected student from the house who falls into none of the above
categories
Each of these pairs was played twice - in the first situation player 2 would find
out about player 1’s action and in the second situation she would not find out.
For each pair and each situation player 1 had to make three allocation decisions.
In each decision he had to allocate 50 tokens between himself and the other player.
• In the first decision the token was worth 1 point to him and 3 points to the
other player. This corresponds to a decision of type q = 3 in our model (i.e.
the relative value of a token is 3 to the other player).
• In the second decision the tokens were worth 2 points to both players (q = 1).
• The the third decision the tokens were worth 3 points to player 1 and 1 point
1
to the other player (q = 3 ).
One point equalled 10 cents. The maximum winnings of a player and one match
were $15.
All these decisions, situations and pairs were randomly presented to each player.
Because they had to take so many decisions we asked them to login twice on
two different days. On each day one of their decisions for one pair was randomly
selected and implemented. Our algorithm ensured that each recipient was matched
up with exactly two allocators eventually.
7
8. 5 Results
We start our analysis with simple regressions of tokens held by allocators (HOLD)
on characteristics of the network relationship between allocator and recipient. We
focus on two dimensions of this relationship: network distance and link strength.
Network distance can take the values 0 (stranger), 1 (direct friend), 2 (indirect
friend), 3 (friend of indirect friend). We form three indicator variables called
DIST1 (which is 1 if distance is 1), DIST2 and DIST3. We also have a variable
called SAMESTAIR which is 1 if player 1 and player 2 live in the same staircase.
This variable is never significant and hence dropped from the regressions.
Network strength measures how many common friends the allocator i and the
recipient j share. Formally, our variable STRENGTH takes values between 0 and
1 and is defined as follows:
1. Take the set of 10 friends named by player 1 and intersect it with the set of
10 people named by player 2.
2. The intersection varies between 0 and 10. Divide this number by 10. This is
our index of network strength.
A strong link exists between two agents who share many common friends. A weak
link exists between a pair of agents who have few common friends. If STRENGTH
is 0 then the two subjects have no friends in common at all. This distinction of
weak and strong links was first introduced by Granovetter (1973).
Note that our network strength measure is defined even if the allocator i and
recipient j are not direct friends and did not name each other. Generally, however,
we would expect that STRENGTH decreases with social distance which is indeed
the case.
We run all our regressions using fixed effects on allocators. This is important
because of considerable heterogeneity amongst allocators.
5.1 Averages
The average number of tokens held by player 1 in situations where player 2 does
not find out about the allocator’s choices range from 34 (q = 3) to 40 (q = 1) and
1
43 (q = 3 ).
In situations where the recipient does find out the allocator’s choices the allo-
cator holds fewer tokens for each of the three decision types ranging from 29 tokens
(q = 3) to 35 (q = 1) and 40 tokens (q = 1 ).
3
8
9. 5.2 Basic Regressions
Our first regression only includes network distance:
yij = α1 ∗ DIST 1ij + α2 ∗ DIST 2ij + α3 ∗ DIST 3ij + ηi + (4)
ij
where
yij = Tokens held by player i when playing with player j
ηi = player 1 fixed effect
DIST 1ij = DIST1 between i and j
DIST 2ij = DIST2 between i and j (5)
DIST 3ij = DIST3 between i and j
an error term which is conditionally independent
= i.i.d. draw from some error distribution given
ij
(ηi , DIST AN CE)
We run this regression separately for each of the three decisions and each of the
two situations using fixed effects. The results are in table 2 for the case where the
recipient does not find out about the allocator’s actions and in table 1 for the case
of non-anonymous interaction.
We find that for non-anonymous interaction about 20 percent more tokens
are passed to direct friends and about 8 percent more to indirect friends. For
anonymous interaction about 15 percent more tokens are passed to direct friends.
5.3 Gender Effects
We next estimate equation 4 separately for men and women. The results are
reported in tables 3 and 4.
We find that women are consistently less generous than men (looking at inter-
cept) and hold more tokens back on average. However, social distance effects are
very similar except for decision 3 where social network does not matter for men
but it does matter for women.
5.4 Social Network Strength
In the next specfication we include the network strength variable. Results are
reported in tables 4 and 5.
We find that strength is very significant and of similar magnitude as the coef-
ficients on DIST1. In fact, the strength variable sweeps away DIST2 and DIST3
9
10. effects in the case of non-anonymous interaction. We include interaction term be-
tween DIST1 and network strength to make sure that DIST1 coefficient measures
social closeness. It seems indeed the case that social distance and network strength
effects are different.
5.5 Unified Regressions
To distinguish between network distance and strength effects between the anony-
mous and non-anonymous treatments we also run the following specification which
includes a single allocator fixed effect across both the anonymous and non-anonymous
treatments (see table 6):
yij = α1 ∗ DIST 1ij ∗ (1 − Aij ) + α1 ∗ DIST 1ij ∗ Aij + α2 ∗ DIST 2ij ∗ (1 − Aij ) +
˜
+ α2 ∗ DIST 2ij ∗ Aij + α3 ∗ DIST 3ij ∗ (1 − Aij ) + α3 ∗ DIST 3ij ∗ Aij +
˜ ˜
˜ ∗ ST REN GT Hij ∗ Aij + Aij + ηi + ij (6)
+ β ∗ ST REN GT Hij ∗ (1 − Aij ) + β
We find that distance effects are concentrated on direct friends and we cannot
reject that they are equal in both treatments. Anonymity leads to less giving
across all friends and treatments. In decision T = 1 strength matters only in the
non-anonymous treatment.
The results for payrate T = 1 are consistent with the hypothesis that our
distance measure picks up directed altruism while the strength measure correlates
with effort trust which increases monotonically with the strength of a link.
5.6 Visualizing Types
A disadvantage of the regression analysis so far is that we do not extract the
variable of interest, namely the weight sij on the other agent’s utility, from the
data.
In order to visualize the distribution of types we estimate the sij by specifying a
CES utility function. In particular we assume that v(·) has the following functional
form:
v(x) = xρ (7)
We then estimate ρi and sij from the 15 decisions of each allocator in the anony-
mous and non-anonymous cases. The distributions of sij are shown in figures 2
and 3.
It is noteworthy that just as in Andreoni and Miller (2002) we find that about 50
percent of the sample concentrated around perfect altruists (s = 1 ) and perfectly
2
selfish individuals (s = 1).
10
11. References
Andreoni, J., and J. Miller (2002): “Giving According to GARP: An Exper-
iment on the Consistency of Preferences for Altruism,” Econometrica, 70.
Berg, J., J. Dickhaut, and K. McCabe (1995): “Trust, Reciprocity and
Social History,” Games and Economic Behavior, 10, 122–142.
Glaeser, E. L., D. Laibson, J. A. Scheinkman, and C. L. Soutter (1999):
“What is Social Capital? The Determinants of Trust and Trustworthiness,”
Working paper 7216, NBER.
Granovetter, M. (1973): “The Strength of Weak Ties,” American Journal of
Sociology, 78, 1360–1380.
Watts, D. J., and S. H. Strogatz (1998): “Collective Dynamics of ’Small-
World’ Networks,” Nature, 393, 440–442.
11
12. Table 1: Basic social network regression for three pay rates (token worth T=1 to
T=3 points to allocator) - Player 2 FINDS OUT the identity of player 1
Variable (T=1) (T=2) (T=3)
-3.895∗∗ -2.805∗∗ -2.920∗∗
DIST1
(0.585) (0.494) (0.787)
-1.627∗∗ -0.826†
DIST2 -0.247
(0.560) (0.470) (0.736)
DIST3 -0.880 -0.389 -0.676
(0.543) (0.456) (0.715)
22.576∗∗ 29.111∗∗ 29.523∗∗
Intercept
(0.298) (0.248) (0.380)
N 670 613 448
R2 0.081 0.066 0.042
Significance levels: † : 10% ∗ : 5% ∗∗ : 1%
The dependent variable is TOKENSHELD; standard errors are shown in paran-
thesis.
12
13. Table 2: Basic social network regression for three pay rates (token worth T=1 to
T=3 points to allocator) - Player 2 DOES NOT FIND OUT the identity of player
1
Variable (T=1) (T=2) (T=3)
-2.587∗∗ -3.118∗∗ -1.824∗
DIST1
(0.755) (0.684) (0.922)
DIST2 -0.696 -0.400 0.052
(0.746) (0.681) (0.881)
-1.288†
DIST3 0.051 -0.942
(0.713) (0.657) (0.854)
22.825∗∗ 30.704∗∗ 30.875∗∗
Intercept
(0.389) (0.349) (0.457)
N 530 464 311
R2 0.033 0.06 0.021
Significance levels: † : 10% ∗ : 5% ∗∗ : 1%
The dependent variable is TOKENSHELD; standard errors are shown in paran-
thesis.
13
14. Table 3: Basic social network regression for three pay rates (token worth T=1 to
T=3 points to allocator) differentiated by gender (M=player 1 is male,F=player 1
is female)- Player 2 DOES NOT FIND OUT the identity of player 1
Variable (T=1,M) (T=1,F) (T=2,M) (T=2,F) (T=3,M) (T=3,F)
-2.861∗ -2.311∗∗ -3.861∗∗ -2.374∗∗ -4.645∗∗
DIST1 0.947
(1.274) (0.839) (1.109) (0.839) (1.404) (1.172)
DIST2 -1.799 0.317 -0.129 -0.623 1.625 -1.296
(1.297) (0.806) (1.142) (0.809) (1.453) (1.046)
DIST3 -0.415 0.467 -1.408 -1.167 -0.838 -1.201
(1.255) (0.761) (1.118) (0.772) (1.361) (1.041)
21.109∗∗ 24.294∗∗ 29.591∗∗ 31.597∗∗ 28.896∗∗ 32.490∗∗
Intercept
(0.682) (0.416) (0.600) (0.408) (0.745) (0.548)
N 246 284 208 256 135 176
R2 0.031 0.052 0.08 0.043 0.028 0.112
Significance levels: † : 10% ∗ : 5% ∗∗ : 1%
The dependent variable is TOKENSHELD; standard errors are shown in paranthesis.
14
15. Figure 1: Distribution of STRENGTH variable
20
15
Density
105
0
0 .2 .4 .6 .8 1
STRENGTH
15
16. Table 4: Basic social network regression for three pay rates (token worth T=1 to
T=3 points to allocator) including network strength - Player 2 FINDS OUT the
identity of player 1
Variable (T=1) (T=2) (T=3)
-3.329∗∗ -2.164∗∗
DIST1 -1.528
(0.864) (0.740) (1.168)
DIST1*STRENGTH 2.900 -0.384 1.542
(3.833) (3.227) (4.689)
DIST2 -0.305 -0.252 1.541
(0.778) (0.652) (0.991)
DIST3 -0.656 -0.290 -0.384
(0.548) (0.462) (0.716)
-5.990∗ -8.101∗∗
STRENGTH -2.680
(2.478) (2.164) (3.094)
22.673∗∗ 29.148∗∗ 29.646∗∗
Intercept
(0.300) (0.251) (0.381)
N 670 613 448
R2 0.093 0.072 0.069
Significance levels: † : 10% ∗ : 5% ∗∗ : 1%
The dependent variable is TOKENSHELD; standard errors are shown in paran-
thesis.
16
17. Table 5: Basic social network regression for three pay rates (token worth T=1 to
T=3 points to allocator) including network strength - Player 2 DOES NOT FIND
OUT the identity of player 1
Variable (T=1) (T=2) (T=3)
-2.745∗ -2.578∗∗
DIST1 0.812
(1.078) (0.992) (1.339)
DIST1*STRENGTH 3.222 3.584 -8.832
(4.981) (4.440) (5.527)
DIST2 -0.131 1.010 0.775
(1.045) (0.940) (1.177)
DIST3 0.141 -1.085 -0.834
(0.724) (0.660) (0.851)
-6.513∗
STRENGTH -2.622 -3.203
(3.349) (3.046) (3.488)
22.876∗∗ 30.830∗∗ 30.929∗∗
Intercept
(0.395) (0.353) (0.457)
N 530 464 311
R2 0.034 0.074 0.056
Significance levels: † : 10% ∗ : 5% ∗∗ : 1%
The dependent variable is TOKENSHELD; standard errors are shown in paran-
thesis.
17
18. Table 6: Basic social network regression for three pay rates (token worth T=1 to
T=3 points to allocator) including network strength across anonymous and non-
anonymous treatments
Variable (T=1) (T=2) (T=3)
-2.636∗∗ -2.198∗∗
DIST1*NONANONYMOUS -1.517
(0.767) (0.740) (1.076)
-2.316∗∗ -2.341∗∗
DIST1*ANONYMOUS 0.152
(0.829) (0.810) (1.213)
DIST2*NONANONYMOUS -0.460 0.001 0.977
(0.778) (0.728) (1.049)
2.319†
DIST2*ANONYMOUS -0.687 0.226
(0.879) (0.841) (1.247)
DIST3*NONANONYMOUS -0.619 -0.277 -0.509
(0.612) (0.576) (0.832)
DIST3*ANONYMOUS 0.038 -0.244 -0.156
(0.694) (0.669) (1.002)
-5.133∗ -3.405† -6.779∗
STRENGTH*NONANONYMOUS
(2.099) (2.028) (2.806)
-6.607∗
STRENGTH*ANONYMOUS -1.079 -2.508
(2.278) (2.206) (3.160)
1.495∗∗ 2.633∗∗ 2.429∗∗
ANONYMOUS
(0.499) (0.474) (0.701)
22.062∗∗ 28.607∗∗ 29.096∗∗
Intercept
(0.336) (0.314) (0.449)
N 1200 1077 759
R2 0.074 0.105 0.086
Significance levels: † : 10% ∗ : 5% ∗∗ : 1%
The dependent variable is TOKENSHELD; standard errors are shown in paran-
thesis.
18
19. Figure 2: Distribution of types sij under anonymous interaction between allocator
and recipient
Preference−based social capital
1
.8
.6
s
.4
.2
0
0 50 100 150
ALLOCATOR INDEX
Distance==1 Distance==2
Distance>2
19
20. Figure 3: Distribution of types sij under non-anonymous interaction between al-
locator and recipient
Preference−based plus cooperative social capital
1
.8
.6
s
.4
.2
0
0 50 100 150
ALLOCATOR INDEX
Distance==1 Distance==2
Distance>2
20