R. Zafarani, M. A. Abbasi, and H. Liu, Social Media Mining: An Introduction, Cambridge University Press, 2014.
Free book and slides at http://socialmediamining.info/
Social Media Mining - Chapter 8 (Influence and Homophily)SocialMediaMining
R. Zafarani, M. A. Abbasi, and H. Liu, Social Media Mining: An Introduction, Cambridge University Press, 2014.
Free book and slides at http://socialmediamining.info/
R. Zafarani, M. A. Abbasi, and H. Liu, Social Media Mining: An Introduction, Cambridge University Press, 2014.
Free book and slides at http://socialmediamining.info/
Social Media Mining - Chapter 9 (Recommendation in Social Media)SocialMediaMining
R. Zafarani, M. A. Abbasi, and H. Liu, Social Media Mining: An Introduction, Cambridge University Press, 2014.
Free book and slides at http://socialmediamining.info/
R. Zafarani, M. A. Abbasi, and H. Liu, Social Media Mining: An Introduction, Cambridge University Press, 2014.
Free book and slides at http://socialmediamining.info/
The growth of social media over the last decade has revolutionized the way individuals interact and industries conduct business. Individuals produce data at an unprecedented rate by interacting, sharing, and consuming content through social media. Understanding and processing this new type of data to glean actionable patterns presents challenges and opportunities for interdisciplinary research, novel algorithms, and tool development. Social Media Mining integrates social media, social network analysis, and data mining to provide a convenient and coherent platform for students, practitioners, researchers, and project managers to understand the basics and potentials of social media mining. It introduces the unique problems arising from social media data and presents fundamental concepts, emerging issues, and effective algorithms for network analysis and data mining. Suitable for use in advanced undergraduate and beginning graduate courses as well as professional short courses, the text contains exercises of different degrees of difficulty that improve understanding and help apply concepts, principles, and methods in various scenarios of social media mining.
Details at: http://dmml.asu.edu/smm/
Network measures used in social network analysis Dragan Gasevic
Definition of measures (diameter, density, degree centrality, in-degree centrality, out-degree centrality, betweenness centrality, closeness centrality) used in social network analysis. The presentation is prepared by Dragan Gasevic for DALMOOC.
Social Network Analysis: What It Is, Why We Should Care, and What We Can Lear...Xiaohan Zeng
The advent of the social networks has completely changed our daily life. The deluge of data collected on Social Network Services (SNS) and recent developments in complex network theory have enabled many marvelous predictive analysis, which tells us many amazing stories.
Why do we often feel that "the world is so small?" Is the six-degree separation purely imagination or based on mathematical insights? Why are there just a few rockstars who enjoy extreme popularity while most of us stay unknown to the world? When science meets coffee shop knowledge, things are bound to be intriguing.
I will first briefly describe what social networks are, in the mathematical sense. Then I will introduce some ways to extract characteristics of networks, and how these analyses can explain many anecdotes in our life. Finally, I'll show an example of what we can learn from social network analysis, based on data from Groupon.
Brief tutorial on Influence and Homophily in social networks. Key concepts. How to distinguish influence from correlation. Information diffusion processes. Influence Maximization Problem
and viral marketing.
Quick introduction to community detection.
Structural properties of real world networks, definition of "communities", fundamental techniques and evaluation measures.
1. Basics of Social Networks
2. Real-world problem
3. How to construct graph from real-world problem?
4. What graph theory problem getting from real-world problem?
5. Graph type of Social Networks
6. Special properties in social graph
7. How to find communities and groups in social networks? (Algorithms)
8. How to interpret graph solution back to real-world problem?
UNIT I- INTRODUCTION
Introduction to Web - Limitations of current Web – Development of Semantic Web – Emergence of the Social Web – Statistical Properties of Social Networks -Network analysis - Development of Social Network Analysis - Key concepts and measures in network analysis - Discussion networks -Blogs and online communities - Web-based networks
Network centrality measures and their effectivenessemapesce
Often centrality measures are used in social network analysis. The goal of this presentation is to explain how different centrality works and how they can be compared.
Centrality measures covered: degree, closeness, harmonic, Lin's index, betweenness, eigenvector, seeley's index, pagerank, hits, SALSA
Social network analysis [SNA] is the mapping and measuring of relationships and flows between people, groups, organizations, computers, URLs, and other connected information/knowledge entities. SNA provides both a visual and a mathematical analysis of human relationships.
UNIT II MODELING AND VISUALIZATION
Visualizing Online Social Networks - A Taxonomy of Visualizations - Graph Representation -
Centrality- Clustering - Node-Edge Diagrams - Visualizing Social Networks with Matrix-Based
Representations- Node-Link Diagrams - Hybrid Representations - Modelling and aggregating
social network data – Random Walks and their Applications –Use of Hadoop and Map Reduce -
Ontological representation of social individuals and relationships.
Web Scraping and Data Extraction ServicePromptCloud
Learn more about Web Scraping and data extraction services. We have covered various points about scraping, extraction and converting un-structured data to structured format. For more info visit http://promptcloud.com/
Data Wranglers DC December meetup: http://www.meetup.com/Data-Wranglers-DC/events/151563622/
There's a lot of data sitting on websites just waiting to be combined with data you have sitting on your servers. During this talk, Robert Dempsey will show you how to create a dataset using Python by scraping websites for the data you want.
Some elementary principles and procedures for Facebook data-mining. Combination of Graph API and OpenRefine software for parsing the JSON output. Two beer brands are analyze with respect to their active fans and engagement.
The second part is dedicated to the Interest positioning (as pioneered by PerfectCrowd) technique and what can OutWit Hub do as a substitute for more sophisticated techniques & apps.
Demonstrating SimpleXML in PHP5 by utilizing it to grab an XML weather feed from the National Weather Service and display the data, marked up via CSS, on a live site.
First of three presentations on journalists and the Social Web. Presented at seminar on this topic in Oslo in October 2008. Journalists and the semantic web. This is part one of my keynote presentation to the 'Journalists and Social Web' seminar held in Oslo on Oct 25th, 2008. This seminar was organised by journalisten.no, www.journalism.co.uk and Norwegian journalist Kristine Low.
This lecture gives various definitions of Data Mining. It also gives why Data Mining is required. Various examples on Classification , Cluster and Association rules are given.
Social Media Mining - Chapter 10 (Behavior Analytics)SocialMediaMining
R. Zafarani, M. A. Abbasi, and H. Liu, Social Media Mining: An Introduction, Cambridge University Press, 2014.
Free book and slides at http://socialmediamining.info/
Anomaly detection (or Outlier analysis) is the identification of items, events or observations which do not conform to an expected pattern or other items in a dataset. It is used is applications such as intrusion detection, fraud detection, fault detection and monitoring processes in various domains including energy, healthcare and finance. In this talk, we will introduce anomaly detection and discuss the various analytical and machine learning techniques used in in this field. Through a case study, we will discuss how anomaly detection techniques could be applied to energy data sets. We will also demonstrate, using R and Apache Spark, an application to help reinforce concepts in anomaly detection and best practices in analyzing and reviewing results.
Anomaly detection: Core Techniques and Advances in Big Data and Deep LearningQuantUniversity
Anomaly detection (or Outlier analysis) is the identification of items, events or observations which do not conform to an expected pattern or other items in a dataset. It is used is applications such as intrusion detection, fraud detection, fault detection and monitoring processes in various domains including energy, healthcare and finance.
Using PySpark to Scale Markov Decision Problems for Policy ExplorationDatabricks
Finding policies that lead to optimal outcomes for an organization are some of the most difficult challenges facing decision makers within an organization. The reason for it is the fact that policies are not made in a world with perfect information and markets in equilibrium. These are complex systems where the behavior of entities within the system are dynamic and generally uncertain. Reinforcement Learning (RL) has gained popularity for modeling complex behavior to identify optimal strategy. RL maps states or situations to actions in order to maximize some result or reward. The Markov Decision Process (MDP) is a core component of the RL methodology. The Markov chain is a probabilistic model that uses the current state to predict the next state.
This presentation discusses using PySpark to scale an MDP example problem. When simulating complex systems, it can be very challenging to scale to large numbers of agents, due to the amount of processing that needs to be performed in memory as each agent goes through a permutation. PySpark allows us to leverage Spark for the distributed data processing and Python to define the states and actions of the agents.
Dowhy: An end-to-end library for causal inferenceAmit Sharma
In addition to efficient statistical estimators of a treatment's effect, successful application of causal inference requires specifying assumptions about the mechanisms underlying observed data and testing whether they are valid, and to what extent. However, most libraries for causal inference focus only on the task of providing powerful statistical estimators. We describe DoWhy, an open-source Python library that is built with causal assumptions as its first-class citizens, based on the formal framework of causal graphs to specify and test causal assumptions. DoWhy presents an API for the four steps common to any causal analysis---1) modeling the data using a causal graph and structural assumptions, 2) identifying whether the desired effect is estimable under the causal model, 3) estimating the effect using statistical estimators, and finally 4) refuting the obtained estimate through robustness checks and sensitivity analyses. In particular, DoWhy implements a number of robustness checks including placebo tests, bootstrap tests, and tests for unoberved confounding. DoWhy is an extensible library that supports interoperability with other implementations, such as EconML and CausalML for the the estimation step.
Predictions of links in graphs based on content and information propagations.
Lecture for the M. Sc. Data Science, Sapienza University of Rome, Spring 2016.
Anomaly detection (or Outlier analysis) is the identification of items, events or observations which do not conform to an expected pattern or other items in a dataset. It is used is applications such as intrusion detection, fraud detection, fault detection and monitoring processes in various domains including energy, healthcare and finance.
In this workshop, we will discuss the core techniques in anomaly detection and discuss advances in Deep Learning in this field.
Through case studies, we will discuss how anomaly detection techniques could be applied to various business problems. We will also demonstrate examples using R, Python, Keras and Tensorflow applications to help reinforce concepts in anomaly detection and best practices in analyzing and reviewing results.
How can we rely upon Social Network Measures? Agent-base modelling as the nex...Bruce Edmonds
All social network analysis of observed systems rely on assumptions, for example: how a link is defined is the right one, how the resulting network is analysed actually corresponds with our conclusions about it, etc. In other words the representation+analysis is a *model* of what we observe. Any model is fallible and thus needs independent validation, but this is rarely done in social network analysis due to the cost. Indeed, the only check is often that of face validity by the same person who collected the data and analysed it!
This lack of established validity is somewhat hidden by the divide within the field of social networks between the "formalists" who prove abstract properties of networks and those who apply its techniques to observed cases (who I will call "practioners"). The formalists might propose SN measures and prove their properties, but do not say anything about their applicability to any observed system. The practioners often proceed as if the measures will "work" on their networks - e.g. that a measure of centrality will tend to highlight the most influential actors.
However, agent-based models (ABM) might offer a potential solution to this. If a measure (or other SN technique) does not work with a plausible ABM of the phenomena (where we can actually check this), then we certainly can not rely on it for a similar model of observed phenomena. Some results and examples of this are given. Rather, it might be that SNA might be more reliable as a secondary analysis -- a model of a complex ABM of observed phenomena.
Operation “Blue Star” is the only event in the history of Independent India where the state went into war with its own people. Even after about 40 years it is not clear if it was culmination of states anger over people of the region, a political game of power or start of dictatorial chapter in the democratic setup.
The people of Punjab felt alienated from main stream due to denial of their just demands during a long democratic struggle since independence. As it happen all over the word, it led to militant struggle with great loss of lives of military, police and civilian personnel. Killing of Indira Gandhi and massacre of innocent Sikhs in Delhi and other India cities was also associated with this movement.
A workshop hosted by the South African Journal of Science aimed at postgraduate students and early career researchers with little or no experience in writing and publishing journal articles.
Biological screening of herbal drugs: Introduction and Need for
Phyto-Pharmacological Screening, New Strategies for evaluating
Natural Products, In vitro evaluation techniques for Antioxidants, Antimicrobial and Anticancer drugs. In vivo evaluation techniques
for Anti-inflammatory, Antiulcer, Anticancer, Wound healing, Antidiabetic, Hepatoprotective, Cardio protective, Diuretics and
Antifertility, Toxicity studies as per OECD guidelines
June 3, 2024 Anti-Semitism Letter Sent to MIT President Kornbluth and MIT Cor...Levi Shapiro
Letter from the Congress of the United States regarding Anti-Semitism sent June 3rd to MIT President Sally Kornbluth, MIT Corp Chair, Mark Gorenberg
Dear Dr. Kornbluth and Mr. Gorenberg,
The US House of Representatives is deeply concerned by ongoing and pervasive acts of antisemitic
harassment and intimidation at the Massachusetts Institute of Technology (MIT). Failing to act decisively to ensure a safe learning environment for all students would be a grave dereliction of your responsibilities as President of MIT and Chair of the MIT Corporation.
This Congress will not stand idly by and allow an environment hostile to Jewish students to persist. The House believes that your institution is in violation of Title VI of the Civil Rights Act, and the inability or
unwillingness to rectify this violation through action requires accountability.
Postsecondary education is a unique opportunity for students to learn and have their ideas and beliefs challenged. However, universities receiving hundreds of millions of federal funds annually have denied
students that opportunity and have been hijacked to become venues for the promotion of terrorism, antisemitic harassment and intimidation, unlawful encampments, and in some cases, assaults and riots.
The House of Representatives will not countenance the use of federal funds to indoctrinate students into hateful, antisemitic, anti-American supporters of terrorism. Investigations into campus antisemitism by the Committee on Education and the Workforce and the Committee on Ways and Means have been expanded into a Congress-wide probe across all relevant jurisdictions to address this national crisis. The undersigned Committees will conduct oversight into the use of federal funds at MIT and its learning environment under authorities granted to each Committee.
• The Committee on Education and the Workforce has been investigating your institution since December 7, 2023. The Committee has broad jurisdiction over postsecondary education, including its compliance with Title VI of the Civil Rights Act, campus safety concerns over disruptions to the learning environment, and the awarding of federal student aid under the Higher Education Act.
• The Committee on Oversight and Accountability is investigating the sources of funding and other support flowing to groups espousing pro-Hamas propaganda and engaged in antisemitic harassment and intimidation of students. The Committee on Oversight and Accountability is the principal oversight committee of the US House of Representatives and has broad authority to investigate “any matter” at “any time” under House Rule X.
• The Committee on Ways and Means has been investigating several universities since November 15, 2023, when the Committee held a hearing entitled From Ivory Towers to Dark Corners: Investigating the Nexus Between Antisemitism, Tax-Exempt Universities, and Terror Financing. The Committee followed the hearing with letters to those institutions on January 10, 202
How to Make a Field invisible in Odoo 17Celine George
It is possible to hide or invisible some fields in odoo. Commonly using “invisible” attribute in the field definition to invisible the fields. This slide will show how to make a field invisible in odoo 17.
2024.06.01 Introducing a competency framework for languag learning materials ...Sandy Millin
http://sandymillin.wordpress.com/iateflwebinar2024
Published classroom materials form the basis of syllabuses, drive teacher professional development, and have a potentially huge influence on learners, teachers and education systems. All teachers also create their own materials, whether a few sentences on a blackboard, a highly-structured fully-realised online course, or anything in between. Despite this, the knowledge and skills needed to create effective language learning materials are rarely part of teacher training, and are mostly learnt by trial and error.
Knowledge and skills frameworks, generally called competency frameworks, for ELT teachers, trainers and managers have existed for a few years now. However, until I created one for my MA dissertation, there wasn’t one drawing together what we need to know and do to be able to effectively produce language learning materials.
This webinar will introduce you to my framework, highlighting the key competencies I identified from my research. It will also show how anybody involved in language teaching (any language, not just English!), teacher training, managing schools or developing language learning materials can benefit from using the framework.
A Strategic Approach: GenAI in EducationPeter Windle
Artificial Intelligence (AI) technologies such as Generative AI, Image Generators and Large Language Models have had a dramatic impact on teaching, learning and assessment over the past 18 months. The most immediate threat AI posed was to Academic Integrity with Higher Education Institutes (HEIs) focusing their efforts on combating the use of GenAI in assessment. Guidelines were developed for staff and students, policies put in place too. Innovative educators have forged paths in the use of Generative AI for teaching, learning and assessments leading to pockets of transformation springing up across HEIs, often with little or no top-down guidance, support or direction.
This Gasta posits a strategic approach to integrating AI into HEIs to prepare staff, students and the curriculum for an evolving world and workplace. We will highlight the advantages of working with these technologies beyond the realm of teaching, learning and assessment by considering prompt engineering skills, industry impact, curriculum changes, and the need for staff upskilling. In contrast, not engaging strategically with Generative AI poses risks, including falling behind peers, missed opportunities and failing to ensure our graduates remain employable. The rapid evolution of AI technologies necessitates a proactive and strategic approach if we are to remain relevant.
This slide is special for master students (MIBS & MIFB) in UUM. Also useful for readers who are interested in the topic of contemporary Islamic banking.
Unit 8 - Information and Communication Technology (Paper I).pdfThiyagu K
This slides describes the basic concepts of ICT, basics of Email, Emerging Technology and Digital Initiatives in Education. This presentations aligns with the UGC Paper I syllabus.
2. 2Social Media Mining Measures and Metrics 2Social Media Mining Network Measureshttp://socialmediamining.info/
Dear instructors/users of these slides:
Please feel free to include these slides in your own
material, or modify them as you see fit. If you decide
to incorporate these slides into your presentations,
please include the following note:
R. Zafarani, M. A. Abbasi, and H. Liu, Social Media Mining:
An Introduction, Cambridge University Press, 2014.
Free book and slides at http://socialmediamining.info/
or include a link to the website:
http://socialmediamining.info/
3. 3Social Media Mining Measures and Metrics 3Social Media Mining Network Measureshttp://socialmediamining.info/
Klout
It is difficult
to measure
influence!
4. 4Social Media Mining Measures and Metrics 4Social Media Mining Network Measureshttp://socialmediamining.info/
Why Do We Need Measures?
• Who are the central figures (influential individuals) in
the network?
– Centrality
• What interaction patterns are common in friends?
– Reciprocity and Transitivity
– Balance and Status
• Who are the like-minded users and how can we find
these similar individuals?
– Similarity
• To answer these and similar questions, one first
needs to define measures for quantifying centrality,
level of interactions, and similarity, among others.
5. 5Social Media Mining Measures and Metrics 5Social Media Mining Network Measureshttp://socialmediamining.info/
Centrality defines how important a node is within a network
Centrality
6. 6Social Media Mining Measures and Metrics 6Social Media Mining Network Measureshttp://socialmediamining.info/
Centrality in terms of those
who you are connected to
7. 7Social Media Mining Measures and Metrics 7Social Media Mining Network Measureshttp://socialmediamining.info/
Degree Centrality
• Degree centrality: ranks nodes with more
connections higher in terms of centrality
• 𝑑𝑖 is the degree (number of friends) for node 𝑣𝑖
– i.e., the number of length-1 paths (can be generalized)
In this graph, degree centrality
for node 𝑣1 is 𝑑1=8 and for all
others is 𝑑𝑗 = 1, 𝑗 ≠ 1
8. 8Social Media Mining Measures and Metrics 8Social Media Mining Network Measureshttp://socialmediamining.info/
Degree Centrality in Directed Graphs
• In directed graphs, we can either use the in-
degree, the out-degree, or the combination as
the degree centrality value:
• In practice, mostly in-degree is used.
𝑑𝑖
𝑜𝑢𝑡
is the number of outgoing links for node 𝑣𝑖
9. 9Social Media Mining Measures and Metrics 9Social Media Mining Network Measureshttp://socialmediamining.info/
Normalized Degree Centrality
• Normalized by the maximum
possible degree
• Normalized by the maximum
degree
• Normalized by the degree sum
10. 10Social Media Mining Measures and Metrics 10Social Media Mining Network Measureshttp://socialmediamining.info/
Degree Centrality (Directed Graph)Example
Normalized by the maximum possible degree
E
B
A
C F
D
G
Node In-Degree Out-Degree Centrality Rank
A 1 3 1/2 1
B 1 2 1/3 3
C 2 3 1/2 1
D 3 1 1/6 5
E 2 1 1/6 5
F 2 2 1/3 3
G 2 1 1/6 5
11. 11Social Media Mining Measures and Metrics 11Social Media Mining Network Measureshttp://socialmediamining.info/
Degree Centrality (undirected Graph) Example
Node Degree Centrality Rank
A 4 2/3 2
B 3 1/2 5
C 5 5/6 1
D 4 2/3 2
E 3 1/2 5
F 4 2/3 2
G 3 1/2 5
E
B
A
C F
D
G
12. 12Social Media Mining Measures and Metrics 12Social Media Mining Network Measureshttp://socialmediamining.info/
Eigenvector Centrality
• Having more friends does not by
itself guarantee that someone is
more important
– Having more important friends
provides a stronger signal Phillip Bonacich
• Eigenvector centrality generalizes degree
centrality by incorporating the importance of
the neighbors (undirected)
• For directed graphs, we can use incoming or
outgoing edges
13. 13Social Media Mining Measures and Metrics 13Social Media Mining Network Measureshttp://socialmediamining.info/
Formulation
• Let’s assume the eigenvector centrality of a node is
𝑐 𝑒 𝑣𝑖 (unknown)
• We would like 𝑐 𝑒 𝑣𝑖 to be higher when important
neighbors (node 𝑣𝑗 with higher 𝑐 𝑒 𝑣𝑗 ) point to us
– Incoming or outgoing neighbors?
– For incoming neighbors 𝐴𝑗,𝑖 = 1
• We can assume that 𝑣𝑖’s centrality is the summation
of its neighbors’ centralities
• Is this summation bounded?
• We have to normalize!
: some fixed constant
14. 14Social Media Mining Measures and Metrics 14Social Media Mining Network Measureshttp://socialmediamining.info/
• Let
• This means that 𝑪 𝒆 is an eigenvector of
adjacency matrix 𝐴 𝑇
(or 𝐴 when undirected) and
is the corresponding eigenvalue
• Which eigenvalue-eigenvector pair should we
choose?
Eigenvector Centrality (Matrix Formulation)
15. 15Social Media Mining Measures and Metrics 15Social Media Mining Network Measureshttp://socialmediamining.info/
Finding the eigenvalue by finding a fixed point…
• Start from an initial guess 𝐶𝑒(0) (e.g., all
centralities are 1) and iterative 𝑡 times
• We can write 𝐶𝑒(0) as a linear combination of
eigenvectors 𝑣𝑖’s of the 𝐴 𝑇
• Substituting this, we get
𝜆1 is the largest
eigenvalue
16. 16Social Media Mining Measures and Metrics 16Social Media Mining Network Measureshttp://socialmediamining.info/
Finding the eigenvalue by finding a fixed point…
• As 𝑡 grows, we will have in the limit
• Or equivalently
• If we start with an all positive 𝐶𝑒(0) all 𝐶𝑒(𝑡)’s
will be positive (why?)
– All the centrality values would be positive
– We need an eigenvalue-eigenvector pair that
guarantees all centralities have the same sign
• E.g., for comparison purposes
17. 17Social Media Mining Measures and Metrics 17Social Media Mining Network Measureshttp://socialmediamining.info/
Eigenvector Centrality, cont.
So, to compute eigenvector centrality of 𝐴,
1. We compute the eigenvalues of A
2. Select the largest eigenvalue
3. The corresponding eigenvector of is 𝐂 𝐞.
4. Based on the Perron-Frobenius theorem, all the
components of 𝐂 𝐞will be positive
5. The components of 𝐂 𝐞 are the eigenvector centralities
for the graph.
18. 18Social Media Mining Measures and Metrics 18Social Media Mining Network Measureshttp://socialmediamining.info/
Eigenvector Centrality: Example 1
Eigenvalues are
Largest Eigenvalue
Corresponding eigenvector (assuming 𝐂 𝐞 has norm 1)
19. 19Social Media Mining Measures and Metrics 19Social Media Mining Network Measureshttp://socialmediamining.info/
Eigenvector Centrality: Example 2
= (2.68, -1.74, -1.27, 0.33, 0.00)
Eigenvalues Vector
max = 2.68
20. 20Social Media Mining Measures and Metrics 20Social Media Mining Network Measureshttp://socialmediamining.info/
Katz Centrality
• A major problem with eigenvector
centrality arises when it deals with
directed graphs
• Centrality only passes over outgoing
edges and in special cases such as
when a node is in a directed acyclic
graph centrality becomes zero
– The node can have many edge
connected to it
Eigenvector Centrality
Elihu Katz
• To resolve this problem we add bias term to the centrality
values for all nodes
21. 21Social Media Mining Measures and Metrics 21Social Media Mining Network Measureshttp://socialmediamining.info/
Katz Centrality, cont.
Bias termControlling term
Rewriting equation in a vector form
vector of all 1’s
Katzcentrality:
22. 22Social Media Mining Measures and Metrics 22Social Media Mining Network Measureshttp://socialmediamining.info/
Katz Centrality, cont.
• When α=0, the eigenvector centrality is removed and
all nodes get the same centrality value 𝛽
– As 𝛼 gets larger the effect of 𝛽 is reduced
• For the matrix (𝐼 − 𝛼𝐴 𝑇) to be invertible, we must have
– 𝑑𝑒𝑡 𝐼 − 𝛼𝐴 𝑇 ≠ 0
– By rearranging we get 𝑑𝑒𝑡 AT − 𝛼−1
𝐼 = 0
– This is basically the characteristic equation,
– The characteristic equation first becomes zero
when the largest eigenvalue equals α-1
The largest eigenvalue
is easier to compute
(power method)
In practice we select 𝜶 < 𝟏/𝝀, where 𝜆 is the largest eigenvalue of 𝑨 𝑻
23. 23Social Media Mining Measures and Metrics 23Social Media Mining Network Measureshttp://socialmediamining.info/
• The Eigenvalues are -1.68, -1.0, -1.0, 0.35, 3.32
• We assume α=0.25 < 1/3.32 and 𝛽 = 0.2
Katz Centrality Example
Most
important
nodes!
24. 24Social Media Mining Measures and Metrics 24Social Media Mining Network Measureshttp://socialmediamining.info/
PageRank
• Problem with Katz Centrality:
– In directed graphs, once a node becomes an authority
(high centrality), it passes all its centrality along all of its
out-links
• This is less desirable since not everyone known by
a well-known person is well-known
• Solution?
– We can divide the value of passed centrality by the
number of outgoing links, i.e., out-degree of that node
– Each connected neighbor gets a fraction of the source
node’s centrality
25. 25Social Media Mining Measures and Metrics 25Social Media Mining Network Measureshttp://socialmediamining.info/
PageRank, cont.
What if the
degree is
zero?
Similar to Katz Centrality, in practice, 𝜶 < 𝟏/𝝀, where 𝜆 is
the largest eigenvalue of 𝐴 𝑇
𝐷−1
. In undirected graphs, the
largest eigenvalue of 𝐴 𝑇
𝐷−1
is 𝝀 = 1; therefore, 𝜶 < 𝟏.
26. 26Social Media Mining Measures and Metrics 26Social Media Mining Network Measureshttp://socialmediamining.info/
PageRank Example
• We assume α=0.95 < 1 and and 𝛽 = 0.1
27. 27Social Media Mining Measures and Metrics 27Social Media Mining Network Measureshttp://socialmediamining.info/
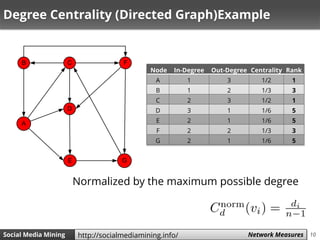
PageRank Example – Alternative Approach [Markov Chains]
Step A B C D E F G
0 1/7 1/7 1/7 1/7 1/7 1/7 1/7
1 B/2 C/3 A/3 + G A/3 + C/3 + F/2 A/3 + D C/3 + B/2 F/2 + E
0.071 0.048 0.190 0.167 0.190 0.119 0.214
Using Power
Method
”You don't understand
anything until you learn it
more than one way”
𝛼=1 and 𝛽 =0?
Marvin Minsky (1927-2016)
29. 29Social Media Mining Measures and Metrics 29Social Media Mining Network Measureshttp://socialmediamining.info/
Effect of PageRank
PageRank
Node Rank
A 7
B 6
C 1
D 4
E 3
F 5
G 2
30. 30Social Media Mining Measures and Metrics 30Social Media Mining Network Measureshttp://socialmediamining.info/
Centrality in terms of how
you connect others
(information broker)
31. 31Social Media Mining Measures and Metrics 31Social Media Mining Network Measureshttp://socialmediamining.info/
Betweenness Centrality
Another way of looking at centrality is
by considering how important nodes
are in connecting other nodes
The number of shortest paths from 𝑠 to 𝑡 that pass
through 𝑣𝑖
The number of shortest paths from vertex 𝑠 to 𝑡 – a.k.a.
information pathways
Linton Freeman
32. 32Social Media Mining Measures and Metrics 32Social Media Mining Network Measureshttp://socialmediamining.info/
Normalizing Betweenness Centrality
• In the best case, node 𝑣𝑖 is on all shortest
paths from 𝑠 to 𝑡, hence,
Therefore, the maximum value is (𝑛 − 1)(𝑛 − 2)
Betweenness centrality:
33. 33Social Media Mining Measures and Metrics 33Social Media Mining Network Measureshttp://socialmediamining.info/
Betweenness Centrality: Example 1
34. 34Social Media Mining Measures and Metrics 34Social Media Mining Network Measureshttp://socialmediamining.info/
Betweenness Centrality: Example 2
Node Betweenness Centrality Rank
A 16 + 1/2 + 1/2 1
B 7+5/2 3
C 0 7
D 5/2 5
E 1/2 + 1/2 6
F 15 + 2 1
G 0 7
H 0 7
I 7 4
35. 35Social Media Mining Measures and Metrics 35Social Media Mining Network Measureshttp://socialmediamining.info/
Computing Betweenness
• In betweenness centrality, we compute
shortest paths between all pairs of nodes to
compute the betweenness value.
• Trivial Solution:
– Use Dijkstra and run it 𝑂(𝑛) times
– We get an 𝑂(𝑛3
) solution
• Better Solution:
– Brandes Algorithm:
• 𝑂(𝑛𝑚) for unweighted graphs
• 𝑂(𝑛𝑚 + 𝑛2 log 𝑛) for weighted graphs
36. 36Social Media Mining Measures and Metrics 36Social Media Mining Network Measureshttp://socialmediamining.info/
Brandes Algorithm [2001]
𝑝𝑟𝑒𝑑(𝑠, 𝑤) is the set of predecessors of 𝑤 in the
shortest paths from 𝑠 to 𝑤.
– In the most basic scenario, 𝑤 is the immediate child of 𝑣𝑖
There exists a recurrence equation that can help
us determine 𝛿𝑠(𝑣𝑖)
37. 37Social Media Mining Measures and Metrics 37Social Media Mining Network Measureshttp://socialmediamining.info/
How to compute 𝝈 𝒔𝒕
Source: Networks, Crowds, and Markets:
Reasoning about a Highly Connected World.
By David Easley and Jon Kleinberg
Original Network
Sum of
Parents
values
BFS starting at A (i.e., 𝑠)
38. 38Social Media Mining Measures and Metrics 38Social Media Mining Network Measureshttp://socialmediamining.info/
How do you compute 𝛿𝑠(𝑣𝑖)
No shortest path starting
from 1 passes through 9
2/2 (1+0)
1/1(3/2+1)+1/1(3/2+1)
39. 39Social Media Mining Measures and Metrics 39Social Media Mining Network Measureshttp://socialmediamining.info/
Centrality in terms of how
fast you can reach others
40. 40Social Media Mining Measures and Metrics 40Social Media Mining Network Measureshttp://socialmediamining.info/
Closeness Centrality
• The intuition is that influential/central
nodes can quickly reach other nodes
• These nodes should have a smaller
average shortest path length to others
Closeness centrality:
Linton Freeman
41. 41Social Media Mining Measures and Metrics 41Social Media Mining Network Measureshttp://socialmediamining.info/
Closeness Centrality: Example 1
42. 42Social Media Mining Measures and Metrics 42Social Media Mining Network Measureshttp://socialmediamining.info/
Closeness Centrality: Example 2 (Undirected)
Node A B C D E F G H I D_Avg
Closeness
Centrality Rank
A 0 1 2 1 2 1 2 3 2 1.750 0.571 1
B 1 0 1 2 1 2 3 4 3 2.125 0.471 3
C 2 1 0 3 2 3 4 5 4 3.000 0.333 8
D 1 2 3 0 1 2 3 4 3 2.375 0.421 4
E 2 1 2 1 0 3 4 5 4 2.750 0.364 7
F 1 2 3 2 3 0 1 2 1 1.875 0.533 2
G 2 3 4 3 4 1 0 3 2 2.750 0.364 7
H 3 4 5 4 5 2 3 0 1 3.375 0.296 9
I 2 3 4 3 4 1 2 1 0 2.500 0.400 5
43. 43Social Media Mining Measures and Metrics 43Social Media Mining Network Measureshttp://socialmediamining.info/
Closeness Centrality: Example 3 (Directed)
Node A B C D E F G H I D_Avg
Closeness
Centrality Rank
A 0 1 2 3 2 2 1 3 3 2.125 0.471 1
B 3 0 1 2 1 4 4 2 3 2.500 0.400 2
C 4 5 0 7 6 3 5 1 2 4.125 0.242 9
D 1 2 3 0 3 3 2 4 5 2.875 0.348 3
E 2 3 4 1 0 4 3 5 5 3.375 0.296 6
F 1 2 3 4 3 0 2 4 4 2.875 0.348 4
G 2 3 4 5 4 1 0 5 2 3.250 0.308 5
H 4 4 5 6 5 2 4 0 1 3.875 0.258 8
I 2 3 4 5 4 1 4 5 0 3.500 0.286 7
44. 44Social Media Mining Measures and Metrics 44Social Media Mining Network Measureshttp://socialmediamining.info/
An Interesting Comparison!
Comparing three centrality values
• Generally, the 3 centrality types will be positively correlated
• When they are not (or low correlation), it usually reveals interesting information
Low
Degree
Low
Closeness
Low
Betweenness
High
Degree
Node is embedded in a
community that is far from
the rest of the network
Ego's connections are
redundant -
communication bypasses
the node
High
Closeness
Key node connected to
important/active alters
Probably multiple paths in
the network, ego is near
many people, but so are
many others
High
Betweenness
Ego's few ties are crucial
for network flow
Very rare! Ego
monopolizes the ties from
a small number of people
to many others.
This slide is modified from a slide developed by James Moody
45. 45Social Media Mining Measures and Metrics 45Social Media Mining Network Measureshttp://socialmediamining.info/
Centrality for a
group of nodes
46. 46Social Media Mining Measures and Metrics 46Social Media Mining Network Measureshttp://socialmediamining.info/
Group Centrality
• All centrality measures defined so far measure
centrality for a single node. These measures
can be generalized for a group of nodes.
• A simple approach is to replace all nodes in a
group with a super node
– The group structure is disregarded.
• Let 𝑆 denote the set of nodes in the group and
𝑉 − 𝑆 the set of outsiders
47. 47Social Media Mining Measures and Metrics 47Social Media Mining Network Measureshttp://socialmediamining.info/
I. Group Degree Centrality
– Normalization:
II. Group Betweenness Centrality
– Normalization:
Group Centrality
divide by |𝑉 − 𝑆|
divide by
48. 48Social Media Mining Measures and Metrics 48Social Media Mining Network Measureshttp://socialmediamining.info/
III. Group Closeness Centrality
– It is the average distance from non-members to
the group
• One can also utilize the maximum distance or
the average distance
Group Centrality
49. 49Social Media Mining Measures and Metrics 49Social Media Mining Network Measureshttp://socialmediamining.info/
Group Centrality Example
• Consider 𝑆 = {𝑣2, 𝑣3}
• Group degree centrality =
• Group betweenness centrality =
• Group closeness centrality =
3
3
1
50. 50Social Media Mining Measures and Metrics 50Social Media Mining Network Measureshttp://socialmediamining.info/
• Transitivity/Reciprocity
• Status/Balance
Friendship Patterns
51. 51Social Media Mining Measures and Metrics 51Social Media Mining Network Measureshttp://socialmediamining.info/
I. Transitivity and Reciprocity
52. 52Social Media Mining Measures and Metrics 52Social Media Mining Network Measureshttp://socialmediamining.info/
Transitivity
• Mathematic representation:
– For a transitive relation 𝑅:
• In a social network:
– Transitivity is when a friend of my friend is my friend
– Transitivity in a social network leads to a denser graph,
which in turn is closer to a complete graph
– We can determine how close graphs are to the
complete graph by measuring transitivity
𝒄𝑹𝒂 or 𝒂𝑹𝒄 ?
53. 53Social Media Mining Measures and Metrics 53Social Media Mining Network Measureshttp://socialmediamining.info/
[Global] Clustering Coefficient
• Clustering coefficient measures transitivity
in undirected graphs
– Count paths of length two and check whether the
third edge exists
When counting triangles, since every triangle has 6
closed paths of length 2
54. 54Social Media Mining Measures and Metrics 54Social Media Mining Network Measureshttp://socialmediamining.info/
Clustering Coefficient and Triples
Or we can rewrite it as
• Triple: an ordered set of three
nodes,
– connected by two (open triple)
edges or
– three edges (closed triple)
• A triangle can miss any of its
three edges
– A triangle has 3 Triples
𝑣𝑖 𝑣𝑗 𝑣 𝑘 and 𝑣𝑗 𝑣 𝑘 𝑣𝑖are
different triples
• The same members
• First missing edge
𝑒(𝑣 𝑘, 𝑣𝑖) and second
missing 𝑒(𝑣𝑖, 𝑣𝑗)
𝑣𝑖 𝑣𝑗 𝑣 𝑘and 𝑣 𝑘 𝑣𝑗 𝑣𝑖are
the same triple
55. 55Social Media Mining Measures and Metrics 55Social Media Mining Network Measureshttp://socialmediamining.info/
[Global] Clustering Coefficient: Example
56. 56Social Media Mining Measures and Metrics 56Social Media Mining Network Measureshttp://socialmediamining.info/
Local Clustering Coefficient
• Local clustering coefficient measures
transitivity at the node level
– Commonly employed for undirected graphs
– Computes how strongly neighbors of a node 𝑣
(nodes adjacent to 𝑣) are themselves connected
In an undirected graph, the
denominator can be rewritten as:
Provides a way to determine
structural holes Structural
Holes
57. 57Social Media Mining Measures and Metrics 57Social Media Mining Network Measureshttp://socialmediamining.info/
Local Clustering Coefficient: Example
• Thin lines depict connections to neighbors
• Dashed lines are the missing link among neighbors
• Solid lines indicate connected neighbors
– When none of neighbors are connected 𝐶 = 0
– When all neighbors are connected 𝐶 = 1
58. 58Social Media Mining Measures and Metrics 58Social Media Mining Network Measureshttp://socialmediamining.info/
Reciprocity
If you become my friend,
I’ll be yours
• Reciprocity is simplified
version of transitivity
– It considers closed loops
of length 2
• If node 𝑣 is connected to
node 𝑢,
– 𝑢 by connecting to 𝑣,
exhibits reciprocity
What
about
𝒊 = 𝒋 ?
59. 59Social Media Mining Measures and Metrics 59Social Media Mining Network Measureshttp://socialmediamining.info/
Reciprocity: Example
Reciprocal nodes: 𝑣1, 𝑣2
60. 60Social Media Mining Measures and Metrics 60Social Media Mining Network Measureshttp://socialmediamining.info/
• Measuring
consistency in
friendships
II. Balance and Status
61. 61Social Media Mining Measures and Metrics 61Social Media Mining Network Measureshttp://socialmediamining.info/
Social Balance Theory
Social balance theory
– Consistency in friend/foe relationships among individuals
– Informally, friend/foe relationships are consistent when
• In the network
– Positive edges demonstrate friendships (𝑤𝑖𝑗 = 1)
– Negative edges demonstrate being enemies (𝑤𝑖𝑗 = −1)
• Triangle of nodes 𝑖, 𝑗, and 𝑘, is balanced, if and only if
– 𝑤𝑖𝑗 denotes the value of the edge between nodes 𝑖 and 𝑗
62. 62Social Media Mining Measures and Metrics 62Social Media Mining Network Measureshttp://socialmediamining.info/
Social Balance Theory: Possible Combinations
For any cycle, if the multiplication of edge values become
positive, then the cycle is socially balanced
63. 63Social Media Mining Measures and Metrics 63Social Media Mining Network Measureshttp://socialmediamining.info/
Social Status Theory
• Status: how prestigious an individual is
ranked within a society
• Social status theory:
– How consistent individuals are in assigning status
to their neighbors
– Informally,
64. 64Social Media Mining Measures and Metrics 64Social Media Mining Network Measureshttp://socialmediamining.info/
Social Status Theory: Example
• A directed ‘+’ edge from node 𝑋 to node 𝑌
shows that 𝑌 has a higher status than 𝑋 and a
‘-’ one shows vice versa
Unstable configuration Stable configuration
65. 65Social Media Mining Measures and Metrics 65Social Media Mining Network Measureshttp://socialmediamining.info/
• Structural Equivalence
• Regular Equivalence
Similarity
How similar are two nodes in a network?
66. 66Social Media Mining Measures and Metrics 66Social Media Mining Network Measureshttp://socialmediamining.info/
Structural Equivalence
• Structural Equivalence:
– We look at the neighborhood shared by two nodes;
– The size of this shared neighborhood defines how
similar two nodes are.
• Example:
– Two brothers have in common
• sisters, mother, father, grandparents, etc.
– This shows that they are similar,
– Two random male or female individuals do not have
much in common and are dissimilar.
67. 67Social Media Mining Measures and Metrics 67Social Media Mining Network Measureshttp://socialmediamining.info/
• Vertex similarity:
• The neighborhood 𝑁(𝑣) often excludes the node itself 𝑣.
– What can go wrong?
• Connected nodes not sharing a neighbor will be assigned zero similarity
– Solution:
• We can assume nodes are included in their neighborhoods
Structural Equivalence: Definitions
Jaccard Similarity:
Cosine Similarity:
Normalize?
68. 68Social Media Mining Measures and Metrics 68Social Media Mining Network Measureshttp://socialmediamining.info/
Similarity: Example
69. 69Social Media Mining Measures and Metrics 69Social Media Mining Network Measureshttp://socialmediamining.info/
Similarity Significance
Measuring Similarity Significance: compare the
calculated similarity value with its expected value
where vertices pick their neighbors at random
• For vertices 𝑣𝑖 and 𝑣𝑗 with degrees 𝑑𝑖 and 𝑑𝑗 this
expectation is 𝑑𝑖 𝑑𝑗/𝑛
– There is a 𝑑𝑖/𝑛 chance of becoming 𝑣𝑖‘s neighbor
– 𝑣𝑗 selects 𝑑𝑗 neighbors
• We can rewrite neighborhood overlap as
70. 70Social Media Mining Measures and Metrics 70Social Media Mining Network Measureshttp://socialmediamining.info/
Normalized Similarity, cont.
What is this?
71. 71Social Media Mining Measures and Metrics 71Social Media Mining Network Measureshttp://socialmediamining.info/
Normalized Similarity, cont.
𝒏 times the Covariance between 𝑨𝒊 and 𝑨𝒋
Normalize covariance by the multiplication of Variances.
We get Pearson correlation coefficient
(range of [-1,1] )
72. 72Social Media Mining Measures and Metrics 72Social Media Mining Network Measureshttp://socialmediamining.info/
Regular Equivalence
• In regular equivalence,
– We do not look at
neighborhoods shared
between individuals, but
– How neighborhoods
themselves are similar
• Example:
– Athletes are similar not
because they know each
other in person, but since
they know similar
individuals, such as
coaches, trainers, other
players, etc.
73. 73Social Media Mining Measures and Metrics 73Social Media Mining Network Measureshttp://socialmediamining.info/
• 𝑣𝑖, 𝑣𝑗 are similar when their neighbors 𝑣 𝑘 and 𝑣𝑙
are similar
• The equation (left figure) is hard to solve since it is
self referential so we relax our definition using
the right figure
Regular Equivalence
74. 74Social Media Mining Measures and Metrics 74Social Media Mining Network Measureshttp://socialmediamining.info/
Regular Equivalence
• 𝑣𝑖 and 𝑣𝑗 are similar when 𝑣𝑗 is similar to
𝑣𝑖’s neighbors 𝑣 𝑘
• In vector format
A vertex is highly similar
to itself, we guarantee
this by adding an
identity matrix to the
equation
W𝐡𝐞𝐧 𝛼 < 𝟏/𝝀 𝒎𝒂𝒙 the matrix is invertible
75. 75Social Media Mining Measures and Metrics 75Social Media Mining Network Measureshttp://socialmediamining.info/
Regular Equivalence: Example
• Any row/column of this matrix shows the similarity to other vertices
• Vertex 1 is most similar (other than itself) to vertices 2 and 3
• Nodes 2 and 3 have the highest similarity (regular equivalence)
The largest eigenvalue of 𝐴 is 2.43
Set 𝛼 = 0.3 < 1/2.43
Editor's Notes
n – 1 is the maximum degree a node can have
2|E| = the total number of degrees,
Out-degree is used
Initial assignments are not important. In this example, \alpha = 1, \beta = 0
Normally, \alpha =0.85 and \beta = 0.15