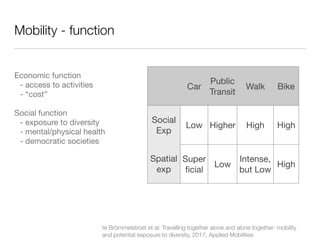
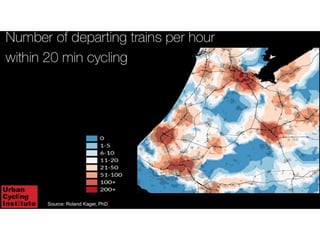
Smart city - Discourse vs Inclusion
Amsterdam, 23 October 2018

Peter Biczok,

@bicyclize

Mobility Expert
Mobilock & Bicyclize
Intertraffic 2018
Street use
Shops?
Children?
Less abled?
City use =! Mobility
City attractiveness = Accessibility
Smart Mobility?
Capacity: 4,000-6,000 ppl per lane per hour
Traffic lights, designated crossing, pro speed regulation
Street Economics: €0
Street Social value: integration, diversity - low
Intelligent mobility
Capacity: 36,000 ppl
per lane per hour
(22k+14k)
“Shared” space.
No regulation
Street Economics:
shops, restaurants
Street Social value:
integration, diversity -
high
Motor vehicle Electric vehicle Self-driving vehicle
Ticket to future: 3 Stops to Sustainable Mobility. UITP, International Association
of Public Transport, Brussels, 2003, based on Botma & Pependrecht, Traffic
operation of bicycle traffic, TU Delft, 1991
Mobility - function
Economic function 

- access to activities

- “cost” 

Social function

- exposure to diversity

- mental/physical health

- democratic societies
Car
Public
Transit
Walk Bike
Social
Exp
Low Higher High High
Spatial
exp
Super
ficial
Low
Intense,
but Low
High
te Brömmelstroet et al: Travelling together alone and alone together: mobility
and potential exposure to diversity, 2017, Applied Mobilities
Bike-Train integration
Kager and Harms: Synergies from Improved Cycling-Transit Integration:
Towards an integrated urban mobility system, 2017, OECD-ITF Working
paper
Bike-Train integration
Credit: (Kager, Harms, 2017)
Bike-Train integration
Credit: (Kager, Harms, 2017)
Station choice

Portfolio of options

Customisation
Moscow
Catchment Area:
Metro stations
accessed by foot
vs train stations by bike
Walking
catchment
area
Cycling
catchment
area
5, 10, 15 mins
QUESTIONS
PETER@MOBILOCK.NL

Smart Cities vs Intelligent cities