Download as PDF, PPTX


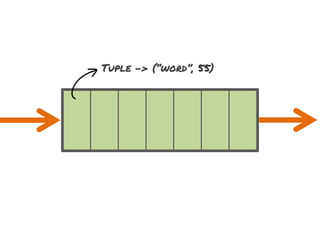


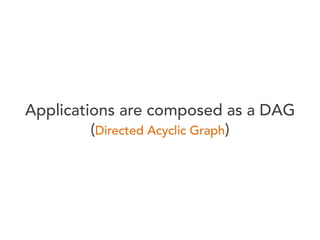

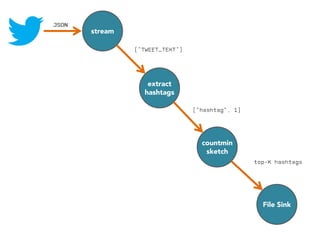
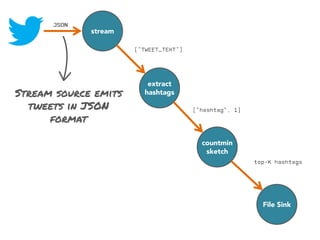
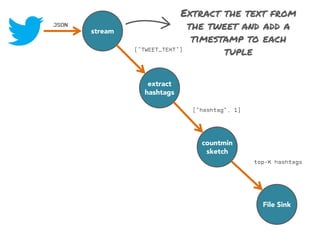
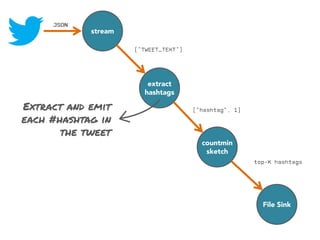
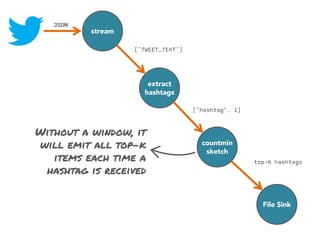
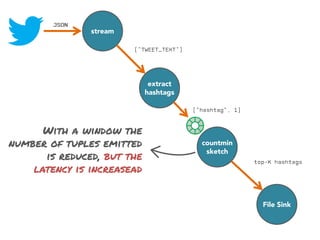
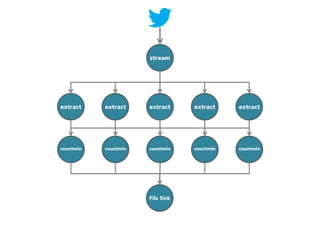
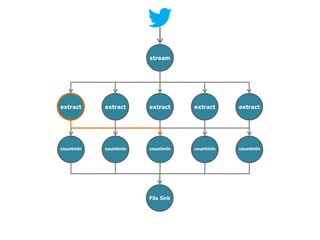
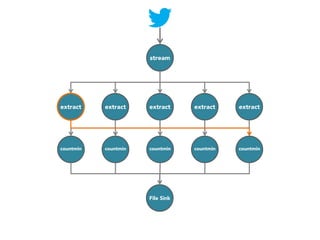
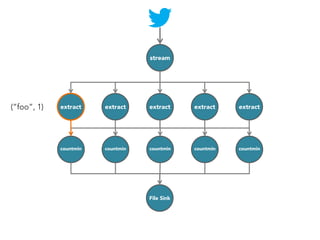
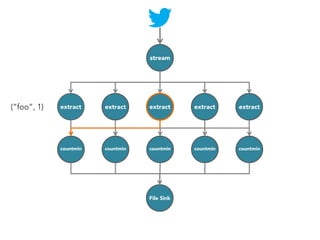
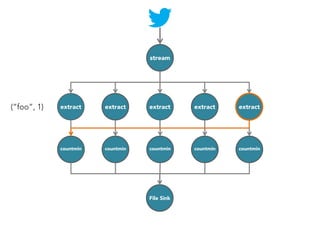
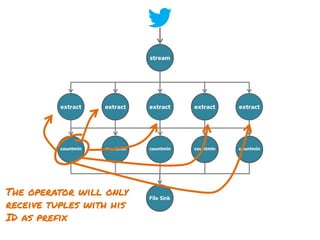
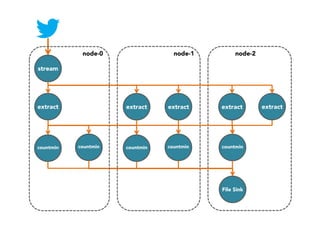
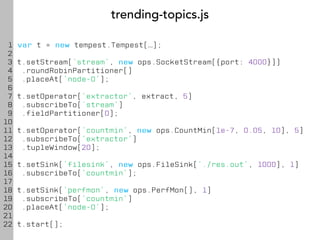
![stream
extract
hashtags
Constant time and space
approximate frequent
itemset
countmin
sketch
[Cormode and Muthukrishnan, 2005]
File Sink](https://image.slidesharecdn.com/slides-131212113520-phpapp02/85/Development-of-a-Distributed-Stream-Processing-System-39-320.jpg)


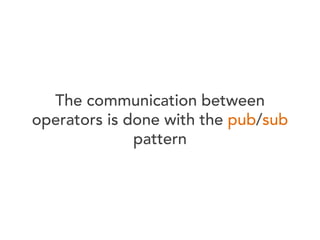
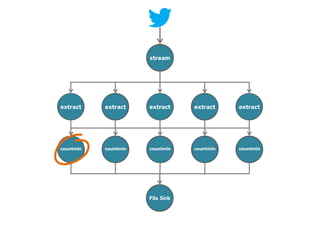
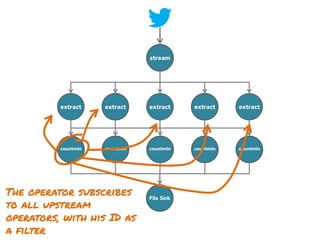


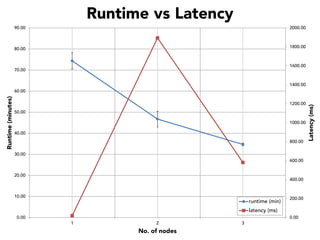
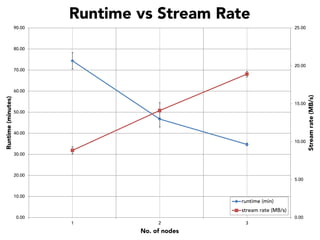
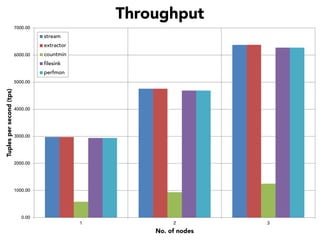
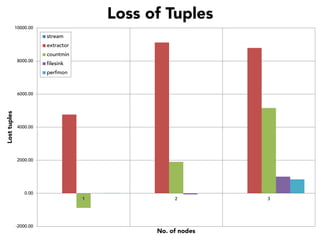
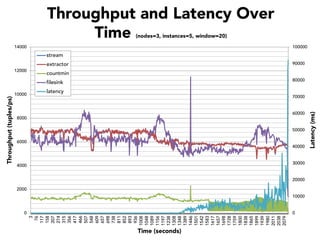

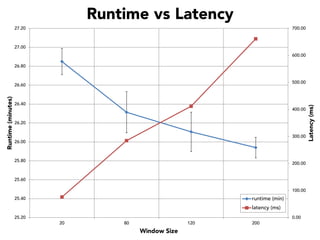

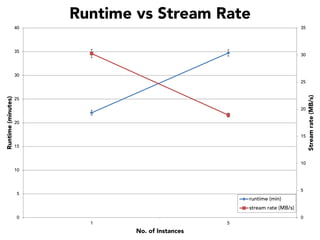

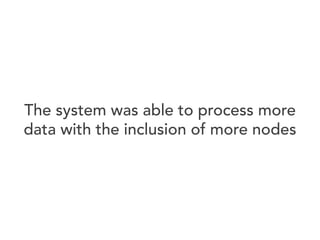


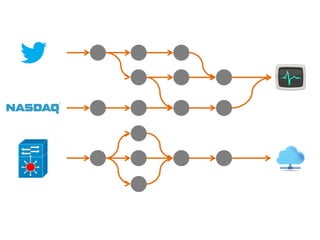
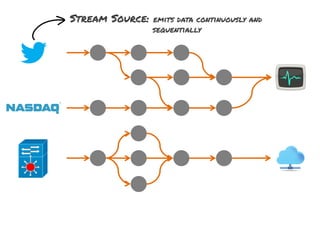
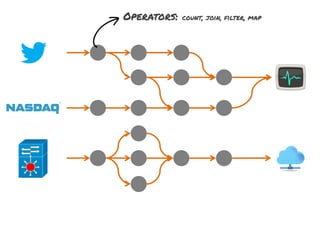
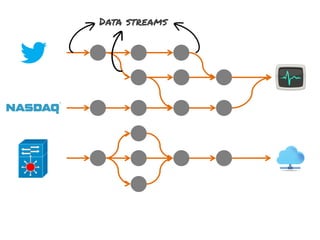
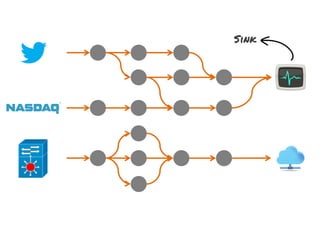
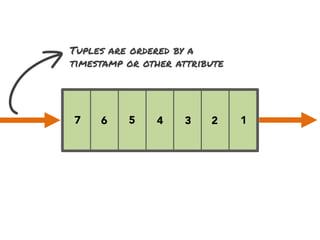
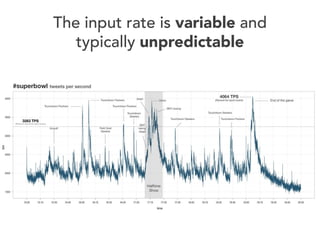
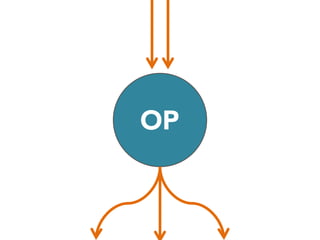
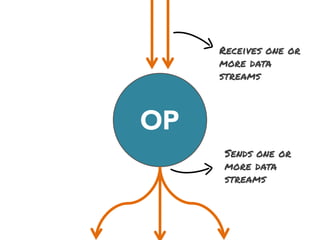
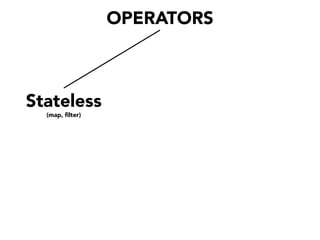
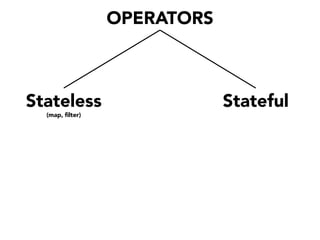
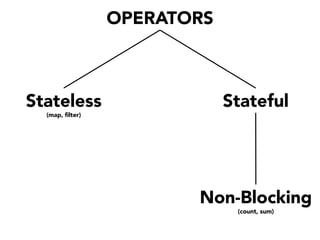
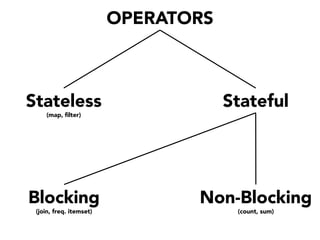
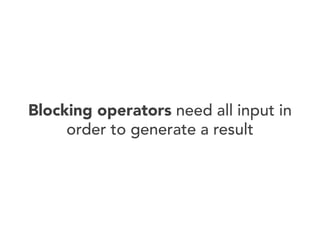
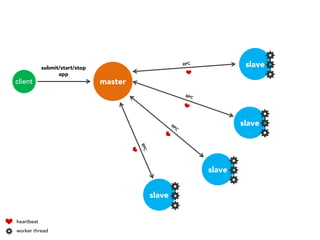
The document discusses the development of a distributed stream processing system, detailing the architecture, operator classification, and the implementation framework for a trending topics application. It highlights key concepts such as stream sources, operators, data windowing, and the pub/sub communication pattern between operators. Performance metrics are analyzed through experiments comparing runtime, latency, and throughput under varying conditions, emphasizing the trade-offs between data processing efficiency and latency when scaling nodes.


![Getting Started with Apache Spark: Big Data Made Simple [Free Meetup]](https://cdn.slidesharecdn.com/ss_thumbnails/apachesparkgettingstarted-260203175547-8361bcc3-thumbnail.jpg?width=640&height=640&fit=bounds)


