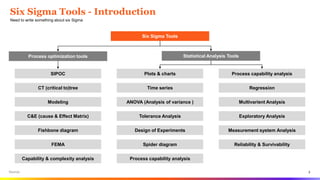
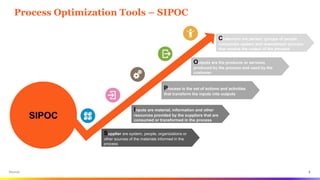
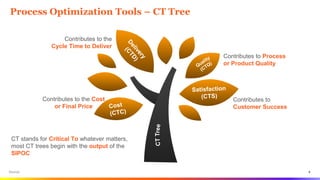
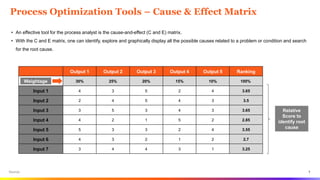
1
SIX SIGMA TOOLS – AN OVERVIEW
Submitted by
Ms. Komal Rajaram Kamble
March, 2020
Source:
2
Six Sigma Tools - Introduction
Need to write something about six Sigma
Source:
Process optimization tools
SIPOC
CT (critical to)tree
Modeling
C&E (cause & Effect Matrix)
Fishbone diagram
FEMA
Capability & complexity analysis
Six Sigma Tools
Statistical Analysis Tools
Plots & charts
Time series
ANOVA (Analysis of variance )
Tolerance Analysis
Design of Experiments
Spider diagram
Process capability analysis
Regression
Multivarient Analysis
Exploratory Analysis
Measurement system Analysis
Reliability & Survivability
Process capability analysis
3
Process Optimization Tools – SIPOC
Source:
Supplier are system, people, organizations or
other sources of the materials informed in the
process
Inputs are material, information and other
resources provided by the suppliers that are
consumed or transformed in the process
Process is the set of actions and activities
that transform the inputs into outputs
Outputs are the products or services
produced by the process and used by the
customer
Customers are person, groups of people
companies system and downstream process
that receive the output of the process
SIPOC
4
Process Optimization Tools – CT Tree
Source:
Contributes to
Customer Success
Contributes to Process
or Product Quality
Contributes to the
Cycle Time to Deliver
Contributes to the Cost
or Final Price
CT stands for Critical To whatever matters,
most CT trees begin with the output of the
SIPOC
5
Process Optimization Tools – Modelling Process
Source:
 The process maps looks like a flow chart which exhibits the activities and events in a process
Operation cycle time of the process element, including its average time to complete, the variation in time called the
standard deviation and distribution curve to represent all the possible completion times as well
Resources used in the process element, including human, capital and natural resources and then later track their
utilization during simulation
One must be able to define
whether the process step is
value added (VA) or non-
value added (NVA)
Costs of the resources consumed
6
Process Optimization Tools – Simulating Process
Source:
• Simulation tools are advanced computer based
programs that ingest all the parameters of the model
and runs dozens, hundreds and even thousands of
trials in the computer
• By doing this one generates simulated real life
outcomes without having made a single physical
change to the process and obtain vast amount of
detailed result for statistical analysis
Input Output
Data
Data
Data
Data
Data
Parameters
Simulation Process
Processing
7
Process Optimization Tools – Cause & Effect Matrix
Source:
• An effective tool for the process analyst is the cause-and-effect (C and E) matrix.
• With the C and E matrix, one can identify, explore and graphically display all the possible causes related to a problem or condition and search
for the root cause.
Output 1 Output 2 Output 3 Output 4 Output 5 Ranking
30% 25% 20% 15% 10% 100%
Input 1 4 3 5 2 4 3.65
Input 2 2 4 5 4 3 3.5
Input 3 3 5 3 4 3 3.65
Input 4 4 2 1 5 2 2.85
Input 5 5 3 3 2 4 3.55
Input 6 4 3 2 1 2 2.7
Input 7 3 4 4 3 1 3.25
Weightage
Relative
Score to
identify root
cause
8
Process Optimization Tools
Fish Bone Diagram
• Identifies the causes of an undesirable effect of a problem.
• Brings attention to the primary factors affecting the quality of a product or service.
• Often used during brainstorming sessions.
• Potential causes are sometimes called the process input variables
Process Optimization Tools – FMEA
• Identifies the ways in which a product or process can fail
• Estimates the risk associated with specific causes
• Prioritizes the actions that should be taken to reduce risk
RPN = Severity rating X Occurrence rating X Detection rating
Poka-Yoke (Mistake- Proofing):
Three types of Poka Yoke can be identified for quickly and easily delivering solutions for production problems.
 Visual aids
 Visual control
 Fail-safes
Process Optimization Tools – Capability- Complexity Analysis
In six sigma it is necessary to define, measure and control both the complexity of product and services as well as the capability of
processes
9
Process Optimization Tools – Plan
 A data collection plan is a detailed document. It describes the exact steps as well as the sequence that needs to be followed in gathering the
data for the given Six Sigma project.
 Following data characteristics need to be attended while collecting it
Data sources Data Stability Data Format Data Transfer
Control Plan
Audit Plan
 The Control Plan is a guide for the Process Owner to assist in tracking and correcting the performance
 The control plan is a key six sigma management tool.
 The control plan is proactive efforts to assure long term performance and also call an action if a
triggering event occurs.
 The audit plan acts as the measurement tool for the control plan.
 When the control plan is in place, the audit plan is the means for regular measuring and monitoring of
the outcomes.
10
Statistical Analysis Tools – Plots & Area (1/3)
Histogram
 Histogram is essentially a bar chart,
it creates a "lumpy distribution
curve" that can be used to help
identify and eliminate the causes of
process variation.
 Histograms are especially useful in
the measure, analyze and control
phases of the Lean Six Sigma
methodology.
Dot Plot
 Dot plots are a great way to see
data points and quickly compare
two or more sets of data, without
performing a single calculation.
 Dot plots look very similar to
histograms, but are easier to
construct and can be more valuable
for generating clues into potential
causes
Pareto Chart
 A bar chart in which the bars are
ordered from highest to lowest,
showing the critical contributors
Scatter Plot
 Shows the relationship between two
variables, conveying the nature of
correlation
11
Statistical Analysis Tools – Plots & Area (2/3)
Matrix Plot
 The Matrix Diagram in Six Sigma is
used to show the relationship
between the various items in two or
more groups.
3D Scatter Plot
 A three-dimensional scatter plot,
useful for evaluating the
relationships between three
different variables at the same time
Interval Plot
 An interval plot is used to compare
groups similar to a box plot or a dot
plot. It is used when the data is
continuous. Instead of plotting the
individual data point, an interval plot
shows the confidence interval for
the mean of the data
Box Plot
 A side-by-side comparison of
sample distributions. By convention,
the central line is the mean, the
boxes are +/- 25% and the lines are
the limits
12
Statistical Analysis Tools – Plots & Area (3/3)
CDF Plot
 A stepped cumulative histogram,
overlaid with a best-fit normal CDF
Probability Plot
 A scatter plot, overlaid with a CDF
cumulative probability line used to
determine how closely a particular
distribution fits data
Time Series Plot
 A plot of data spread over time
used to evaluate patterns in activity
across time
Marginal Plot
 A scatter plot with an added
histogram used to assess the
relationship between two variables
and their distributions
13
Statistical Analysis Tools
Time series
• Trending
• Forecasting
• Decomposition
• Moving Average
• Exponential smoothing:
ANOVA (Analysis of variance )
Tolerance analysis
is the statistical analysis tool that helps in determining the right specifications and limits on individual parts and components to ensure that they fit
together properly tolerance Analysis
Design of Experiments (DOE)
The term experiment is defined as the systematic procedure carried out under controlled conditions in order to discover an unknown effect, to test
or establish a hypothesis, or to illustrate a known effect.
14
Statistical Analysis Tools
Exploratory Analysis
Sometimes, it is not clear where to
begin or which statistical tools should
be used for a given situation. In such
situations, a variety of exploratory
analysis tools help in examining the
data in non-traditional ways and see
data in a different light.
Measurement System Analysis
A measurement systems analysis
(MSA) is a thorough assessment of a
measurement process, and typically
includes a specially designed
experiment that seeks to identify the
components of variation in that
measurement process
Regression
 Regression analysis is a set of
statistical methods used for the
estimation of relationships between
a dependent variable and one or
more independent variables.
Multivariate Analysis
 Multivariate analysis helps to
understand the structure in this mix
of data.
15
Statistical Analysis Tools
Spider Diagram
 Spider chart representing the
contribution, a particular technique
Process capability Analysis
 Process capability analysis is a set
of tools used to find out how well a
given process meets a set of
specification limits
Reliability and Survivability
 Reliability and survivability analysis helps in using all the
measurements and data from the past to predict what is the most likely
to occur in the future..

Six sigma tools an overview

  • 1.
    1 SIX SIGMA TOOLS– AN OVERVIEW Submitted by Ms. Komal Rajaram Kamble March, 2020 Source:
  • 2.
    2 Six Sigma Tools- Introduction Need to write something about six Sigma Source: Process optimization tools SIPOC CT (critical to)tree Modeling C&E (cause & Effect Matrix) Fishbone diagram FEMA Capability & complexity analysis Six Sigma Tools Statistical Analysis Tools Plots & charts Time series ANOVA (Analysis of variance ) Tolerance Analysis Design of Experiments Spider diagram Process capability analysis Regression Multivarient Analysis Exploratory Analysis Measurement system Analysis Reliability & Survivability Process capability analysis
  • 3.
    3 Process Optimization Tools– SIPOC Source: Supplier are system, people, organizations or other sources of the materials informed in the process Inputs are material, information and other resources provided by the suppliers that are consumed or transformed in the process Process is the set of actions and activities that transform the inputs into outputs Outputs are the products or services produced by the process and used by the customer Customers are person, groups of people companies system and downstream process that receive the output of the process SIPOC
  • 4.
    4 Process Optimization Tools– CT Tree Source: Contributes to Customer Success Contributes to Process or Product Quality Contributes to the Cycle Time to Deliver Contributes to the Cost or Final Price CT stands for Critical To whatever matters, most CT trees begin with the output of the SIPOC
  • 5.
    5 Process Optimization Tools– Modelling Process Source:  The process maps looks like a flow chart which exhibits the activities and events in a process Operation cycle time of the process element, including its average time to complete, the variation in time called the standard deviation and distribution curve to represent all the possible completion times as well Resources used in the process element, including human, capital and natural resources and then later track their utilization during simulation One must be able to define whether the process step is value added (VA) or non- value added (NVA) Costs of the resources consumed
  • 6.
    6 Process Optimization Tools– Simulating Process Source: • Simulation tools are advanced computer based programs that ingest all the parameters of the model and runs dozens, hundreds and even thousands of trials in the computer • By doing this one generates simulated real life outcomes without having made a single physical change to the process and obtain vast amount of detailed result for statistical analysis Input Output Data Data Data Data Data Parameters Simulation Process Processing
  • 7.
    7 Process Optimization Tools– Cause & Effect Matrix Source: • An effective tool for the process analyst is the cause-and-effect (C and E) matrix. • With the C and E matrix, one can identify, explore and graphically display all the possible causes related to a problem or condition and search for the root cause. Output 1 Output 2 Output 3 Output 4 Output 5 Ranking 30% 25% 20% 15% 10% 100% Input 1 4 3 5 2 4 3.65 Input 2 2 4 5 4 3 3.5 Input 3 3 5 3 4 3 3.65 Input 4 4 2 1 5 2 2.85 Input 5 5 3 3 2 4 3.55 Input 6 4 3 2 1 2 2.7 Input 7 3 4 4 3 1 3.25 Weightage Relative Score to identify root cause
  • 8.
    8 Process Optimization Tools FishBone Diagram • Identifies the causes of an undesirable effect of a problem. • Brings attention to the primary factors affecting the quality of a product or service. • Often used during brainstorming sessions. • Potential causes are sometimes called the process input variables Process Optimization Tools – FMEA • Identifies the ways in which a product or process can fail • Estimates the risk associated with specific causes • Prioritizes the actions that should be taken to reduce risk RPN = Severity rating X Occurrence rating X Detection rating Poka-Yoke (Mistake- Proofing): Three types of Poka Yoke can be identified for quickly and easily delivering solutions for production problems.  Visual aids  Visual control  Fail-safes Process Optimization Tools – Capability- Complexity Analysis In six sigma it is necessary to define, measure and control both the complexity of product and services as well as the capability of processes
  • 9.
    9 Process Optimization Tools– Plan  A data collection plan is a detailed document. It describes the exact steps as well as the sequence that needs to be followed in gathering the data for the given Six Sigma project.  Following data characteristics need to be attended while collecting it Data sources Data Stability Data Format Data Transfer Control Plan Audit Plan  The Control Plan is a guide for the Process Owner to assist in tracking and correcting the performance  The control plan is a key six sigma management tool.  The control plan is proactive efforts to assure long term performance and also call an action if a triggering event occurs.  The audit plan acts as the measurement tool for the control plan.  When the control plan is in place, the audit plan is the means for regular measuring and monitoring of the outcomes.
  • 10.
    10 Statistical Analysis Tools– Plots & Area (1/3) Histogram  Histogram is essentially a bar chart, it creates a "lumpy distribution curve" that can be used to help identify and eliminate the causes of process variation.  Histograms are especially useful in the measure, analyze and control phases of the Lean Six Sigma methodology. Dot Plot  Dot plots are a great way to see data points and quickly compare two or more sets of data, without performing a single calculation.  Dot plots look very similar to histograms, but are easier to construct and can be more valuable for generating clues into potential causes Pareto Chart  A bar chart in which the bars are ordered from highest to lowest, showing the critical contributors Scatter Plot  Shows the relationship between two variables, conveying the nature of correlation
  • 11.
    11 Statistical Analysis Tools– Plots & Area (2/3) Matrix Plot  The Matrix Diagram in Six Sigma is used to show the relationship between the various items in two or more groups. 3D Scatter Plot  A three-dimensional scatter plot, useful for evaluating the relationships between three different variables at the same time Interval Plot  An interval plot is used to compare groups similar to a box plot or a dot plot. It is used when the data is continuous. Instead of plotting the individual data point, an interval plot shows the confidence interval for the mean of the data Box Plot  A side-by-side comparison of sample distributions. By convention, the central line is the mean, the boxes are +/- 25% and the lines are the limits
  • 12.
    12 Statistical Analysis Tools– Plots & Area (3/3) CDF Plot  A stepped cumulative histogram, overlaid with a best-fit normal CDF Probability Plot  A scatter plot, overlaid with a CDF cumulative probability line used to determine how closely a particular distribution fits data Time Series Plot  A plot of data spread over time used to evaluate patterns in activity across time Marginal Plot  A scatter plot with an added histogram used to assess the relationship between two variables and their distributions
  • 13.
    13 Statistical Analysis Tools Timeseries • Trending • Forecasting • Decomposition • Moving Average • Exponential smoothing: ANOVA (Analysis of variance ) Tolerance analysis is the statistical analysis tool that helps in determining the right specifications and limits on individual parts and components to ensure that they fit together properly tolerance Analysis Design of Experiments (DOE) The term experiment is defined as the systematic procedure carried out under controlled conditions in order to discover an unknown effect, to test or establish a hypothesis, or to illustrate a known effect.
  • 14.
    14 Statistical Analysis Tools ExploratoryAnalysis Sometimes, it is not clear where to begin or which statistical tools should be used for a given situation. In such situations, a variety of exploratory analysis tools help in examining the data in non-traditional ways and see data in a different light. Measurement System Analysis A measurement systems analysis (MSA) is a thorough assessment of a measurement process, and typically includes a specially designed experiment that seeks to identify the components of variation in that measurement process Regression  Regression analysis is a set of statistical methods used for the estimation of relationships between a dependent variable and one or more independent variables. Multivariate Analysis  Multivariate analysis helps to understand the structure in this mix of data.
  • 15.
    15 Statistical Analysis Tools SpiderDiagram  Spider chart representing the contribution, a particular technique Process capability Analysis  Process capability analysis is a set of tools used to find out how well a given process meets a set of specification limits Reliability and Survivability  Reliability and survivability analysis helps in using all the measurements and data from the past to predict what is the most likely to occur in the future..