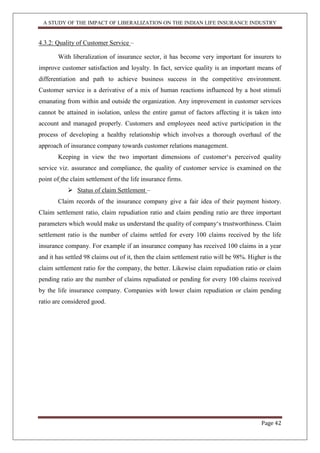
A
Project Report
On
“A STUDY OF THE IMPACT OF LIBERALIZATION ON
THE INDIAN LIFE INSURANCE INDUSTRY”
SUBMITTED TO:
SAVITRIBAI PHULE PUNE UNIVERSITY
BY:
SOMNATH B. PAGAR
UNDER THE GUIDANCE OF
MS.NAMRATA DESHMUKH
MBA II
(2013-2015)
MET‟S INSTITUTE OF MANAGEMENT
NASHIK, MAHARASHTRA, INDIA - 422003.
A STUDY OF THE IMPACT OF LIBERALIZATION ON THE INDIAN LIFE INSURANCE INDUSTRY
Page 1
CONTENTS
Sr. No Particulars Page No.
Preface
Acknowledgement
1. Introduction 5
Organisation profile 7
1.1 Liberalization and Deregulation Concepts 12
1.2 Methodology of the Study 13
1.3 Objectives of the Study 14
2. An overview of Indian life insurance industry
2.1 Life insurance: defined 15
2.2 Indian life insurance-history 16
2.2.1 Pre nationalization phase 17
2.2.2 Nationalization and LIC„s monopoly regime (1956-2000) 20
3. Literature review 24
4. Data analysis and interpretation
26
4.1 Concentration 26
4.2 Efficiency 38
4.3 Innovations 40
4.3.1 Products 40
4.3.2 Quality of Customer Service 42
5. Limitation of the study 44
6. Conclusion 45
Bibliography 46
Appendices 48
A STUDY OF THE IMPACT OF LIBERALIZATION ON THE INDIAN LIFE INSURANCE INDUSTRY
Page 2
TABLE OF CONTENTS FOR TABLES & CHARTS
Sr. no Particulars Page no.
Tables
1. 2.2(a): Milestones of insurance regulations in the 20th Century 16
2. 2.2.1(a): Number of life insurance companies: 1929-1939 17
3. 2.2.1(b): Growth of life Insurance business in India: 1914-1948 18
4. 2.2.1(c): Life insurance business in force in India: 1949-1955 19
5. 2.2.2(a): Growth statistics of LIC of India 21
6.
2.2.2(b): Performance of LIC from 1991-92 to 1999-00:
Individual Assurance
21
7. 2.2.2(c): New policies issued and their market share 22
8. 2.2.2(d): Life insurance companies in India 23
9. 4.1: Market share and herfindahl index of all life insurance firms 29
10. 4.2: Market share and herfindahl index for all private life firms 30
11. 4.3: Market share and HHI of all life insurance firms 32
12. 4.4: Market share and HHI of all private life insurance firms 33
13. 4.5: HHI, CR1and CR4 compared (Total Premium) 36
14. 4.6: HHI, CR1and CR4 compared (Total Equity Capital) 36
15. 4.7: Ratio Analysis of LIC and private sector top 5 firms 39
16. 4.8: Number of products offered by life insurers in India 41
17. 4.9: Claim Settlement ratio of all Life Insurers 43
18. A.1- Total life insurance premium. 48
19. A.2- Equity share capital of life insurers. 48
Charts
1. Kotak Groups Financial Services 8
2. Management Hierarchy 9
3.
Insurance Offered By Kotak Mahindra Old Mutual Life Insurance
Ltd.
11
4. 4.1-HHI of life insurance industry 35
A STUDY OF THE IMPACT OF LIBERALIZATION ON THE INDIAN LIFE INSURANCE INDUSTRY
Page 3
PREFACE
Insurance market worldwide continues to undertake pro-competitive reform. As a
consequent, dozens of countries have deregulated and liberalized their insurance markets.
Insurance sector in India has also gone through the process of reforms following the
recommendation of Malhotra Committee„s report submitted in1996. In the progression of
events towards liberalization Insurance Regulatory and Development Bill (IRDA) was passed
in 1999. This along with amendments to the LIC (and also GIC) Acts paves way for the entry
of private players. Since then, India„s insurance sector is undergoing a radical change for the
past decade.
This study tries to give an overview of the impacts of liberalization and
deregulation processes in Indian life insurance industry. With the liberalization, there is entry
of private companies in Insurance sector with attendant changes. There are changes in terms
of market concentration, product innovations, marketing strategy and use of technology for
processes, all attributable to liberalization and deregulation. So it is very important to
evaluate and understand various impacts in terms of competition, growth, development and
future prospects in the sector. The issues covered in this analysis also include the efficiency
and productivity improvement in the life insurance industry due to deregulation.
A STUDY OF THE IMPACT OF LIBERALIZATION ON THE INDIAN LIFE INSURANCE INDUSTRY
Page 4
ACKNOWLEDGEMENTS
In the preparation of this study, lots of people have helped me in some way or the
other and therefore acknowledgements are due to them without whose co-operation, support,
encouragement and guidance this research study could not have been completed.
This study was done under the guidance of Prof. Ms. Namrata Deshmukh. I would
like to acknowledge my deepest appreciation and undying gratitude for the scholarly
guidance, constant encouragement and confidence he has given to me. She has been my
mentor not only during the course of this work, but also in my entire PG study. I am truly
indebted to her.
I am extremely thankful to all my teachers and Dr. Sonali Gadekar (HOD) MET
Institute Of Management, Nashik. I would also like to thanks to the Librarians and
administrative staffs of the MET IOM for their timely help and co-operation during the
project work.
I am extremely grateful to Mr. Kishor Jadhav Sir, Assistant Branch Manager, Kotak
Life Insurance, Nashik Branch for his suggestion and guidance. My grateful thanks are also
due to Mr. Manoj Muthoot Sir, the Branch Manager Kotak Life Insurance, Nashik Branch.
for helping me to access the organization data at its Branch premises.
Somnath B. Pagar
A STUDY OF THE IMPACT OF LIBERALIZATION ON THE INDIAN LIFE INSURANCE INDUSTRY
Page 5
CHAPTER- I
INTRODUCTION
Liberalization of domestic financial market had been common characteristic in many
countries which includes industrially developed countries as well as the developing countries.
However, there is a substantial amount of debate in economic research regarding the benefits
of deregulation. In the context of insurance services, deregulation generally leads to market
liberalization. Countries are liberalizing their insurance market at different rates and to
different degree. Additionally, each country has its own unique political and economic
characteristics. Furthermore, the best route from monopoly to competition differs
substantially in different setting. Therefore there is no single set of direction that can guide
the challenging journey from monopoly to competition. And so outcomes of deregulation
policy differ from country and country and need to analyze each of them separately to
understand the end result of a particular liberalization and deregulation policy.
In India, New Economic Policy (NEP) was introduced in 1991 with the main idea of
globalization, privatization, deregulation and liberalization. As a consequent, insurance
market liberalization process was initiated in 1993 and was finally opened in 1999. The life
insurance market was opened to private players because of low penetration of life insurance,
non-availability of customer oriented products, low level of customer satisfaction, higher
premium rates and lack of professionalism on the part of the insurer and a very low spread of
life insurance in the country. In addition, signing of the GATT (General Agreement on Tariff
and Trade) made way for the opening of the insurance sector to global players. The opening
of the Indian insurance sector was aimed at fostering competition and innovation with greater
variety of products and growth of the insurance business. This research will highlight the post
liberalization scenario in the life insurance sector in India to see whether the objective behind
the opening of the life insurance have been achieved or on the right direction towards
achieving the objective laid down by the policy makers.
The main research questions explored in the study include:-
 1. What is the present scenario of the industry? How different it is from the pre
liberalization scenario? What changes may be brought about by competition in the
industry?
 2. How far the life insurance companies have improved in terms of the efficiency?
A STUDY OF THE IMPACT OF LIBERALIZATION ON THE INDIAN LIFE INSURANCE INDUSTRY
Page 6
 3. How did liberalization contributed in product innovation and customer service
parameters in life insurance industry?
 4. What are other implications of liberalization in life insurance industry?
The study covers the period from 2001-02 to 2012-13. The number of insurers taken
varies from analysis to analysis. In some cases, top 5 private sector(in terms of total premium
and net earnings) insurers are taken for the study instead of all the insurers, as the data
pertaining to new entrants are not available or may deteriorate the overall result. It primarily
depends on the secondary data available with Insurance Regulatory and Developmental
Authority of India (IRDA), Annual reports of respective life insurance companies in India.
Also text books, national as well as international articles and dailies are referred to collect
relevant and required data.
A STUDY OF THE IMPACT OF LIBERALIZATION ON THE INDIAN LIFE INSURANCE INDUSTRY
Page 7
ORGNISATION PROFILE
Kotak Mahindra Old Mutual Life Insurance Ltd
is a 74:26 joint venture between Kotak Mahindra Bank Ltd., its affiliates and Old Mutual plc.
The company started operations in 2001, and strives to offer its customers outstanding value
through high customer empathy, consistent and benchmarked service and a suite of products
that leverage the combined prowess of protection and long term savings. The company covers
over 4 million lives and is one of the fastest growing insurance companies in India.
About Kotak Mahindra Group
Established in 1985, the Kotak Mahindra Group
is one of India's leading financial services conglomerates. In February 2003, Kotak Mahindra
Finance Ltd. (KMFL), the Group's flagship company, received a banking license from the
Reserve Bank of India (RBI). With this, KMFL became the first non-banking finance
company in India to become a bank–Kotak Mahindra Bank Limited.
The consolidated balance sheet of Kotak Mahindra group is over 1.22 lakh crore and
the consolidated net worth of the Group stands at 19,076 crore (US$ 3.2 billion) as on March
31, 2014. The Group offers a wide range of financial services that encompass every sphere of
life. From commercial banking, to stock broking, mutual funds, life insurance and investment
banking, the Group caters to the diverse financial needs of individuals and the corporate
sector. The Group has a wide distribution network through branches and franchisees across
India, and international offices in London, New York, Dubai, Abu Dhabi, Mauritius and
Singapore.
Group
A STUDY OF THE IMPACT OF LIBERALIZATION ON THE INDIAN LIFE INSURANCE INDUSTRY
Page 8
A STUDY OF THE IMPACT OF LIBERALIZATION ON THE INDIAN LIFE INSURANCE INDUSTRY
Page 9
About Old Mutual -
Old Mutual provides life assurance, asset
management, banking and general insurance to more than 16 million customers in Africa, the
Americas, Asia and Europe. Originating in South Africa in 1845, Old Mutual has been listed
on the London and Johannesburg Stock Exchanges, among others, since 1999. In the year
ended 31 December 2013, the Group reported adjusted operating profit before tax of £1.6
billion (on an IFRS basis) and had £294 billion of funds under management from core
operations.
Board of Director‟s/Management Hierarchy
A STUDY OF THE IMPACT OF LIBERALIZATION ON THE INDIAN LIFE INSURANCE INDUSTRY
Page 10
Financial Position
Particulars
Year ended
March 31, 2013
Year ended
March 31, 2012
New Business Premium 1,188 1,164
Renewal Premium 1,590 1,773
Total Premium 2,778 2,937
Profit/(Loss) before tax 212 211
Profit/ (Loss) after tax 203 211
Bonus to Policyholders 42 33
Net worth 803 613
New Business Sum Assured 106,847 90,474
Assets Under Management 10964 92724
*Source: kotak life insurance annual report 2012-13.
Vision & Mission
An uncommon bond. Strengthened by a common vision.
Apart from common beliefs, values and objectives we believe in the vision of a better
tomorrow. It is this deep veneer of faith that has brought us together and fortified our bond.
The global Indian financial services brand
Our customers will enjoy the benefits of dealing with a global Indian brand that best
understands their needs and delivers customized pragmatic solutions across multiple
platforms. We will be a world-class Indian financial services group. Our technology and best
practices will be benchmarked along international lines while our understanding of customers
will be uniquely Indian. We will be more than a repository of our customers' savings. We, the
group, will be a single window to every financial service in a customer's universe.
The most preferred employer in financial services
A culture of empowerment coupled with a spirit of enterprise, attracts bright minds with an
entrepreneurial streak to join us and stay with us. Working with a home-grown,
professionally-managed company, which has partnerships with international leaders, gives
our people a perspective that is universal as well as unique.
The most trusted financial services company
We will create an ethos of trust across all our constituents. Adhering to high standards of
compliance and corporate governance will be an integral part of building trust.
Value creation
Value creation rather than size alone will be our business driver.
A STUDY OF THE IMPACT OF LIBERALIZATION ON THE INDIAN LIFE INSURANCE INDUSTRY
Page 11
Insurance Offered By Kotak Mahindra Old Mutual Life Insurance Ltd-
Source: http://insurance.kotak.com
A STUDY OF THE IMPACT OF LIBERALIZATION ON THE INDIAN LIFE INSURANCE INDUSTRY
Page 12
1.1-Liberalization and Deregulation Concepts:
Liberalization policies that remove barriers to entry and empower consumers to
discipline industry suppliers typically are better methods for fostering vigorous long term
industry competition (Armstrong Mark and David E. M. Sappington, 2006). Liberalization
and deregulation seek to improve economic welfare by bringing a more efficient allocation of
the country„s resources in the long run.
The deregulation is an occurrence opposite to regulation. It means a reduction of
existing limits or controls of the state on a lower level. Liberalization results from the
deregulation process. That means directions and magnitude of liberalization are determined
by the actions of deregulation characters. Liberalization policies that remove barriers to entry
and empower consumers to discipline industry suppliers typically are better methods for
fostering vigorous long term industry competition (Armstrong Mark and David E. M.
Sappington, 2006).
There are several potential benefits of liberalized regime as given by Skipper (1997):-
First, liberalization facilitates better customer services and value. It enhances
competition in a wider geographical range and so creates stronger and more competitive local
insurance industry. Open markets also help firms tap into world markets, increase their sales
potential, benefits from economies of scale, and spread the fixed costs of research and
development over a wider customer base.
Secondly, liberalization helps in mobilizing domestic savings. More liberalized
market regime with greater foreign insurers involved in could contribute saving and so to
economic development.
Thirdly, liberalization makes possible the transfer of technological knowhow.
Transfer of ideas, bringing of new and better skills and knowhow, training programs,
technology and managerial techniques to host country are facilitated in the liberalized market.
Lastly, liberalization promotes additional capital inflow. A domestic country benefits
from liberality in that the foreign insurers bring an additional source of financial capital. The
additional financial capital can be used to finance additional projects.
A STUDY OF THE IMPACT OF LIBERALIZATION ON THE INDIAN LIFE INSURANCE INDUSTRY
Page 13
1.2 Methodology of the Study
Life insurance sector is the major part of total insurance sector in India and so
can be able represent majority of the reform„s implication to the industry. The decision to
introduce competition into an industry is only the beginning of a journey down a long and
winding road that can represent many obstacles and detours. With the liberalization and entry
of private companies in Insurance sector there are various changes brought in .There are
changes in terms of efficiency of life insurance firms, market concentration level and product
innovations which are generally attributable to liberalization and deregulation. So it is very
important to evaluate and understand the impact in terms of growth and development and
other future prospects in the sector and try to find out how the reforms have benefited the
insurance sector in India. This thesis therefore, attempts to study the impacts of liberalization
and deregulation processes in India, specifically in life insurance industry.
There are 24 life insurers including LIC of India as on 31st March 2014. However
numbers of insurers taken varied in the analysis, as the insurers which entered into the
industry after 31st March 2012 are not considered for short of data. The analysis depends on
the secondary data available with Insurance Regulatory and Developmental Authority of
India (IRDA) and the Annual Reports of respective life insurance companies in India. Also
text books, national as well as international articles are referred to collect relevant and
required data.
The statistical tools used in the research include Herfindahl Hirschman index
(HHI).Other simple statistical tools were also used, as required. To examine the state and
nature of competition, the Herfindahl Hirschman Index, and Concentration Ratio (C1, C4)
of the industry are calculated using firm level share of total premium and equity share capital.
Each of the statistical method used are explained in details IV chapter.
Project primarily depends on the secondary data available with Insurance
Regulatory and Developmental Authority of India (IRDA), Annual reports of respective life
insurance companies in India. Also text books, national as well as international articles and
dailies are referred to collect relevant and required data.
A STUDY OF THE IMPACT OF LIBERALIZATION ON THE INDIAN LIFE INSURANCE INDUSTRY
Page 14
1.3-Objectives of the Study
The impact of liberalization can be viewed as a two tier process; namely impact on
financial performance as well as on the overall functioning of the market. This study takes
into account the efficiency improvement in the life insurance industry in the wake of
deregulation. To sum up, following research questions are answered in the research study.
1) What is the present scenario of the industry? How different it is from the pre liberalization
scenario?
2) The competition in the sector is expected to increase. So what is the present state and
nature of competition? What changes have taken place in the market structure of life
insurance industry?
3) Whether firms are efficient or not? Whether or not the efficiency and of the insurance
market is improving after liberalization?
4) How did liberalization contributed in product innovation and customer service benchmark
in life insurance industry?
5) What are the implications of liberalization on spread and coverage of social security
measures?
A STUDY OF THE IMPACT OF LIBERALIZATION ON THE INDIAN LIFE INSURANCE INDUSTRY
Page 15
CHAPTER- II
AN OVERVIEW OF INDIAN LIFE INSURANCE INDUSTRY
The insurance sector in India is nearly 193 years old and can be termed as in the
third phase of its existence. Today, the life insurance business ranked 9th among the 156
countries and the share of life insurance sector in global market was 2.45 percent in 2009.
This chapter defines the concept of life insurance and gives an overall summary of the long
and eventful journey of Indian life insurance industry from the British Raj to Monopoly Raj
to Swaraj.
2.1-Life Insurance: Defined
Life Insurance is basically associated with risk of
human lives. It provides protection to household against the
premature death of its bread winner or income earning
member. Individuals buy life insurance product by paying
certain amount of money which is called premium to the life
insurance company for contractual agreements to provide a
shield in case of eventualities.
According to the section 2(11), of the Insurance Act of 1938, life insurance business
in India is defined as follows:-
“Life insurance business” means the business of effecting contracts of insurance
upon human life, including any contract whereby the payment of money is assured on death
(except death by accident only) and the happening of any contingency dependent on human
life, and any contract which is subject to payment of premiums for terms dependent on
human life.”
A STUDY OF THE IMPACT OF LIBERALIZATION ON THE INDIAN LIFE INSURANCE INDUSTRY
Page 16
2.2-Indian Life Insurance-History
Insurance business in India is classified primarily as Life Insurance and General
Insurance. The journey of Indian Insurance Industry has so far been very eventful in the way
that it has come in full circle from privatization of insurance firms to creation of monopoly
and back to privatization and liberalization. The journey can be divided into three phases viz.
1) Pre nationalization phase (Before 1956), 2) Nationalized era (1956-2000) and 3)
Liberalization era (2000 onwards). The Table 2.2 provides the sequence of the journey of
Indian Insurance up to starts of the liberalization. Each of these phases is discussed briefly as
follows.
Table 2.2(a): Milestones of insurance regulations in the 20th Century
Year Significant regulatory events
1818 Establishment of the Oriental Life Insurance Company in Calcutta
1912 The Indian Life Insurance company Act
1928 The Indian Insurance Companies act
1938 The Insurance Act: comprehensive Act to Regulate insurance business in India
1956 Nationalization of life insurance business in India with monopoly awarded to
LIC of India
1972 Nationalization of general insurance business in India with formation of a
holding company General Insurance Corporation
1993 Setting up of Malhotra Committee
1994 Recommendations of Malhotra Committee published
1995 Setting up of Mukherjee Committee
1996
Setting up of (interim) Insurance Regulatory Authority(IRA)
Recommendations of the IRA
1997 Mukherjee Committee report submitted but not made public
1997
The Government gives greater Autonomy to LIC, GIC and its subsidiaries with
regards to the restructuring of boards and flexibility in investment norms aimed
at channeling funds to the Infrastructure sector.
1998
The cabinet decides to allow 40% foreign equity in private insurance companies
and 14% to Non-resident Indians and foreign institutional Investors.
1999
The Standing Committee headed by Mr. Murali Deora decides that foreign
equity in private insurance should be limited to 26%.IRA bill is renamed the
Insurance Regulatory and Development Authority bill.
1999 Cabinet clears Insurance Regulatory and Development Authority Bill
2000
President gives Assent to the Insurance Regulatory and Development Authority
Bill
*Source: Tapen Sinha, CRIS Discussion Paper Series-2002.
A STUDY OF THE IMPACT OF LIBERALIZATION ON THE INDIAN LIFE INSURANCE INDUSTRY
Page 17
2.2.1-Pre nationalization phase:
First insurance company in India was the Oriental Life Insurance Company started in
1818 in Kolkata, which failed in 1834 (Bhattacharya, et al 2003). This company was owned
by the European and it looked after the needs of Europeans only. Bombay Mutual Life
Assurance Society heralded the birth of first Indian life insurance company in the year 1870,
and covered Indian lives. As for the regulation, it was only in 1912 that the Life Insurance
Companies Act was enacted and the comprehensive legislature for regulating and
administering Indian industry started. Prior to this, India had no legislation to regulate
insurance business and the Indian insurance companies were governed by the Companies Act
of 1866. There were two important Insurance Acts enacted during this phase namely
Insurance Act 1912 and Insurance Act 1938.
Insurance Act 1912: It was modeled on the basis of the Insurance Companies Act
1870 of the UK and the one enacted in 1909 replacing the Act of 1870. The Indian Life
Insurance Companies Act, 1912 made it necessary that the premium rate tables and periodical
valuations of companies should be certified by an actuary.
The Indian Insurance Act 1938: This act was the first comprehensive legislation
governing not only life but also non-life branches of insurance. The Act aimed to consolidate
and amend the law relating to insurance business and so defined the legal framework of the
insurance business in India. The insurance business in India is still governed by the
provisions of this Act with several amendments made to it.
Business during the Pre nationalization phase:
During the period 1870 to 1939, number of life insurance companies were formed and
exited from operation. The number of life Indian life insurance companies grew from 30 in
1912 to 116 in 1939 and remained at 154 in 1955 is shown in Table 2.1.1(a).
Table 2.2.1(a): Number of life insurance companies: 1929-1939
Year company Promoted Exited Remained
1870-1912
Indian Companies 58 28 30
Foreign companies 30 21 09
Total 88 49 39
1929-39 Indian companies 176 60 116
A STUDY OF THE IMPACT OF LIBERALIZATION ON THE INDIAN LIFE INSURANCE INDUSTRY
Page 18
Foreign companies 05 02 03
Total 181 62 119
1955
Indian companies -- -- 154
Foreign and provident
societies
-- -- 91
Total -- -- 245
*Source: Desai G. R (1973) “Life Insurance in India: Its History and Dimensions of Growth".
Growth of life business during the period 1914 to 1955 is shown in tables 2.2.1(b)
&2.2.1(c). (The data were taken from different sources and are differ in the variables
presented; therefore the tables are shown separately)
Table 2.2.1(b): Growth of life Insurance business in India: 1914-1948
Year Insurer Number of
insurers
Total number of
policies in force
Total business
in force(Rs
crore)
Total life
fund( Rs
crore)
1914
Indian 44 -- 22.44
6.36
Non-Indian -- -- --
Indian Outside India -- -- --
Total 44 -- 22.44
1930
Indian 68 513925(68.61) 84.89(32.85)
20.53
Non-Indian -- 220703 69.76
Indian Outside India -- 14369 3.77
Total 68 748997 258.42
1940
Indian 179 1371963(84.25) 225.51(74.17)
62.41
Non-Indian 16 181247 60.12
Indian Outside India --
75171
18.40
Total 195 1628381 304.03
1945
Indian 200 2376000(87.55) 459.43(80.17)
107.4Non-Indian 15 261000 91.85
Indian Outside India -- 77000 21.79
Total 215 2714000 573.07
1948 Indian 189 2791000(90.15) 566.38(79.46) 150.39
A STUDY OF THE IMPACT OF LIBERALIZATION ON THE INDIAN LIFE INSURANCE INDUSTRY
Page 19
Non-Indian 20 234000 101.08
Indian Outside India -- 202000 45.30
Total 209 3016000 712.76
*Source: Tryst with Trust (1991) LIC of India, Bombay, India.
Table2.2.1(c): Life Insurance business in force in India 1949-1955.
Year New business Total business in force
Number of
Policies(In Lakhs)
Amt.(In Crores)
Number of
Policies(In Lakhs)
Amt.(In Crores)
1949 5.44 142.2 33.03 765
1950 4.98 139.5 32.8 780
1951 4.74 147.9 34.14 873
1952 5.34 146.7 39.25 922
1953 5.58 155.2 40.79 966
1954 7.73 255.25 47.82 1177
1955 8.31 260.28 47.92 1220
*Source: Bhave S.R (1970), Saga of Security: Story of Indian Life insurance (1870-1970).
The total business in force which was 22.44 crore in 1914 grew to 712.76 crore in
1948. The year 1943 marked the beginning of a period of steady and progressive increase in
the volume of new life insurance business, Rs 62.94 crore in 1943; Rs 95.20 crore in 1944;
Rs 122.78 crore in 1945( Tryst with Trust (1991) LIC of India ). It was in 1945 that for the
first time, the volume of Indian insurance business cross Rs 100 Crores mark. The foreign
insurance companies found it difficult to withstand the competition from Indian life insurance
companies and were able to get a meager amount of business share during the period. (Mitra
Debabrata and Ghosh Amlan, 2010). The total new business written by Indian life insurance
companies were Rs 255 crore and Rs 260.84 crore in 1954 and 1955 respectively.
A STUDY OF THE IMPACT OF LIBERALIZATION ON THE INDIAN LIFE INSURANCE INDUSTRY
Page 20
2.2.2-Nationalization and LIC„s monopoly regime (1956-2000):
The announcement by C. D. Deshmukh, the then Finance minister of India on
January19, 1956 that the government will take over the life insurance business of all national
and foreign companies in India was the first vital move in nationalizing life insurance in India
and Life Insurance (Emergency Provision) Act 1956 was made. The ordinance and act
provided for Government control of 245 companies comprising 154 Indian Insurers, 75
provident societies and 16 non-Indian insurers. Based on the ordinance, the bill for
nationalizing the life insurance business in India was piloted in the Parliament on February
18, 1956 as a Finance bill. After a reference to a joint select committee of the parliament and
adoption by both the houses of the parliament with the assent of the president of India, the
Bill came into force on July1, 1956. And the Life Insurance Corporation of India was
constituted on September 1, 1956 under the Act (LIC Act Number 31of 1956 dated June 18,
1956).
LIC Act, 1956:- It is an act which provides for the nationalization of life insurance
business in India by transferring all such business to a corporation established for the purpose
and to provide for the regulation and control of the business of the corporation and for
matters connected therewith or incidental thereto.
Post nationalization growth:
At the time of nationalization, the LIC of India took over total life business of over Rs
1,128.06 Crores, under 47.82 lakh policies of which the share of Indian insurers was around
87.25% and that of Non –Indian insurers was 12.28. New business written by LIC of India at
the end of December 1957 stood at Rs 281.90 crore under 794,585 policies. The business
volume at the end of 1957 including bonuses stood at Rs 1474 crore under 56.86 lakh
policies.
A STUDY OF THE IMPACT OF LIBERALIZATION ON THE INDIAN LIFE INSURANCE INDUSTRY
Page 21
Table 2.2.2(a): Growth statistics of LIC of India (Policies are in lakh and amount in Crores).
Year
Premium
Income
Investment
Income
Total
business in
force
Total in force
policies
Annual New
Business
Annual
number of
new policies
1984-85 1559.13 950.58 33,950.50 265.31 5,375.93 27.00
1985-86 1782.28 1126.98 40,617.10 280.47 7,088.45 32.94
1986-87 2097.21 1334.17 48,150.64 298.60 9,107.59 38.76
1987-88 2671.88 1557.21 59,067.69 324.81 12,467.58 47.64
1988-89 3432.72 1884.83 74,429.00 361.34 17,268.58 59.87
1989-90 4489.39 2278.29 94,823.00 403.98 23,319.53 74.01
*Source: Tryst with Trust (1991) LIC of India, Bombay, India.
Table 2.2.2(b): Performance of LIC from 1991-92 to 1999-00: Individual Assurance
Year
Number of Policies
(Lakhs)
Sum assured
(Rs Crores)
Annual premium Received
(Rs Crores)
1991-92 92.40 32064.00 1790
1992-93 100.00 32595.00 2038
1993-94 107.25 41814.00 2508
1994-95 108.74 55228.00 2534
1995-96 110.20 51816.00 2814
1996-97 122.68 56740.50 3345
1997-98 133.11 63617.69 3841
1998-99 148.44 75316.28 4863
1999-00 169.77 91214.25 6008
*Source: Annual Reports of LIC of India
Table 2.2.2(a) shows the growth statistics of LIC of India during the eighties. Table
2.2.2(b) shows the performance of LIC in terms of number of policies, sum assured and
annual premium received since 1991-92 to 1999-00 for individual assurance and total life
business in force. The number of policies, sum assured, and the annual premium received all
shows an increasing trend over the years.
A STUDY OF THE IMPACT OF LIBERALIZATION ON THE INDIAN LIFE INSURANCE INDUSTRY
Page 22
Table: 2.2.2(c): New policies issued and their market share
Year
New Policies issued(In Numbers)
Pvt. LIC Total
2002-03 825094(3.25) 24545580(96.75) 25370674(100)
2003-04 1658847(5.79) 26968069(94.21) 28626916(100)
2004-05 2233075(8.52) 23978123(91.48) 26211198(100)
2005-06 3871410( 10.92) 31590707(89.08) 35462117(100)
2006-07 7922274(17.17) 38229292(82.83) 46151566(100)
2007-08 13261558(26.07) 37612599(73.93) 50874157(100)
2008-09 15010710(29.48) 35912667(70.52) 50923377(100)
2009-10 14362000(26.98) 38863000(73.02) 53225000(100)
2010-11 11114000(24.79) 33703800(75.21) 44817800(100)
2011-12 8442000(19.10) 35751000(80.90) 44193000(100)
2012-13 7405000(16.76) 36782000(83.24) 44187000(100)
*Source: Annual Reports of IRDA
Table 2.2.2(c) shows the business performance in terms of new policies issued. Over
the years, the number of new policies issued by private insurers was increasing. The number
of new policies issued by LIC was also increasing but it was declined in 2004-05 as well as in
2007-08 and 2009-10. The share of private life insurers in new policies issued has increased
from 3% in 2002-03 to 29.5% in 2008-09 and that of Lic decreased from 97% to 70.5
respectively.
A STUDY OF THE IMPACT OF LIBERALIZATION ON THE INDIAN LIFE INSURANCE INDUSTRY
Page 23
Table 2.2.2(d): Life insurance companies in India*
Sr.
No.
Insurers Foreign Partner
Date of
Registration
Year of
Operation
1 LIC of India -- 01.09.1956 1956
2 HDFC Standard LI Co. Ltd Standard life Assurance, UK 23.10.2000 2000-01
3 Max New York LI Co. Ltd New York Life, USA 15.11.2000 2000-01
4 ICICI-Prudential LI Co. Ltd Prudential, UK 24.11.2000 2000-01
5 Kotak Old Mutual LI Co. Ltd Old Mutual, SA 10.01.2001 2001-02
6 Birla Sun LI Co. Ltd Sun Life, Canada 31.01.2001 2001-01
7 Tata-AIG LI Co. Ltd
American International
Assurance Co. USA
12.02.2001 2000-01
8 SBI LI Co. Ltd
BNP Paribas Assurance, SA,
France
29.03.2001 2001-02
9 ING Vysya LI Co. Ltd
ING Insurance International
B.V, Netherlands
02.08.2001 2001-02
10 Allianz Bajaj LI Co. Ltd Allianz, Germany 03.08.2001 2001-02
11 MetLife India insurance Co. Ltd
MetLife International
Holdings Ltd. USA
06.08.2001 2001-02
12 Reliance LI Co. Ltd -- 03.01.2002 2001-02
13 AVIVA
Aviva International Holdings
Ltd. UK
14.05.2002 2002-03
14 Sahara LI Co. Ltd -- 06.02.2004 2004-05
15 Shriram LI Co. Ltd Sanlam, SA 17.11.2005 2005-06
16 Bharti AXA LI Co. Ltd AXA Holdings, France 14.07.2006 2006-07
17 Future Generali India LI Co. SMNPL Generali, Italy 04.09.2007 2007-08
18 IDBI Fortis LI Co. Ltd Fortis, Netherlands 19.12.2007 2007-08
19 Canara HSBC OBC LI Co. Ltd HSBC,UK 08.05.2008 2008-09
20 Aegon Religare LI Co. Ltd Religare, Netherlands 27.06.2008 2008-09
21 DLF Pramerica LI Co. Ltd. Prudential of America, USA 27.06.2008 2008-09
22 Star Union Dai-ichi LI Co. Ltd.
Dai -ich Mutual life
Insurance of Japan
26.12.2008 2009-10
23 IndiaFirst LI Co.Ltd. -- 05.11.2009 2009-10
24
Edelweiss Tokio Life Insurance
Co. Ltd.
LI of Tokio NA 2011-12
* As on 31 March 2013.
A STUDY OF THE IMPACT OF LIBERALIZATION ON THE INDIAN LIFE INSURANCE INDUSTRY
Page 24
CHAPTER- III
LITERATURE REVIEW
This chapter provides comprehensive survey of literature on the topic of insurance
sector liberalization and related trends. Insurance markets worldwide have changed in the last
two decades. Liberalization, deregulation, globalization of insurance institutions, intensified
competition, electronic commerce etc. are among the challenges faced by insurance markets
now.
Balasubramanian, T.S. and S.P. Gupta,(2000) in their book on “Insurance Business
Environment” explain at length the global and Indian pictures of Insurance systems. The
impact of globalization and also liberalization on Insurance business environment is also
discussed analytically to have a clear understanding of the challenges faced by the insurance
industry.
Srivastava, D.C. and Srivastava, S. (2001) in their book on “Indian Insurance
Industry–Transition and Prospects” discuss analytically the financial significance of
insurance industry, its contribution to Indian economy and also the transitory prospects and
challenges of insurance industry due to liberalization and the opening up of the sector to
private players.
Rajendran and Natarajan (2009) found out the remarkable improvements that the
acceptance and adaptation of Liberalization Privatization and Globalization has brought about
in the Indian Life Insurance Industry specifically to LIC of India. They first compared the
overall performance of LIC of India between pre and post LPG era and secondly examined
the current status, volume of competitions and challenges faced by LIC of India. The growth
of LIC was compared in terms performance indicators such as annual business, 50 business in
force, group business in force and life fund between the period 1957 and 2007.For this they
have taken the secondary data from the annual reports of LIC of India. Their analysis
concluded that LPG was incorporating a positive influence on the performance of LIC of
India showing that the business in India, business outside India as well as the total business of
LIC of India was always in increasing trends.
Kshetrimayum Sobita Devi (2011) in her thesis on “A Study of the Impact of
Liberalization on the Indian Life Insurance Industry”, Ph.D. Thesis submitted to the
Department of Economics, University of The Maharaja Sayajirao University of Baroda,
Vadodara, 2011. Confirms a general opinion that innovativeness in every activity alone rules
A STUDY OF THE IMPACT OF LIBERALIZATION ON THE INDIAN LIFE INSURANCE INDUSTRY
Page 25
and dominates the industry. But, at the same time, the practicality and economic justification
of that innovativeness are also to be analyzed.
All these studies most of the studies available analyzed Indian industry scenario in
varying aspects such as emerging strategic and regulatory issues in light of liberalization,
appraisal of industry development, structure, innovation etc. My Project attempts to
contribute to field of insurance sector research by examining the changing industry scenario
in terms of concentration, efficiency and other benefits of insurance reforms.
A STUDY OF THE IMPACT OF LIBERALIZATION ON THE INDIAN LIFE INSURANCE INDUSTRY
Page 26
CHAPTER- IV
DATA ANALYSIS AND INTERPRETATION
Therefore the study has limited itself to analyze and interpret the impact of insurance
liberalization on the topics of Concentration, Efficiency and Innovation. In analyzing these
topics, the methodology and variables used are also restricted to the available data.
4.1- CONCENTRATION
Concept –
Market concentration is commonly used to represent the level of market competition.
Concentration may have far-ranging and long-lasting implications for financial sector
efficiency, stability, competitiveness. The concept of industrial concentration has been
extensively discussed and debated in the economic literature. Despite the many different
approaches to its measurement, general agreement prevails about the constituting elements of
concentration measures, i.e. the number of firms (fewness) and the distribution of firm sizes
(inequality) in a given market.
Methodology –
Market share identifies the shares of specific firms within a market. This study
measures market shares of life insurers. For this project, concentration ratios (CR),
Herfindahl Hirschman index (HHI) is calculated taking market shares in terms of Total
premium and Equity share capital. The concentrations measures are calculated for each
insurance company for each year from 2001-02 to 2012-13. The HHI and CR1 and CR4 is
calculated for all the life insurance firms with and without LIC of India. Because LIC still
plays dominant role in life insurance industry and so an index excluding its share may give a
fair knowledge of competition among the private players after liberalization.
Concentration Ratio (CR):
The concentration ratio is the measure of the percentage market share in an industry
held by the largest firms within that industry. For example, if 3 firms dominate a specific
industry, holding 80% market share of the industry, the concentration ratio of the industry
would thus be 80%. So the market share of the K firms in the market takes the form given
below, giving equal emphasis to the k leading firms, but neglecting the many small firms in
the market.
A STUDY OF THE IMPACT OF LIBERALIZATION ON THE INDIAN LIFE INSURANCE INDUSTRY
Page 27
There are no rules for the determination of values of the k, so that the number of firms
included in the concentration index is a rather arbitrary decision. The concentration ratio may
be considered as one point on the concentration curve, and it is a one-dimensional measure
ranging between zero and unity. The index approaches zero for an infinite number of equally
sized firms (given that the k chosen for the calculation of the concentration ratio is
comparatively small as compared to the total number of firms) and it equals unity if the firms
included in the calculation of the concentration ratio make up the entire industry.
For this study concentration ratio are calculated taking the value of k as 1 (CR1) and
4(CR4) respectively. CR1 is calculated to determine the share of top company. The Four
Firm Concentration Ratio (CR4) calculates the market share of the top four companies in the
industry. This calculation determines if an industry is an oligopoly, a monopoly or neither. A
Four Firm Concentration Ratio below 40 percent shows there is monopolistic competition. A
Four Firm Concentration Ratio above 60 percent shows there is an oligopoly.
Herfindahl-Hirschman Index (HHI):
It measures the size of the firm in relation to the industry and so indicates the amount
of competition among them. The Herfindahl-Hirschman Index (HHI) of competition
therefore is a measure of the competitiveness of a market overall. It is not a measure specific
to any one insurer, though it is a function of each insurer„s market share. The herfindahl
index stresses the importance of larger firms by assigning them a greater weight than smaller
firms, and it incorporates each firms individually, so that arbitrary cut-offs and insensitivity
to the share distribution are avoided.
Where Si is the market share of the firm i, The HHI index ranges between 1/ n and 1,
reaching its lowest value (the reciprocal of the number of firms) when all firms in a market
are of equal size, and reaching unity in the case of monopoly. So a decrease in the H indicates
A STUDY OF THE IMPACT OF LIBERALIZATION ON THE INDIAN LIFE INSURANCE INDUSTRY
Page 28
an increase in competition. The maximum value of HHI will be 1 when there is monopoly
and the minimum value of HHI is 1/n if there are n firms of equal size.
A STUDY OF THE IMPACT OF LIBERALIZATION ON THE INDIAN LIFE INSURANCE INDUSTRY
Page 29
Table 4.1: Market share and herfindahl index of all life insurance firms (Total Premium)
Insurers
2001-
02
2002-
03
2003-
04
2004-
05
2005-
06
2006-
07
2007-
08
2008-
09
2009-
10
2010-
11
2011-
12
2012-
13 (Si)
Si2
LIC 0.9946 0.9799 0.9532 0.9067 0.8575 0.8245 0.7439 0.7092 0.7010 0.6978 0.7067 0.7270 0.5285
ICICI 0.0023 0.0075 0.0148 0.0285 0.0402 0.0510 0.0674 0.0692 0.0623 0.0613 0.0488 0.0471 0.0022
Max 0.0008 0.0017 0.0032 0.0050 0.0074 0.0097 0.0135 0.0174 0.0183 0.0199 0.0222 0.0231 0.0005
HDFC 0.0007 0.0027 0.0045 0.0083 0.0148 0.0184 0.0241 0.0251 0.0264 0.0309 0.0355 0.0394 0.0016
Birla 0.0006 0.0026 0.0081 0.0110 0.0119 0.0115 0.0163 0.0206 0.0207 0.0195 0.0205 0.0182 0.0003
Tata 0.0004 0.0015 0.0038 0.0060 0.0083 0.0088 0.0102 0.0124 0.0132 0.0137 0.0127 0.0096 0.0001
SBI 0.0003 0.0013 0.0034 0.0073 0.0102 0.0189 0.0279 0.0325 0.0381 0.0443 0.0458 0.0364 0.0013
Kotak 0.0002 0.0007 0.0023 0.0056 0.0059 0.0063 0.0084 0.0106 0.0108 0.0102 0.0102 0.0097 0.0001
Bajaj 0.0001 0.0012 0.0033 0.0121 0.0296 0.0278 0.0483 0.0479 0.0430 0.0329 0.0261 0.0240 0.0006
ING V. 0.0001 0.0004 0.0013 0.0041 0.0040 0.0046 0.0058 0.0065 0.0062 0.0059 0.0059 0.0061 0.0000
Met 0.0000 0.0001 0.0004 0.0010 0.0019 0.0032 0.0058 0.0090 0.0096 0.0086 0.0093 0.0085 0.0001
Reliance 0.0000 0.0001 0.0005 0.0013 0.0021 0.0065 0.0160 0.0222 0.0249 0.0225 0.0192 0.0141 0.0002
Aviva -- 0.0002 0.0012 0.0031 0.0057 0.0074 0.0094 0.0090 0.0090 0.0081 0.0084 0.0075 0.0001
Sahara -- -- -- 0.0000 0.0003 0.0003 0.0007 0.0009 0.0009 0.0008 0.0008 0.0007 0.0000
Shriram -- -- -- -- 0.0001 0.0012 0.0018 0.0020 0.0023 0.0028 0.0022 0.0022 0.0000
Bharti -- -- -- -- -- 0.0001 0.0006 0.0016 0.0025 0.0027 0.0027 0.0026 0.0000
Future -- -- -- -- -- -- 0.0000 0.0007 0.0020 0.0025 0.0027 0.0024 0.0000
IDBI -- -- -- -- -- -- 0.0001 0.0014 0.0022 0.0028 0.0026 0.0028 0.0000
Canara H -- -- -- -- -- -- -- 0.0013 0.0032 0.0053 0.0065 0.0067 0.0000
DLF Par -- -- -- -- -- -- -- 0.0000 0.0006 0.0003 0.0006 0.0008 0.0000
Aegon R -- -- -- -- -- -- -- 0.0001 0.0001 0.0013 0.0016 0.0149 0.0002
Staruni -- -- -- -- -- -- -- 0.0002 0.0020 0.0032 0.0044 0.0037 0.0000
IndiaFirst -- -- -- -- -- -- -- -- 0.0008 0.0027 0.0045 0.0059 0.0000
EdelwT -- -- -- -- -- -- -- -- -- -- 0.0000 0.0001 0.0000
Sum 1.0000 1.0000 1.0000 1.0000 1.0000 1.0000 1.0000 1.0000 1.0000 1.0000 1.0000 1.0000 0.5359
HHI 0.989 0.960 0.909 0.823 0.739 0.684 0.563 0.513 0.501 0.496 0.507 0.536 --
A STUDY OF THE IMPACT OF LIBERALIZATION ON THE INDIAN LIFE INSURANCE INDUSTRY
Page 30
Table 4.2: Market share and herfindahl index for all private life firms (total premium)
Insurers
2001-
02
2002-
03
2003-
04
2004-
05
2005-
06
2006-
07
2007-
08
2008-
09
2009-
10
2010-
11
2011-
12
2012-
13
(Si)
Si2
ICICI 0.4270 0.3732 0.3170 0.3059 0.2825 0.2908 0.2630 0.2381 0.2083 0.2029 0.1665 0.1726 0.0298
Max 0.1429 0.0863 0.0690 0.0535 0.0523 0.0551 0.0526 0.0598 0.0612 0.0660 0.0759 0.0847 0.0072
HDFC 0.1228 0.1330 0.0954 0.0889 0.1041 0.1050 0.0942 0.0863 0.0883 0.1022 0.1211 0.1444 0.0209
Birla 0.1037 0.1286 0.1723 0.1185 0.0835 0.0653 0.0635 0.0709 0.0694 0.0664 0.0699 0.0665 0.0044
Tata 0.0776 0.0726 0.0813 0.0643 0.0584 0.0503 0.0397 0.0426 0.0440 0.0452 0.0431 0.0352 0.0012
SBI 0.0539 0.0647 0.0723 0.0778 0.0713 0.1076 0.1090 0.1118 0.1273 0.1465 0.1560 0.1333 0.0178
Kotak 0.0278 0.0360 0.0483 0.0603 0.0412 0.0357 0.0328 0.0363 0.0361 0.0338 0.0349 0.0354 0.0013
Bajaj 0.0262 0.0618 0.0708 0.1296 0.2077 0.1581 0.1886 0.1647 0.1439 0.1090 0.0889 0.0879 0.0077
ING V. 0.0154 0.0189 0.0284 0.0439 0.0282 0.0260 0.0225 0.0224 0.0207 0.0194 0.0199 0.0222 0.0005
Met 0.0018 0.0071 0.0092 0.0106 0.0137 0.0181 0.0225 0.0310 0.0320 0.0285 0.0318 0.0310 0.0010
Reliance 0.0010 0.0058 0.0100 0.0138 0.0149 0.0369 0.0626 0.0765 0.0832 0.0745 0.0653 0.0516 0.0027
Aviva -- 0.0120 0.0261 0.0328 0.0398 0.0422 0.0367 0.0309 0.0300 0.0266 0.0287 0.0273 0.0007
Sahara -- -- -- 0.0002 0.0018 0.0019 0.0028 0.0032 0.0032 0.0028 0.0027 0.0026 0.0000
Shriram -- -- -- -- 0.0007 0.0067 0.0069 0.0068 0.0077 0.0093 0.0076 0.0079 0.0001
Bharti -- -- -- -- -- 0.0003 0.0023 0.0056 0.0084 0.0090 0.0092 0.0095 0.0001
Future -- -- -- -- -- -- 0.0000 0.0024 0.0068 0.0082 0.0092 0.0086 0.0001
IDBI -- -- -- -- -- -- 0.0002 0.0049 0.0072 0.0092 0.0088 0.0103 0.0001
CanaraH -- -- -- -- -- -- -- 0.0046 0.0106 0.0174 0.0221 0.0243 0.0006
DLF Par -- -- -- -- -- -- -- 0.0001 0.0021 0.0010 0.0020 0.0030 0.0000
AegonR -- -- -- -- -- -- -- 0.0005 0.0005 0.0044 0.0054 0.0054 0.0000
Star U -- -- -- -- -- -- -- 0.0008 0.0067 0.0106 0.0151 0.0136 0.0002
India F -- -- -- -- -- -- -- -- 0.0025 0.0091 0.0154 0.0216 0.0005
EdelwT -- -- -- -- -- -- -- -- -- -- 0.0001 0.0007 0.0000
Sum 1.0000 1.0000 1.0000 1.0000 1.0000 1.0000 1.0000 1.0000 1.0000 1.0000 1.0000 1.0000 0.0967
Pvt HHI 0.2392 0.1961 0.1649 0.1523 0.1565 0.1475 0.1413 0.1239 0.1096 0.1052 0.0961 0.0967 --
A STUDY OF THE IMPACT OF LIBERALIZATION ON THE INDIAN LIFE INSURANCE INDUSTRY
Page 31
Results Analysis:
In terms of total premium, year wise market share of different life insurance firms is
shown in table 4.1 and 4.2 respectively with their HHI. In all the years taken, LIC dominated
the industry though its share was decreasing over the years. Till 2004-05, it occupied 90% of
the total premium but was reduced to 70% & 69% in 2010 and 2011 respectively. But after
that LIC dominated the industry and increase its market share (in terms of total premium)
again in 2012 and 2013 as 70% and 72% respectively. All the private life insurers have
shown increasing market share over the years. ICICI, Bajaj, SBI, and HDFC, has market
share of 4 percent, 2 percent 3 percent and 3 percent in 2012-13 respectively. The herfindahl
index of industry was reducing over the years with 0.0989 in 2001-02 to 0.0536 in 2012-13.
The herfindahl index of private industry was reducing over the years with 0.2392 in
2001-02 to 0.0967 in 2012-13. ICICI started with 42 percent market share but reduced in
successive years to 17% in 2012-13. It however, dominated the private insurance market
throughout the years. SBI has shown increasing trend of market share except in 2005-06 and
2013. Its market share increased significantly with a mere 5% in 2001-02 to 13 % in 2012-13.
Bajaj has also increased it share from 2% in 2001-02 to 8 % in 2012-13.
A STUDY OF THE IMPACT OF LIBERALIZATION ON THE INDIAN LIFE INSURANCE INDUSTRY
Page 32
Insurers
2001-
02
2002-
03
2003-
04
2004-
05
2005-
06
2006-
07
2007-
08
2008-
09
2009-
10
2010-
11
2011-
12
2012-
13
(Si)
Si2
LIC 0.0030 0.0022 0.0015 0.0011 0.0008 0.0006 0.0004 0.0003 0.0002 0.0002 0.0040 0.0039 0.0000
ICICI 0.1138 0.1902 0.2081 0.2125 0.2011 0.1615 0.1139 0.0782 0.0679 0.0603 0.0573 0.0560 0.0031
Max 0.1498 0.1141 0.1067 0.1071 0.0946 0.0902 0.0840 0.0977 0.0875 0.0778 0.0780 0.0762 0.0058
HDFC 0.1007 0.0976 0.0788 0.0735 0.1052 0.0986 0.1034 0.0984 0.0936 0.0843 0.0800 0.0782 0.0061
Birla 0.0899 0.0806 0.0894 0.0804 0.0781 0.0827 0.1036 0.1030 0.0937 0.0832 0.0789 0.0772 0.0060
Tata 0.1108 0.0828 0.0712 0.0737 0.0759 0.0673 0.0708 0.0832 0.0914 0.0825 0.0784 0.0766 0.0059
SBI 0.0749 0.0560 0.0540 0.0804 0.0721 0.0615 0.0813 0.0548 0.0476 0.0422 0.0401 0.0392 0.0015
Kotak 0.0605 0.0588 0.0466 0.0486 0.0415 0.0407 0.0391 0.0280 0.0243 0.0215 0.0205 0.0200 0.0004
Bajaj 0.0899 0.0672 0.0463 0.0345 0.0255 0.0185 0.0123 0.0083 0.0072 0.0063 0.0060 0.0059 0.0000
ING V. 0.0659 0.0761 0.0755 0.0747 0.0832 0.0849 0.0642 0.0558 0.0485 0.0619 0.0588 0.0574 0.0033
Met 0.0659 0.0492 0.0493 0.0540 0.0399 0.0652 0.0619 0.0866 0.0844 0.0832 0.0790 0.0789 0.0062
Reliance 0.0749 0.0560 0.0493 0.0499 0.0562 0.0817 0.0933 0.0636 0.0554 0.0492 0.0480 0.0469 0.0022
Aviva -- 0.0693 0.0749 0.0735 0.0779 0.0933 0.0817 0.0817 0.0899 0.0847 0.0804 0.0786 0.0062
Sahara -- -- 0.0484 0.0361 0.0266 0.0193 0.0189 0.0127 0.0110 0.0098 0.0093 0.0091 0.0001
Shriram -- -- -- -- 0.0212 0.0154 0.0102 0.0068 0.0059 0.0073 0.0070 0.0069 0.0000
Bharti -- -- -- -- 0.0002 0.0185 0.0298 0.0366 0.0538 0.0644 0.0689 0.0708 0.0050
Future -- -- -- -- -- -- 0.0150 0.0257 0.0334 0.0444 0.0483 0.0569 0.0032
IDBI -- -- -- -- -- -- 0.0163 0.0247 0.0214 0.0295 0.0321 0.0313 0.0010
CanaraH -- -- -- -- -- -- -- 0.0219 0.0238 0.0295 0.0321 0.0372 0.0014
DLFPar. -- -- -- -- -- -- -- 0.0075 0.0105 0.0124 0.0122 0.0125 0.0002
AegonR -- -- -- -- -- -- -- 0.0164 0.0271 0.0401 0.0455 0.0461 0.0021
Star U -- -- -- -- -- -- -- 0.0082 0.0119 0.0105 0.0100 0.0098 0.0001
India F -- -- -- -- -- -- -- -- 0.0095 0.0137 0.0191 0.0186 0.0003
EdelWT -- -- -- -- -- -- -- -- -- -- 0.0060 0.0058 0.0000
Sum 1.0000 1.0000 1.0000 1.0000 1.0000 1.0000 1.0000 1.0000 1.0000 1.0000 1.0000 1.0000 0.0603
HHI 0.0975 0.0993 0.0997 0.1016 0.0988 0.0889 0.0799 0.0717 0.0680 0.0632 0.0606 0.0602 --
Table 4.3: Market share and HHI of all life insurance firms (Equity share capital)
A STUDY OF THE IMPACT OF LIBERALIZATION ON THE INDIAN LIFE INSURANCE INDUSTRY
Page 33
Table 4.4: Market share and HHI of all private life insurance firms (Equity share capital)
Insurers
2001-
02
2002-
03
2003-
04
2004-
05
2005-
06
2006-
07
2007-
08
2008-
09
2009-
10
2010-
11
2011-
12
2012-
13
(Si)
Si2
ICICI 0.1142 0.1907 0.2084 0.2128 0.2013 0.1616 0.1140 0.0782 0.0679 0.0605 0.0576 0.0560 0.0031
Max 0.1502 0.1144 0.1069 0.1072 0.0947 0.0902 0.0840 0.0977 0.0875 0.0778 0.0782 0.0765 0.0059
HDFC 0.1010 0.0978 0.0789 0.0736 0.1053 0.0987 0.1034 0.0984 0.0936 0.0848 0.0805 0.0782 0.0061
Birla 0.0901 0.0807 0.0895 0.0805 0.0781 0.0827 0.1037 0.1030 0.0937 0.0835 0.0789 0.0772 0.0060
Tata 0.1112 0.0830 0.0713 0.0738 0.0759 0.0674 0.0708 0.0833 0.0914 0.0828 0.0787 0.0766 0.0059
SBI 0.0751 0.0561 0.0540 0.0805 0.0722 0.0616 0.0814 0.0548 0.0476 0.0422 0.0401 0.0392 0.0015
Kotak 0.0607 0.0589 0.0467 0.0487 0.0415 0.0407 0.0391 0.0280 0.0243 0.0215 0.0205 0.0200 0.0004
Bajaj 0.0901 0.0673 0.0463 0.0345 0.0255 0.0185 0.0123 0.0083 0.0072 0.0063 0.0060 0.0059 0.0000
ING V. 0.0661 0.0763 0.0756 0.0748 0.0832 0.0850 0.0643 0.0558 0.0485 0.0619 0.0592 0.0574 0.0033
Met 0.0661 0.0493 0.0494 0.0541 0.0399 0.0653 0.0619 0.0866 0.0845 0.0834 0.0790 0.0789 0.0062
Reliance 0.0751 0.0561 0.0494 0.0499 0.0562 0.0818 0.0934 0.0636 0.0554 0.0492 0.0480 0.0469 0.0022
Aviva -- 0.0694 0.0750 0.0736 0.0779 0.0934 0.0817 0.0818 0.0899 0.0849 0.0804 0.0786 0.0062
Sahara -- -- 0.0485 0.0361 0.0267 0.0193 0.0189 0.0127 0.0110 0.0098 0.0093 0.0091 0.0001
Shriram -- -- -- -- 0.0212 0.0154 0.0102 0.0069 0.0059 0.0073 0.0070 0.0069 0.0000
Bharti -- -- -- -- 0.0002 0.0185 0.0298 0.0366 0.0538 0.0645 0.0691 0.0708 0.0050
Future -- -- -- -- -- -- 0.0151 0.0257 0.0334 0.0444 0.0483 0.0569 0.0032
IDBI -- -- -- -- -- -- 0.0163 0.0247 0.0214 0.0295 0.0321 0.0313 0.0010
CanaraH -- -- -- -- -- -- -- 0.0219 0.0238 0.0295 0.0322 0.0372 0.0014
DLFPar. -- -- -- -- -- -- -- 0.0075 0.0105 0.0124 0.0124 0.0125 0.0002
AegonR -- -- -- -- -- -- -- 0.0164 0.0271 0.0401 0.0455 0.0461 0.0021
Star U -- -- -- -- -- -- -- 0.0082 0.0119 0.0105 0.0100 0.0098 0.0001
India F -- -- -- -- -- -- -- -- 0.0095 0.0137 0.0191 0.0186 0.0003
EdleWT -- -- -- -- -- -- -- -- -- -- 0.0060 0.0059 0.0000
Sum 1.0000 1.0000 1.0000 1.0000 1.0000 1.0000 1.0000 1.0000 1.0000 1.0000 1.0000 1.0000 0.0603
Pvt.HHI 0.0981 0.0998 0.1000 0.1019 0.0990 0.0890 0.0800 0.0718 0.0680 0.0635 0.0609 0.0603 --
A STUDY OF THE IMPACT OF LIBERALIZATION ON THE INDIAN LIFE INSURANCE INDUSTRY
Page 34
The market share of life insurance industry in terms of equity share capital and HHI is
shown in table 4.3 and that of private life insurers in terms of equity share capital and HHI is
shown in table 4.4. The market share of LIC was decreasing over the years standing 0.02 %
in 2010 from 0.03% in 2002. This is because LIC equity share was fixed at 5 crore only while
the total equity share capital of the industry was increasing with the increase in private
insurers. But, in 2010-11 during the year LIC increased its equity capital and its market share
goes up to 0.04%. The HHI of the industry is at 0.09 in the first three years and increased to
0.10 in 2005. From 2006 onwards it was decreasing to 0.060 in 2013.
Among private insurers, the market share of Max, ICICI and SBI was highest in 2002
but only ICICI stood highest for 6 years from 2003 to 2008. The market share of Bajaj was
decreasing over the years standing 0.005 % in 2013 from 0.09% in 2002. In 2010, PNB Met
stood first among life insurers in market share of equity share. The HHI of the private
insurers was at 0.09 in the first two years and increased to 0.10 in 2004 and 2005. From 2006
onwards it was decreasing to reach 0.060 in 2013.
A STUDY OF THE IMPACT OF LIBERALIZATION ON THE INDIAN LIFE INSURANCE INDUSTRY
Page 35
Chart 4.1-HHI of life insurance industry
(Total Premium and Equity Share Capital)
Chart 4.1 shows the graphical representation of HHI of all Life Insurance Industry
from table 4.1 and 4.3.
0
0.1
0.2
0.3
0.4
0.5
0.6
0.7
0.8
0.9
1
0.9890
0.9600
0.9090
0.8230
0.7390
0.6840
0.5630
0.5130 0.5010 0.4960 0.5070
0.5360
0.2392
0.1961
0.1649 0.1523 0.1565 0.1475 0.1413 0.1239 0.1096 0.1052 0.0961 0.0967
Herfindahl-Hirschman Index (HHI)
HHI(Total Premium) HHI (Total Equity Capital)
A STUDY OF THE IMPACT OF LIBERALIZATION ON THE INDIAN LIFE INSURANCE INDUSTRY
Page 36
Table 4.5: HHI, CR1and CR4 compared (Total Premium)
Year
2001-
02
2002-
03
2003-
04
2004-
05
2005-
06
2006-
07
2007-
08
2008-
09
2009-
10
2010-
11
2011-
12
2012-
13
No‟s of Insurers 12 13 13 14 15 16 18 22 23 23 24 24
Industry
Total
HHI 0.9890 0.9600 0.9090 0.8230 0.7390 0.6840 0.5630 0.5130 0.5010 0.4960 0.5070 0.5360
Pvt. HHI 0.2392 0.1961 0.1649 0.1523 0.1565 0.1475 0.1413 0.1239 0.1096 0.1052 0.0961 0.0967
CR1 (%) 99.46 97.99 95.32 90.67 85.75 82.45 74.39 70.92 70.10 69.78 70.67 72.07
CR4 (%) 99.84 99.27 98.06 95.83 94.21 92.22 88.75 85.88 84.44 83.63 83.68 84.99
Table 4.6: HHI, CR1and CR4 compared (Total Equity Capital)
Year
2001-
02
2002-
03
2003-
04
2004-
05
2005-
06
2006-
07
2007-
08
2008-
09
2009-
10
2010-
11
2011-
12
2012-
13
No‟s of Insurers 12 13 13 14 15 16 18 22 23 23 24 24
Industry
Total
HHI 0.0975 0.0993 0.0997 0.1016 0.0988 0.0889 0.0799 0.0717 0.0680 0.0632 0.0606 0.0602
Pvt. HHI 0.0981 0.0998 0.1000 0.1019 0.0990 0.0890 0.0800 0.0718 0.0680 0.0635 0.0609 0.0603
CR1 (%) 14.98 19.02 20.81 21.25 20.11 16.15 11.39 10.30 09.37 09.32 09.44 09.71
CR4 (%) 47.51 48.47 48.30 48.04 48.41 44.36 41.42 38.57 36.86 33.60 31.88 31.29
A STUDY OF THE IMPACT OF LIBERALIZATION ON THE INDIAN LIFE INSURANCE INDUSTRY
Page 37
In Table 4.5, HHI and Concentration Ratios (CR1 and CR4) are shown in terms of
total premium. The HHI decreasing over the years from 2001-02 to 2012-13. For the industry
total, HHI decreased from 0.99 in 2001-02 to 0.53 in 2012-13, the HHI decreased from 0.23
in 2001-02 to 0.09 in 2012-13. In terms of total premium, the concentration was almost
reduced to half since monopoly regime of LIC and the competition among private insurers
was also increasing over the period. This was also evident from the CR1 which is decreasing
over the years. The CR4 was also decreasing over the years.
In Table 4.6, HHI and Concentration Ratios (CR1 and CR4) in terms of equity share
capital are shown. The HHI of industry as well as private insurers showed a similar trends
wherein both were decreasing since 2006. However the indices showed a slight increase till
the year 2005. The equity share of LIC was constant at 5 Crores in all the years and so the
fluctuations may be due to increase in private players. For the industry total, HHI decreased
from 0.09 in 2002 to 0.06 in 2013. In case of private insurers, the HHI decreased from 0.098
in 2002 to 0.060 in 2010. The CR1 was fluctuating over the years. The CR4 also changed
from year to year. The average CR4 of the 09 years taken was at around 45%.
A STUDY OF THE IMPACT OF LIBERALIZATION ON THE INDIAN LIFE INSURANCE INDUSTRY
Page 38
4.2- EFFICIENCY
Concept of Efficiency-
Efficiency refers to how well firms are performing relative to the
existing technology in the industry. The concept of economic efficiency flows directly from
the microeconomic theory of firm. In microeconomic theory of firm, production (or
economic) efficiency is decomposed into technical and Allocative efficiency.
Estimation Technique-
Firm performances can be measured using various methods;
conventional financial ratios such as return on assets (ROA), return on equity (ROE), expense
to premium ratios etc. For this project select ROA, ROE and Expense Ratio to analyse the
financial potion of firms. The above Ratios are calculated for LIC and Top 5 private sector
insurance companies for last 5 years from 2008-09 to 2012-13.
ROE indicates the return a company is generating on the owners'
investments. As a general rule for insurance companies, ROE should lie between 10-15%.
ROA indicates the return a company is generating on the firm's investments /assets. In
general, a life insurer should have an ROA that falls in the 0.5-1% range.
A measure of what it costs an investment company to operate its funds. An expense
ratio is determined through an annual calculation, where a fund's operating expenses are
A STUDY OF THE IMPACT OF LIBERALIZATION ON THE INDIAN LIFE INSURANCE INDUSTRY
Page 39
divided by the average value of its assets under management. expense ratios are calculated by
dividing each item of expenses or group of expense with the net sales to analyze the cause of
variation of the operating ratio.
Table 4.7: Ratio Analysis of LIC and private sector top 5 firms.
Name of the Insurer 2008-09 2009-10 2010-11 2011-12 2012-13
Public Sector
LIC
ROE 191.47 212.14 234.36 13.13 14.38
ROA .0011 .0009 .0009 .0010 .0009
Expense Ratio .0577 .0658 .0835 .0735 .0801
Private Sector
SBI Life
ROE -.0263 .2765 .3663 .5558 .6222
ROA -.0019 .0098 .0093 .0118 .0119
Expense Ratio .0862 .0656 .0710 .0783 .1109
ICICI Prudential
ROE -.5463 .1806 .5654 .9687 1.0469
ROA -.0213 .0043 .0115 .0193 .0201
Expense Ratio .1789 .1559 .1228 .1441 .1519
HDFC Standard
ROE -.2801 -.1398 -.0496 .1359 .2263
ROA -.0429 -.0127 -.0035 .0081 .0110
Expense Ratio .3189 .2170 .1670 .1251 .1194
Bajaj Allianz
ROE -.4690 .3598 .7013 .8700 .8530
ROA -.0040 .0164 .0269 .0332 .0335
Expense Ratio .1769 .1555 .1678 .1892 .2341
Birla SunLife
ROE -.3736 -.2211 .1549 .2339 .2749
ROA -.0655 -.0241 .0142 .0206 .0225
Expense Ratio .2765 .2445 .2151 .2114 .2296
Note: Calculated from the various Annual Reports of IRDA, respective Insurers. 1. Return on
Equity (Net profit per Equity). 2.Return on Assets (Net profit per Assets) 3. Underwriting
Expenses to Net Written Premiums.
Table 4.7 represent the efficiency of LIC and private sector top 5 life insurers. The
return on assets (ROA) also known as investment income ratio (investment income per
investment assets) of the life insurers under review. The ROA analysis vehemently supports
the evaluation made herein above under ROE thus all life insurers under review recorded
satisfactory performance of the net income to total assets. Moreover, the Bajaj Allianz flag its
banner on the top in the sector by recording a high performance the ratio was stood at 0.0335
(i.e. 3.35 per cent) the Birla SunLife stood at 0.0225 (i.e. 2.25 per cent) and the ICICI
Prudential stood at 0.0201 (i.e.2.01 per cent) during 2012-13. Expenses ratio (underwriting
expenses to net written premium) of the life insurers under review.
A STUDY OF THE IMPACT OF LIBERALIZATION ON THE INDIAN LIFE INSURANCE INDUSTRY
Page 40
4.3- INNOVATIONS
Innovations are the introduction or adoption of new ideas, process, product or
services, developed internally or acquired from external environment. The adoption of
innovation flows from and is contingent upon an organization„s repertoire of technical,
strategic and administrative skills. Liberalization has given way for establishment of new
companies in Insurance sector and consequently competition is leading to innovation. The
innovation is discussed under the following headings –
 Products
 Quality of Customer Service
4.3.1: Products -
Products offered before liberalization and after liberalization are given in this section.
Before liberalization, the range of product available was very limited. India has an enormous
middle class that can afford to buy life insurance product as per their need. However after the
liberalization, there was a major change in the insurance product offered by the insurance
companies and insurance services covers opted for by the customers. It is difficult to specify
exact number of policies or product that LIC or others have, since time to time; some
products were introduced or withdrawn with small variation of time and may be counted as
new product.
Table 4.8 shown is the number of products offered by life insurance companies per
year. Of the 18 life insurance companies taken together, 4 companies were offering more than
10 products per year on an average, and only two companies have offered less than 5
products per year. The remaining 12 companies have on average offered more than 5 but less
than 10 products per year. The number of product offered was varied irrespective of the year
and there was no trend of either increasing or decreasing for all the companies. As of now,
the relationship between the number of product offered and the growth of the company is not
looking into but it is important to mention here that the number of product available in the
market has increased tremendously in the wake of liberalization.
For table 4.8 Data are taken from IRDA„s annual reports .The number of new product
launched in each year is mentioned here irrespective of whether withdrawn or not. The
company wise average is calculated for the year product was launched. In case of the year
where no product or riders were launched then that year is excluded from the average
calculation.
A STUDY OF THE IMPACT OF LIBERALIZATION ON THE INDIAN LIFE INSURANCE INDUSTRY
Page 41
Table-4.8: Number of products offered by life insurers in India
Year
2001-
02
2003 2004 2005 2006 2007 2008 2009 2010 2011 2012 2013
Company
wise
Total
1* Firms
Average
Rank
LIC 07 13 05 06 06 08 06 09 08 06 04 05 83 12 6.92 12
Aviva -- 18 10 04 02 24 18 12 16 18 01 06 129 11 11.73 02
Max NY 03 03 05 07 06 06 14 03 10 05 04 03 69 12 5.75 15
HDFC 06 02 07 04 05 11 04 13 19 17 05 06 99 12 8.25 08
ICICI 06 14 10 16 08 27 10 13 17 10 13 04 148 12 12.33 01
Met 03 12 07 06 02 08 07 05 16 07 05 05 83 12 6.92 13
SBI lIfe 06 05 09 02 04 09 13 05 14 14 10 06 97 12 8.08 11
Tata A 21 07 11 02 01 08 11 09 19 11 05 05 110 12 9.17 04
Birla S 07 05 01 02 06 18 09 06 14 24 04 08 104 12 8.67 06
Bajaj Al 08 05 13 10 06 15 14 16 22 13 08 08 138 12 11.50 03
ING Vys 06 05 04 04 05 09 07 03 10 11 07 02 73 12 6.08 14
Reliance 05 00 11 03 00 09 05 15 31 07 05 07 98 12 8.17 09
Kotak 07 09 05 10 04 17 07 09 16 11 03 05 103 12 8.58 07
Shriram -- -- -- -- 03 08 06 02 13 07 04 02 45 08 5.63 16
BhartiA -- -- -- -- -- 08 05 05 17 13 09 05 62 07 8.86 05
Futur G -- -- -- -- -- -- 04 13 11 10 07 04 49 06 8.17 10
IDBI Li -- -- -- -- -- -- 02 06 06 09 05 01 29 06 4.83 17
Year
wise
Total
85 98 98 82 61 191 144 147 264 197 101 83 1551 -- -- --
2*
12 12 13 14 14 16 18 18 18 18 18 18 18 -- -- --
Industry
Average
7.08 8.17 7.54 5.86 4.36 11.94 8.00 8.17 14.67 10.94 5.61 4.61 86.17 -- -- --
Source: Calculated from IRDA annual reports.
(1 is the number of years taken for average calculation. 2 is the number of companies taken for average calculation.)
A STUDY OF THE IMPACT OF LIBERALIZATION ON THE INDIAN LIFE INSURANCE INDUSTRY
Page 42
4.3.2: Quality of Customer Service –
With liberalization of insurance sector, it has become very important for insurers to
improve customer satisfaction and loyalty. In fact, service quality is an important means of
differentiation and path to achieve business success in the competitive environment.
Customer service is a derivative of a mix of human reactions influenced by a host stimuli
emanating from within and outside the organization. Any improvement in customer services
cannot be attained in isolation, unless the entire gamut of factors affecting it is taken into
account and managed properly. Customers and employees need active participation in the
process of developing a healthy relationship which involves a thorough overhaul of the
approach of insurance company towards customer relations management.
Keeping in view the two important dimensions of customer„s perceived quality
service viz. assurance and compliance, the quality of customer service is examined on the
point of the claim settlement of the life insurance firms.
 Status of claim Settlement –
Claim records of the insurance company give a fair idea of their payment history.
Claim settlement ratio, claim repudiation ratio and claim pending ratio are three important
parameters which would make us understand the quality of company„s trustworthiness. Claim
settlement ratio is the number of claims settled for every 100 claims received by the life
insurance company. For example if an insurance company has received 100 claims in a year
and it has settled 98 claims out of it, then the claim settlement ratio will be 98%. Higher is the
claim settlement ratio for the company, the better. Likewise claim repudiation ratio or claim
pending ratio are the number of claims repudiated or pending for every 100 claims received
by the life insurance company. Companies with lower claim repudiation or claim pending
ratio are considered good.
A STUDY OF THE IMPACT OF LIBERALIZATION ON THE INDIAN LIFE INSURANCE INDUSTRY
Page 43
Table 4.9: Claim Settlement ratio of all Life Insurers (In Percent)
Source: IRDA Annual Reports. *All figures are rounded to the nearest integer in %.
The payment history of private as well public insurer in case of death claim
Settlement Ratio for five years from 2008-09 to 2012-13. The claim settlement record of 24
life insurers on claim settled parameter is examined here.
For overall life insurance sector, LIC obviously stood top in all category and all the
years as highest claim receiver. ICICI, HDFC, Kotak, SBI, Birla are the private insurers those
who receive highest claims and its increasing year to year. For the industry, the number of
death claim was increasing over the years.
Sr. No Insurers 2008-09 2009-2010 2010-2011 2011-2012 2012-2013
1. LIC 96% 97% 97% 97% 98%
2. ICICI 90% 90% 95% 97% 96%
3. Max 60% 66% 78% 90% 94%
4. HDFC 89% 91% 95% 96% 96%
5. Birla 82% 89% 95% 91% 83%
6. Tata 73% 78% 82% 84% 84%
7. SBI 83% 82% 83% 95% 94%
8. Kotak 85% 87% 89% 92% 92%
9. Bajaj 79% 88% 89% 91% 89%
10. ING V. 81% 89% 90% 89% 84%
11. Met Life 78% 83% 85% 81% 84%
12. Reliance 78% 81% 89% 85% 86%
13. Aviva 74% 87% 84% 90% 88%
14. Sahara 42% 53% 63% 78% 85%
15. Shriram 29% 40% 56% 65% 67%
16. Bharti 68% 78% 87% 88% 89%
17. Future 29% 39% 51% 68% 71%
18. IDBI 44% 50% 65% 67% 80%
19. CanaraH 31% 39% 71% 81% 88%
20. DLFPar. 35% 40% 51% 24% 27%
21. AegonR 42% 48% 52% 66% 67%
22. Star U 54% 58% 81% 86% 90%
23. India F 48% 54% 82% 82% 71%
24. EdleWT NA NA NA 100% 45%
A STUDY OF THE IMPACT OF LIBERALIZATION ON THE INDIAN LIFE INSURANCE INDUSTRY
Page 44
CHAPTER- V
LIMITATION OF THE STUDY
There are many other issues or effects of liberalization and all of them cannot be
examined here. The main problem faced was the shortage of data. Due to time lag in
publishing official data, the data considered was from financial year 2001-02 to 2012-13.
Sometimes, there was lack of consistency and uniformity in the format of the data or
annual reports published. Therefore the study has limited itself to analyze and interpret the
impact of insurance liberalization on the topics of concentration and efficiency. In analyzing
these topics, the methodology and variables used are also restricted to the available data. The
results from this study need to be interpreted with some amount of caution as 12 years may
not be sufficient time for a complete overhaul of the industry, and many trends may only be
indicative.
The number of insurers are taken varies from analysis to analysis. In some cases, top
5 private sector insurers (in terms of total premium and net earnings) are taken for the study
instead of all the insurers, as the data pertaining to new entrants are not available or may
deteriorate the overall result. In some cases, 18 insurers are taken for calculations due to
unviability of data.
A STUDY OF THE IMPACT OF LIBERALIZATION ON THE INDIAN LIFE INSURANCE INDUSTRY
Page 45
CHAPTER- VI
CONCLUSION
The current reforms in Indian insurance sector have facilitated many functional
changes over the past decade. This project aims to provide an assessment of deregulation
with respect to industry scenario, concentration and efficiency in the Indian life insurance
industry.
The entry of private players in insurance was needful and justifiable in order to
enhance the efficiency. It also tries to find out how the reforms have benefited Indian life
insurance industry. An overview of present market scenario is compared to that of pre
liberalization market. The changes in market structure are examined in terms of market
concentration as well as insurers efficiency.
The insurance sector was seen to have many new entrants and made a robust
growth in terms of huge volume of business underwritten by the companies and overall
growth of the market. In addition, India is poised to experience major changes in its insurance
markets as insurers operate in an increasingly deregulated and liberalized environment.
Liberalization, deregulation, privatization and globalization of insurance sector
have been the major trend worldwide in the last two decades. Outcomes of the study on
deregulation and liberalization differ from analysis to analysis. On an average, the studies
reviewed shows that liberalization has positive impact on efficiency growth. Project study
relating to Indian industry covered varying aspects such as emerging strategic and regulatory
issues in light of liberalization, appraisal of industry development, structure, innovation etc.
The change in structure of life insurance with the coming of private insurers and the
intensity of changes is analyzed with CR1 (market share of largest insurer), CR4 (market
share of 4 largest insurer), Herfindahl Hirschman index (HHI) as well as ROA, ROE and
Expense ratio. These statistical technics shows the actual condition of industry as well as
insurance firm. Financial technics shows the financial positions of particular firms.
A STUDY OF THE IMPACT OF LIBERALIZATION ON THE INDIAN LIFE INSURANCE INDUSTRY
Page 46
BIBLIOGRAPHY
I - Books
 Balasubramanian, T.S. and S.P. Gupta,(2000) - “Insurance Business Environment”
 Srivastava, D.C. and Srivastava, S. (2001) -“Indian Insurance Industry–Transition and
Prospects”
II - Papers/Articles
 Kshetrimayum Sobita Devi (2011) “The Impact of Liberalization on the Indian Life
Insurance Industry”.
 Tapen Sinha, CRIS Discussion Paper Series-2002.X, the University of Nattingham,
Mexico.
 Bhave S.R (1970), Saga of Security: Story of Indian Life insurance (1870-1970).
 Goyal K. A. (2006) ―Impact of Globalization on Developing Countries (With
Special Reference to India) “International Research Journal of Finance and
Economics, ISSN 1450-2 887 Issue 5.
III -Web Resources
 www.avivaindia.com
 www.bajajallianz.com
 www.birlasunlife.com
 www.hdfcinsurance.com
 www.iciciprulife.com
 www.ingvysyalife.com
 www.irda.org.in
 www. insurance.kotak.com
 www.licindia.org
 www.maxnewyorklife.com
 www.metlife.co.in
 www.mospi.nic.in
 www.reliancelife.co.in
 www.sbilife.co.in
 www.sharalife.com
A STUDY OF THE IMPACT OF LIBERALIZATION ON THE INDIAN LIFE INSURANCE INDUSTRY
Page 47
 www.shriramlife.com
 www.swissre.com
 www.tata-aig-life.com
 www.wikipedia .com
 www.moneycontrol.com
 www.investopedia.com
http://calculator.tutorvista.com/math-calculator.html (For calculations of Logs and Antilog).
A STUDY OF THE IMPACT OF LIBERALIZATION ON THE INDIAN LIFE INSURANCE INDUSTRY
Page 48
Appendices
Table A.1- Total life insurance premium (Rs. Crore)
Insurers 2001-02 2002-03 2003-04 2004-05 2005-06 2006-07 2007-08 2008-09 2009-10 2010-11 2011-12 2012-13
LIC 49821.91 54628.49 63533.43 75127.29 90792.22 127822.80 149790.00 157288.04 186077.31 203473.40 202889.28 208803.58
ICICI 116.38 417.62 989.28 2363.82 4261.05 7912.99 13561.06 15356.22 16531.88 17880.63 14021.58 13538.24
Max 38.95 96.59 215.25 413.43 788.13 1500.28 2714.60 3857.26 4860.54 5812.63 6390.53 6638.70
HDFC 33.46 148.83 297.76 686.63 1569.91 2855.87 4858.56 5564.69 7005.10 9004.17 10202.40 11322.68
Birla 28.26 143.92 537.54 915.47 1259.68 1776.71 3272.19 4571.80 5505.66 5677.07 5885.36 5216.30
Tata 21.14 81.21 253.53 497.04 880.19 1367.18 2046.35 2747.50 3493.78 3985.22 3630.30 2760.43
SBI 14.69 72.39 225.67 601.18 1075.32 2928.49 5622.14 7212.10 10104.03 12911.64 13133.74 10450.03
Kotak 7.58 40.32 150.72 466.16 621.85 971.51 1691.14 2343.19 2868.05 2975.51 2937.43 2777.78
Bajaj 7.14 69.17 220.80 1001.68 3133.58 4302.74 9725.31 10624.52 11419.71 9609.95 7483.80 6892.70
ING V 4.19 21.16 88.51 338.86 425.38 707.20 1158.87 1442.28 1642.65 1708.95 1679.98 1742.36
Met 0.48 7.91 28.73 81.53 205.99 492.71 1159.54 1996.64 2536.01 2508.17 2677.50 2429.52
Reliance 0.28 6.47 31.06 106.55 224.21 1004.66 3225.44 4932.54 6604.90 6571.15 5497.62 4045.39
Aviva -- 13.47 81.50 253.42 600.27 1147.23 1891.88 1992.87 2378.01 2345.17 2415.87 2140.67
Sahara -- -- -- 1.74 27.66 51.00 143.49 206.47 250.59 243.41 225.95 205.38
Shriram -- -- -- -- 10.33 181.17 358.05 436.17 611.27 821.52 644.16 618.07
Bharti -- -- -- -- -- 7.78 118.41 360.41 669.73 792.02 774.16 744.52
Future -- -- -- -- -- -- 2.49 152.60 541.51 726.16 779.58 678.29
IDBI -- -- -- -- -- -- 11.90 318.97 571.12 811.00 736.70 804.68
CanarH -- -- -- -- -- -- -- 296.41 842.45 1531.86 1861.08 1912.15
DLFPra -- -- -- -- -- -- -- 3.37 165.65 95.04 167.01 236.79
AegoR -- -- -- -- -- -- -- 31.21 38.44 165.65 457.32 430.50
Star U -- -- -- -- -- -- -- 50.19 530.37 933.31 1271.95 1068.80
IndiaF -- -- -- -- -- -- -- -- 201.60 201.60 1297.93 1690.08
EdelWT -- -- -- -- -- -- -- -- -- -- 10.88 54.83
Pvt total 272.55 1119.06 3120.35 7727.51 15083.55 27207.52 51561.42 64497.41 79373.05 79369.94 84182.83 78398.91
I. Total 50094.46 55747.55 66653.78 82854.80 105875.80 155030.40 201351.40 221785.45 265450.36 265447.25 287072.11 287202.49
A STUDY OF THE IMPACT OF LIBERALIZATION ON THE INDIAN LIFE INSURANCE INDUSTRY
Page 49
Table A.2- Equity share capital of life insurers (Rs Crore)
Insurers 2002 2003 2004 2005 2006 2007 2008 2009 2010 2011 2012 2013
LIC 5.00 5.00 5.00 5.00 5.00 5.00 5.00 5.00 5.00 5.00 100.00 100.00
ICICI 190.00 425.00 675.00 925.00 1185.00 1312.30 1401.11 1427.26 1428.14 1428.46 1428.85 1428.94
Max 250.00 255.00 346.08 466.08 557.43 732.43 1032.43 1782.43 1838.82 1841.00 1944.69 1944.69
HDFC 168.00 218.00 255.50 320.00 620.00 801.26 1271.00 1796.00 1968.00 1994.88 1994.88 1994.88
Birla 150.00 180.00 290.00 350.00 460.00 671.50 1274.50 1879.50 1969.50 1969.50 1969.50 1969.50
Tata 185.00 185.00 231.00 321.00 447.00 547.00 870.00 1519.50 1920.50 1953.50 1953.50 1953.50
SBI 125.00 125.00 175.00 350.00 425.00 500.00 1000.00 1000.00 1000.00 1000.00 1000.00 1000.00
Kotak 101.00 131.30 151.26 211.76 244.58 330.35 480.27 510.29 510.29 510.29 510.29 510.29
Bajaj 150.00 150.03 150.07 150.07 150.23 150.37 150.71 150.70 150.71 150.71 150.71 150.71
ING V. 110.00 170.00 245.00 325.00 490.00 690.00 790.00 1019.15 1019.15 1464.88 1464.88 1464.88
Met 110.00 110.00 160.00 235.00 235.00 530.00 761.08 1580.00 1774.79 1969.57 1969.57 2012.88
Reliance 125.00 125.00 160.00 217.10 331.00 664.00 1147.70 1160.43 1164.65 1165.84 1196.32 1196.32
Aviva -- 154.80 242.80 319.80 458.70 758.20 1004.50 1491.80 1888.80 2004.90 2004.90 2004.90
Sahara -- -- 157.00 157.00 157.00 157.00 232.00 232.00 232.00 232.00 232.00 232.00
Shriram --- -- -- -- 125.00 125.00 125.00 125.00 125.00 175.00 175.00 175.00
Bharti -- -- -- -- 1.10 150.00 366.11 668.43 1131.35 1525.35 1718.65 1807.20
Future -- -- -- -- -- -- 185.00 468.50 702.00 1052.00 1203.00 1452.00
IDBI -- -- -- -- -- -- 200.00 450.00 450.00 700.00 800.00 800.00
Canara H -- -- -- -- -- -- -- 400.00 500.00 700.00 800.00 950.00
DLF Pra. -- -- -- -- -- -- -- 137.05 221.30 293.96 305.17 320.02
Aegon R -- -- -- -- -- -- -- 300.00 570.00 950.00 1135.00 1176.00
Star U -- -- -- -- -- -- -- 150.00 250.00 250.00 250.00 250.00
India First -- -- -- -- -- -- -- -- 200.00 325.00 475.00 475.00
EdelWT -- -- -- -- -- -- -- -- -- -- 150.00 150.00
Pvt total 1664.00 2229.13 3238.71 4347.81 5887.04 8119.41 12291.41 18248.04 21015.00 23656.85 24831.92 25418.72
Total 1669.00 2234.13 3243.71 4352.81 5892.04 8124.41 12296.41 18253.04 21020.00 23661.85 24931.92 25518.72

“A STUDY OF THE IMPACT OF LIBERALIZATION ON THE INDIAN LIFE INSURANCE INDUSTRY”

  • 1.
    A Project Report On “A STUDYOF THE IMPACT OF LIBERALIZATION ON THE INDIAN LIFE INSURANCE INDUSTRY” SUBMITTED TO: SAVITRIBAI PHULE PUNE UNIVERSITY BY: SOMNATH B. PAGAR UNDER THE GUIDANCE OF MS.NAMRATA DESHMUKH MBA II (2013-2015) MET‟S INSTITUTE OF MANAGEMENT NASHIK, MAHARASHTRA, INDIA - 422003.
  • 2.
    A STUDY OFTHE IMPACT OF LIBERALIZATION ON THE INDIAN LIFE INSURANCE INDUSTRY Page 1 CONTENTS Sr. No Particulars Page No. Preface Acknowledgement 1. Introduction 5 Organisation profile 7 1.1 Liberalization and Deregulation Concepts 12 1.2 Methodology of the Study 13 1.3 Objectives of the Study 14 2. An overview of Indian life insurance industry 2.1 Life insurance: defined 15 2.2 Indian life insurance-history 16 2.2.1 Pre nationalization phase 17 2.2.2 Nationalization and LIC„s monopoly regime (1956-2000) 20 3. Literature review 24 4. Data analysis and interpretation 26 4.1 Concentration 26 4.2 Efficiency 38 4.3 Innovations 40 4.3.1 Products 40 4.3.2 Quality of Customer Service 42 5. Limitation of the study 44 6. Conclusion 45 Bibliography 46 Appendices 48
  • 3.
    A STUDY OFTHE IMPACT OF LIBERALIZATION ON THE INDIAN LIFE INSURANCE INDUSTRY Page 2 TABLE OF CONTENTS FOR TABLES & CHARTS Sr. no Particulars Page no. Tables 1. 2.2(a): Milestones of insurance regulations in the 20th Century 16 2. 2.2.1(a): Number of life insurance companies: 1929-1939 17 3. 2.2.1(b): Growth of life Insurance business in India: 1914-1948 18 4. 2.2.1(c): Life insurance business in force in India: 1949-1955 19 5. 2.2.2(a): Growth statistics of LIC of India 21 6. 2.2.2(b): Performance of LIC from 1991-92 to 1999-00: Individual Assurance 21 7. 2.2.2(c): New policies issued and their market share 22 8. 2.2.2(d): Life insurance companies in India 23 9. 4.1: Market share and herfindahl index of all life insurance firms 29 10. 4.2: Market share and herfindahl index for all private life firms 30 11. 4.3: Market share and HHI of all life insurance firms 32 12. 4.4: Market share and HHI of all private life insurance firms 33 13. 4.5: HHI, CR1and CR4 compared (Total Premium) 36 14. 4.6: HHI, CR1and CR4 compared (Total Equity Capital) 36 15. 4.7: Ratio Analysis of LIC and private sector top 5 firms 39 16. 4.8: Number of products offered by life insurers in India 41 17. 4.9: Claim Settlement ratio of all Life Insurers 43 18. A.1- Total life insurance premium. 48 19. A.2- Equity share capital of life insurers. 48 Charts 1. Kotak Groups Financial Services 8 2. Management Hierarchy 9 3. Insurance Offered By Kotak Mahindra Old Mutual Life Insurance Ltd. 11 4. 4.1-HHI of life insurance industry 35
  • 4.
    A STUDY OFTHE IMPACT OF LIBERALIZATION ON THE INDIAN LIFE INSURANCE INDUSTRY Page 3 PREFACE Insurance market worldwide continues to undertake pro-competitive reform. As a consequent, dozens of countries have deregulated and liberalized their insurance markets. Insurance sector in India has also gone through the process of reforms following the recommendation of Malhotra Committee„s report submitted in1996. In the progression of events towards liberalization Insurance Regulatory and Development Bill (IRDA) was passed in 1999. This along with amendments to the LIC (and also GIC) Acts paves way for the entry of private players. Since then, India„s insurance sector is undergoing a radical change for the past decade. This study tries to give an overview of the impacts of liberalization and deregulation processes in Indian life insurance industry. With the liberalization, there is entry of private companies in Insurance sector with attendant changes. There are changes in terms of market concentration, product innovations, marketing strategy and use of technology for processes, all attributable to liberalization and deregulation. So it is very important to evaluate and understand various impacts in terms of competition, growth, development and future prospects in the sector. The issues covered in this analysis also include the efficiency and productivity improvement in the life insurance industry due to deregulation.
  • 5.
    A STUDY OFTHE IMPACT OF LIBERALIZATION ON THE INDIAN LIFE INSURANCE INDUSTRY Page 4 ACKNOWLEDGEMENTS In the preparation of this study, lots of people have helped me in some way or the other and therefore acknowledgements are due to them without whose co-operation, support, encouragement and guidance this research study could not have been completed. This study was done under the guidance of Prof. Ms. Namrata Deshmukh. I would like to acknowledge my deepest appreciation and undying gratitude for the scholarly guidance, constant encouragement and confidence he has given to me. She has been my mentor not only during the course of this work, but also in my entire PG study. I am truly indebted to her. I am extremely thankful to all my teachers and Dr. Sonali Gadekar (HOD) MET Institute Of Management, Nashik. I would also like to thanks to the Librarians and administrative staffs of the MET IOM for their timely help and co-operation during the project work. I am extremely grateful to Mr. Kishor Jadhav Sir, Assistant Branch Manager, Kotak Life Insurance, Nashik Branch for his suggestion and guidance. My grateful thanks are also due to Mr. Manoj Muthoot Sir, the Branch Manager Kotak Life Insurance, Nashik Branch. for helping me to access the organization data at its Branch premises. Somnath B. Pagar
  • 6.
    A STUDY OFTHE IMPACT OF LIBERALIZATION ON THE INDIAN LIFE INSURANCE INDUSTRY Page 5 CHAPTER- I INTRODUCTION Liberalization of domestic financial market had been common characteristic in many countries which includes industrially developed countries as well as the developing countries. However, there is a substantial amount of debate in economic research regarding the benefits of deregulation. In the context of insurance services, deregulation generally leads to market liberalization. Countries are liberalizing their insurance market at different rates and to different degree. Additionally, each country has its own unique political and economic characteristics. Furthermore, the best route from monopoly to competition differs substantially in different setting. Therefore there is no single set of direction that can guide the challenging journey from monopoly to competition. And so outcomes of deregulation policy differ from country and country and need to analyze each of them separately to understand the end result of a particular liberalization and deregulation policy. In India, New Economic Policy (NEP) was introduced in 1991 with the main idea of globalization, privatization, deregulation and liberalization. As a consequent, insurance market liberalization process was initiated in 1993 and was finally opened in 1999. The life insurance market was opened to private players because of low penetration of life insurance, non-availability of customer oriented products, low level of customer satisfaction, higher premium rates and lack of professionalism on the part of the insurer and a very low spread of life insurance in the country. In addition, signing of the GATT (General Agreement on Tariff and Trade) made way for the opening of the insurance sector to global players. The opening of the Indian insurance sector was aimed at fostering competition and innovation with greater variety of products and growth of the insurance business. This research will highlight the post liberalization scenario in the life insurance sector in India to see whether the objective behind the opening of the life insurance have been achieved or on the right direction towards achieving the objective laid down by the policy makers. The main research questions explored in the study include:-  1. What is the present scenario of the industry? How different it is from the pre liberalization scenario? What changes may be brought about by competition in the industry?  2. How far the life insurance companies have improved in terms of the efficiency?
  • 7.
    A STUDY OFTHE IMPACT OF LIBERALIZATION ON THE INDIAN LIFE INSURANCE INDUSTRY Page 6  3. How did liberalization contributed in product innovation and customer service parameters in life insurance industry?  4. What are other implications of liberalization in life insurance industry? The study covers the period from 2001-02 to 2012-13. The number of insurers taken varies from analysis to analysis. In some cases, top 5 private sector(in terms of total premium and net earnings) insurers are taken for the study instead of all the insurers, as the data pertaining to new entrants are not available or may deteriorate the overall result. It primarily depends on the secondary data available with Insurance Regulatory and Developmental Authority of India (IRDA), Annual reports of respective life insurance companies in India. Also text books, national as well as international articles and dailies are referred to collect relevant and required data.
  • 8.
    A STUDY OFTHE IMPACT OF LIBERALIZATION ON THE INDIAN LIFE INSURANCE INDUSTRY Page 7 ORGNISATION PROFILE Kotak Mahindra Old Mutual Life Insurance Ltd is a 74:26 joint venture between Kotak Mahindra Bank Ltd., its affiliates and Old Mutual plc. The company started operations in 2001, and strives to offer its customers outstanding value through high customer empathy, consistent and benchmarked service and a suite of products that leverage the combined prowess of protection and long term savings. The company covers over 4 million lives and is one of the fastest growing insurance companies in India. About Kotak Mahindra Group Established in 1985, the Kotak Mahindra Group is one of India's leading financial services conglomerates. In February 2003, Kotak Mahindra Finance Ltd. (KMFL), the Group's flagship company, received a banking license from the Reserve Bank of India (RBI). With this, KMFL became the first non-banking finance company in India to become a bank–Kotak Mahindra Bank Limited. The consolidated balance sheet of Kotak Mahindra group is over 1.22 lakh crore and the consolidated net worth of the Group stands at 19,076 crore (US$ 3.2 billion) as on March 31, 2014. The Group offers a wide range of financial services that encompass every sphere of life. From commercial banking, to stock broking, mutual funds, life insurance and investment banking, the Group caters to the diverse financial needs of individuals and the corporate sector. The Group has a wide distribution network through branches and franchisees across India, and international offices in London, New York, Dubai, Abu Dhabi, Mauritius and Singapore. Group
  • 9.
    A STUDY OFTHE IMPACT OF LIBERALIZATION ON THE INDIAN LIFE INSURANCE INDUSTRY Page 8
  • 10.
    A STUDY OFTHE IMPACT OF LIBERALIZATION ON THE INDIAN LIFE INSURANCE INDUSTRY Page 9 About Old Mutual - Old Mutual provides life assurance, asset management, banking and general insurance to more than 16 million customers in Africa, the Americas, Asia and Europe. Originating in South Africa in 1845, Old Mutual has been listed on the London and Johannesburg Stock Exchanges, among others, since 1999. In the year ended 31 December 2013, the Group reported adjusted operating profit before tax of £1.6 billion (on an IFRS basis) and had £294 billion of funds under management from core operations. Board of Director‟s/Management Hierarchy
  • 11.
    A STUDY OFTHE IMPACT OF LIBERALIZATION ON THE INDIAN LIFE INSURANCE INDUSTRY Page 10 Financial Position Particulars Year ended March 31, 2013 Year ended March 31, 2012 New Business Premium 1,188 1,164 Renewal Premium 1,590 1,773 Total Premium 2,778 2,937 Profit/(Loss) before tax 212 211 Profit/ (Loss) after tax 203 211 Bonus to Policyholders 42 33 Net worth 803 613 New Business Sum Assured 106,847 90,474 Assets Under Management 10964 92724 *Source: kotak life insurance annual report 2012-13. Vision & Mission An uncommon bond. Strengthened by a common vision. Apart from common beliefs, values and objectives we believe in the vision of a better tomorrow. It is this deep veneer of faith that has brought us together and fortified our bond. The global Indian financial services brand Our customers will enjoy the benefits of dealing with a global Indian brand that best understands their needs and delivers customized pragmatic solutions across multiple platforms. We will be a world-class Indian financial services group. Our technology and best practices will be benchmarked along international lines while our understanding of customers will be uniquely Indian. We will be more than a repository of our customers' savings. We, the group, will be a single window to every financial service in a customer's universe. The most preferred employer in financial services A culture of empowerment coupled with a spirit of enterprise, attracts bright minds with an entrepreneurial streak to join us and stay with us. Working with a home-grown, professionally-managed company, which has partnerships with international leaders, gives our people a perspective that is universal as well as unique. The most trusted financial services company We will create an ethos of trust across all our constituents. Adhering to high standards of compliance and corporate governance will be an integral part of building trust. Value creation Value creation rather than size alone will be our business driver.
  • 12.
    A STUDY OFTHE IMPACT OF LIBERALIZATION ON THE INDIAN LIFE INSURANCE INDUSTRY Page 11 Insurance Offered By Kotak Mahindra Old Mutual Life Insurance Ltd- Source: http://insurance.kotak.com
  • 13.
    A STUDY OFTHE IMPACT OF LIBERALIZATION ON THE INDIAN LIFE INSURANCE INDUSTRY Page 12 1.1-Liberalization and Deregulation Concepts: Liberalization policies that remove barriers to entry and empower consumers to discipline industry suppliers typically are better methods for fostering vigorous long term industry competition (Armstrong Mark and David E. M. Sappington, 2006). Liberalization and deregulation seek to improve economic welfare by bringing a more efficient allocation of the country„s resources in the long run. The deregulation is an occurrence opposite to regulation. It means a reduction of existing limits or controls of the state on a lower level. Liberalization results from the deregulation process. That means directions and magnitude of liberalization are determined by the actions of deregulation characters. Liberalization policies that remove barriers to entry and empower consumers to discipline industry suppliers typically are better methods for fostering vigorous long term industry competition (Armstrong Mark and David E. M. Sappington, 2006). There are several potential benefits of liberalized regime as given by Skipper (1997):- First, liberalization facilitates better customer services and value. It enhances competition in a wider geographical range and so creates stronger and more competitive local insurance industry. Open markets also help firms tap into world markets, increase their sales potential, benefits from economies of scale, and spread the fixed costs of research and development over a wider customer base. Secondly, liberalization helps in mobilizing domestic savings. More liberalized market regime with greater foreign insurers involved in could contribute saving and so to economic development. Thirdly, liberalization makes possible the transfer of technological knowhow. Transfer of ideas, bringing of new and better skills and knowhow, training programs, technology and managerial techniques to host country are facilitated in the liberalized market. Lastly, liberalization promotes additional capital inflow. A domestic country benefits from liberality in that the foreign insurers bring an additional source of financial capital. The additional financial capital can be used to finance additional projects.
  • 14.
    A STUDY OFTHE IMPACT OF LIBERALIZATION ON THE INDIAN LIFE INSURANCE INDUSTRY Page 13 1.2 Methodology of the Study Life insurance sector is the major part of total insurance sector in India and so can be able represent majority of the reform„s implication to the industry. The decision to introduce competition into an industry is only the beginning of a journey down a long and winding road that can represent many obstacles and detours. With the liberalization and entry of private companies in Insurance sector there are various changes brought in .There are changes in terms of efficiency of life insurance firms, market concentration level and product innovations which are generally attributable to liberalization and deregulation. So it is very important to evaluate and understand the impact in terms of growth and development and other future prospects in the sector and try to find out how the reforms have benefited the insurance sector in India. This thesis therefore, attempts to study the impacts of liberalization and deregulation processes in India, specifically in life insurance industry. There are 24 life insurers including LIC of India as on 31st March 2014. However numbers of insurers taken varied in the analysis, as the insurers which entered into the industry after 31st March 2012 are not considered for short of data. The analysis depends on the secondary data available with Insurance Regulatory and Developmental Authority of India (IRDA) and the Annual Reports of respective life insurance companies in India. Also text books, national as well as international articles are referred to collect relevant and required data. The statistical tools used in the research include Herfindahl Hirschman index (HHI).Other simple statistical tools were also used, as required. To examine the state and nature of competition, the Herfindahl Hirschman Index, and Concentration Ratio (C1, C4) of the industry are calculated using firm level share of total premium and equity share capital. Each of the statistical method used are explained in details IV chapter. Project primarily depends on the secondary data available with Insurance Regulatory and Developmental Authority of India (IRDA), Annual reports of respective life insurance companies in India. Also text books, national as well as international articles and dailies are referred to collect relevant and required data.
  • 15.
    A STUDY OFTHE IMPACT OF LIBERALIZATION ON THE INDIAN LIFE INSURANCE INDUSTRY Page 14 1.3-Objectives of the Study The impact of liberalization can be viewed as a two tier process; namely impact on financial performance as well as on the overall functioning of the market. This study takes into account the efficiency improvement in the life insurance industry in the wake of deregulation. To sum up, following research questions are answered in the research study. 1) What is the present scenario of the industry? How different it is from the pre liberalization scenario? 2) The competition in the sector is expected to increase. So what is the present state and nature of competition? What changes have taken place in the market structure of life insurance industry? 3) Whether firms are efficient or not? Whether or not the efficiency and of the insurance market is improving after liberalization? 4) How did liberalization contributed in product innovation and customer service benchmark in life insurance industry? 5) What are the implications of liberalization on spread and coverage of social security measures?
  • 16.
    A STUDY OFTHE IMPACT OF LIBERALIZATION ON THE INDIAN LIFE INSURANCE INDUSTRY Page 15 CHAPTER- II AN OVERVIEW OF INDIAN LIFE INSURANCE INDUSTRY The insurance sector in India is nearly 193 years old and can be termed as in the third phase of its existence. Today, the life insurance business ranked 9th among the 156 countries and the share of life insurance sector in global market was 2.45 percent in 2009. This chapter defines the concept of life insurance and gives an overall summary of the long and eventful journey of Indian life insurance industry from the British Raj to Monopoly Raj to Swaraj. 2.1-Life Insurance: Defined Life Insurance is basically associated with risk of human lives. It provides protection to household against the premature death of its bread winner or income earning member. Individuals buy life insurance product by paying certain amount of money which is called premium to the life insurance company for contractual agreements to provide a shield in case of eventualities. According to the section 2(11), of the Insurance Act of 1938, life insurance business in India is defined as follows:- “Life insurance business” means the business of effecting contracts of insurance upon human life, including any contract whereby the payment of money is assured on death (except death by accident only) and the happening of any contingency dependent on human life, and any contract which is subject to payment of premiums for terms dependent on human life.”
  • 17.
    A STUDY OFTHE IMPACT OF LIBERALIZATION ON THE INDIAN LIFE INSURANCE INDUSTRY Page 16 2.2-Indian Life Insurance-History Insurance business in India is classified primarily as Life Insurance and General Insurance. The journey of Indian Insurance Industry has so far been very eventful in the way that it has come in full circle from privatization of insurance firms to creation of monopoly and back to privatization and liberalization. The journey can be divided into three phases viz. 1) Pre nationalization phase (Before 1956), 2) Nationalized era (1956-2000) and 3) Liberalization era (2000 onwards). The Table 2.2 provides the sequence of the journey of Indian Insurance up to starts of the liberalization. Each of these phases is discussed briefly as follows. Table 2.2(a): Milestones of insurance regulations in the 20th Century Year Significant regulatory events 1818 Establishment of the Oriental Life Insurance Company in Calcutta 1912 The Indian Life Insurance company Act 1928 The Indian Insurance Companies act 1938 The Insurance Act: comprehensive Act to Regulate insurance business in India 1956 Nationalization of life insurance business in India with monopoly awarded to LIC of India 1972 Nationalization of general insurance business in India with formation of a holding company General Insurance Corporation 1993 Setting up of Malhotra Committee 1994 Recommendations of Malhotra Committee published 1995 Setting up of Mukherjee Committee 1996 Setting up of (interim) Insurance Regulatory Authority(IRA) Recommendations of the IRA 1997 Mukherjee Committee report submitted but not made public 1997 The Government gives greater Autonomy to LIC, GIC and its subsidiaries with regards to the restructuring of boards and flexibility in investment norms aimed at channeling funds to the Infrastructure sector. 1998 The cabinet decides to allow 40% foreign equity in private insurance companies and 14% to Non-resident Indians and foreign institutional Investors. 1999 The Standing Committee headed by Mr. Murali Deora decides that foreign equity in private insurance should be limited to 26%.IRA bill is renamed the Insurance Regulatory and Development Authority bill. 1999 Cabinet clears Insurance Regulatory and Development Authority Bill 2000 President gives Assent to the Insurance Regulatory and Development Authority Bill *Source: Tapen Sinha, CRIS Discussion Paper Series-2002.
  • 18.
    A STUDY OFTHE IMPACT OF LIBERALIZATION ON THE INDIAN LIFE INSURANCE INDUSTRY Page 17 2.2.1-Pre nationalization phase: First insurance company in India was the Oriental Life Insurance Company started in 1818 in Kolkata, which failed in 1834 (Bhattacharya, et al 2003). This company was owned by the European and it looked after the needs of Europeans only. Bombay Mutual Life Assurance Society heralded the birth of first Indian life insurance company in the year 1870, and covered Indian lives. As for the regulation, it was only in 1912 that the Life Insurance Companies Act was enacted and the comprehensive legislature for regulating and administering Indian industry started. Prior to this, India had no legislation to regulate insurance business and the Indian insurance companies were governed by the Companies Act of 1866. There were two important Insurance Acts enacted during this phase namely Insurance Act 1912 and Insurance Act 1938. Insurance Act 1912: It was modeled on the basis of the Insurance Companies Act 1870 of the UK and the one enacted in 1909 replacing the Act of 1870. The Indian Life Insurance Companies Act, 1912 made it necessary that the premium rate tables and periodical valuations of companies should be certified by an actuary. The Indian Insurance Act 1938: This act was the first comprehensive legislation governing not only life but also non-life branches of insurance. The Act aimed to consolidate and amend the law relating to insurance business and so defined the legal framework of the insurance business in India. The insurance business in India is still governed by the provisions of this Act with several amendments made to it. Business during the Pre nationalization phase: During the period 1870 to 1939, number of life insurance companies were formed and exited from operation. The number of life Indian life insurance companies grew from 30 in 1912 to 116 in 1939 and remained at 154 in 1955 is shown in Table 2.1.1(a). Table 2.2.1(a): Number of life insurance companies: 1929-1939 Year company Promoted Exited Remained 1870-1912 Indian Companies 58 28 30 Foreign companies 30 21 09 Total 88 49 39 1929-39 Indian companies 176 60 116
  • 19.
    A STUDY OFTHE IMPACT OF LIBERALIZATION ON THE INDIAN LIFE INSURANCE INDUSTRY Page 18 Foreign companies 05 02 03 Total 181 62 119 1955 Indian companies -- -- 154 Foreign and provident societies -- -- 91 Total -- -- 245 *Source: Desai G. R (1973) “Life Insurance in India: Its History and Dimensions of Growth". Growth of life business during the period 1914 to 1955 is shown in tables 2.2.1(b) &2.2.1(c). (The data were taken from different sources and are differ in the variables presented; therefore the tables are shown separately) Table 2.2.1(b): Growth of life Insurance business in India: 1914-1948 Year Insurer Number of insurers Total number of policies in force Total business in force(Rs crore) Total life fund( Rs crore) 1914 Indian 44 -- 22.44 6.36 Non-Indian -- -- -- Indian Outside India -- -- -- Total 44 -- 22.44 1930 Indian 68 513925(68.61) 84.89(32.85) 20.53 Non-Indian -- 220703 69.76 Indian Outside India -- 14369 3.77 Total 68 748997 258.42 1940 Indian 179 1371963(84.25) 225.51(74.17) 62.41 Non-Indian 16 181247 60.12 Indian Outside India -- 75171 18.40 Total 195 1628381 304.03 1945 Indian 200 2376000(87.55) 459.43(80.17) 107.4Non-Indian 15 261000 91.85 Indian Outside India -- 77000 21.79 Total 215 2714000 573.07 1948 Indian 189 2791000(90.15) 566.38(79.46) 150.39
  • 20.
    A STUDY OFTHE IMPACT OF LIBERALIZATION ON THE INDIAN LIFE INSURANCE INDUSTRY Page 19 Non-Indian 20 234000 101.08 Indian Outside India -- 202000 45.30 Total 209 3016000 712.76 *Source: Tryst with Trust (1991) LIC of India, Bombay, India. Table2.2.1(c): Life Insurance business in force in India 1949-1955. Year New business Total business in force Number of Policies(In Lakhs) Amt.(In Crores) Number of Policies(In Lakhs) Amt.(In Crores) 1949 5.44 142.2 33.03 765 1950 4.98 139.5 32.8 780 1951 4.74 147.9 34.14 873 1952 5.34 146.7 39.25 922 1953 5.58 155.2 40.79 966 1954 7.73 255.25 47.82 1177 1955 8.31 260.28 47.92 1220 *Source: Bhave S.R (1970), Saga of Security: Story of Indian Life insurance (1870-1970). The total business in force which was 22.44 crore in 1914 grew to 712.76 crore in 1948. The year 1943 marked the beginning of a period of steady and progressive increase in the volume of new life insurance business, Rs 62.94 crore in 1943; Rs 95.20 crore in 1944; Rs 122.78 crore in 1945( Tryst with Trust (1991) LIC of India ). It was in 1945 that for the first time, the volume of Indian insurance business cross Rs 100 Crores mark. The foreign insurance companies found it difficult to withstand the competition from Indian life insurance companies and were able to get a meager amount of business share during the period. (Mitra Debabrata and Ghosh Amlan, 2010). The total new business written by Indian life insurance companies were Rs 255 crore and Rs 260.84 crore in 1954 and 1955 respectively.
  • 21.
    A STUDY OFTHE IMPACT OF LIBERALIZATION ON THE INDIAN LIFE INSURANCE INDUSTRY Page 20 2.2.2-Nationalization and LIC„s monopoly regime (1956-2000): The announcement by C. D. Deshmukh, the then Finance minister of India on January19, 1956 that the government will take over the life insurance business of all national and foreign companies in India was the first vital move in nationalizing life insurance in India and Life Insurance (Emergency Provision) Act 1956 was made. The ordinance and act provided for Government control of 245 companies comprising 154 Indian Insurers, 75 provident societies and 16 non-Indian insurers. Based on the ordinance, the bill for nationalizing the life insurance business in India was piloted in the Parliament on February 18, 1956 as a Finance bill. After a reference to a joint select committee of the parliament and adoption by both the houses of the parliament with the assent of the president of India, the Bill came into force on July1, 1956. And the Life Insurance Corporation of India was constituted on September 1, 1956 under the Act (LIC Act Number 31of 1956 dated June 18, 1956). LIC Act, 1956:- It is an act which provides for the nationalization of life insurance business in India by transferring all such business to a corporation established for the purpose and to provide for the regulation and control of the business of the corporation and for matters connected therewith or incidental thereto. Post nationalization growth: At the time of nationalization, the LIC of India took over total life business of over Rs 1,128.06 Crores, under 47.82 lakh policies of which the share of Indian insurers was around 87.25% and that of Non –Indian insurers was 12.28. New business written by LIC of India at the end of December 1957 stood at Rs 281.90 crore under 794,585 policies. The business volume at the end of 1957 including bonuses stood at Rs 1474 crore under 56.86 lakh policies.
  • 22.
    A STUDY OFTHE IMPACT OF LIBERALIZATION ON THE INDIAN LIFE INSURANCE INDUSTRY Page 21 Table 2.2.2(a): Growth statistics of LIC of India (Policies are in lakh and amount in Crores). Year Premium Income Investment Income Total business in force Total in force policies Annual New Business Annual number of new policies 1984-85 1559.13 950.58 33,950.50 265.31 5,375.93 27.00 1985-86 1782.28 1126.98 40,617.10 280.47 7,088.45 32.94 1986-87 2097.21 1334.17 48,150.64 298.60 9,107.59 38.76 1987-88 2671.88 1557.21 59,067.69 324.81 12,467.58 47.64 1988-89 3432.72 1884.83 74,429.00 361.34 17,268.58 59.87 1989-90 4489.39 2278.29 94,823.00 403.98 23,319.53 74.01 *Source: Tryst with Trust (1991) LIC of India, Bombay, India. Table 2.2.2(b): Performance of LIC from 1991-92 to 1999-00: Individual Assurance Year Number of Policies (Lakhs) Sum assured (Rs Crores) Annual premium Received (Rs Crores) 1991-92 92.40 32064.00 1790 1992-93 100.00 32595.00 2038 1993-94 107.25 41814.00 2508 1994-95 108.74 55228.00 2534 1995-96 110.20 51816.00 2814 1996-97 122.68 56740.50 3345 1997-98 133.11 63617.69 3841 1998-99 148.44 75316.28 4863 1999-00 169.77 91214.25 6008 *Source: Annual Reports of LIC of India Table 2.2.2(a) shows the growth statistics of LIC of India during the eighties. Table 2.2.2(b) shows the performance of LIC in terms of number of policies, sum assured and annual premium received since 1991-92 to 1999-00 for individual assurance and total life business in force. The number of policies, sum assured, and the annual premium received all shows an increasing trend over the years.
  • 23.
    A STUDY OFTHE IMPACT OF LIBERALIZATION ON THE INDIAN LIFE INSURANCE INDUSTRY Page 22 Table: 2.2.2(c): New policies issued and their market share Year New Policies issued(In Numbers) Pvt. LIC Total 2002-03 825094(3.25) 24545580(96.75) 25370674(100) 2003-04 1658847(5.79) 26968069(94.21) 28626916(100) 2004-05 2233075(8.52) 23978123(91.48) 26211198(100) 2005-06 3871410( 10.92) 31590707(89.08) 35462117(100) 2006-07 7922274(17.17) 38229292(82.83) 46151566(100) 2007-08 13261558(26.07) 37612599(73.93) 50874157(100) 2008-09 15010710(29.48) 35912667(70.52) 50923377(100) 2009-10 14362000(26.98) 38863000(73.02) 53225000(100) 2010-11 11114000(24.79) 33703800(75.21) 44817800(100) 2011-12 8442000(19.10) 35751000(80.90) 44193000(100) 2012-13 7405000(16.76) 36782000(83.24) 44187000(100) *Source: Annual Reports of IRDA Table 2.2.2(c) shows the business performance in terms of new policies issued. Over the years, the number of new policies issued by private insurers was increasing. The number of new policies issued by LIC was also increasing but it was declined in 2004-05 as well as in 2007-08 and 2009-10. The share of private life insurers in new policies issued has increased from 3% in 2002-03 to 29.5% in 2008-09 and that of Lic decreased from 97% to 70.5 respectively.
  • 24.
    A STUDY OFTHE IMPACT OF LIBERALIZATION ON THE INDIAN LIFE INSURANCE INDUSTRY Page 23 Table 2.2.2(d): Life insurance companies in India* Sr. No. Insurers Foreign Partner Date of Registration Year of Operation 1 LIC of India -- 01.09.1956 1956 2 HDFC Standard LI Co. Ltd Standard life Assurance, UK 23.10.2000 2000-01 3 Max New York LI Co. Ltd New York Life, USA 15.11.2000 2000-01 4 ICICI-Prudential LI Co. Ltd Prudential, UK 24.11.2000 2000-01 5 Kotak Old Mutual LI Co. Ltd Old Mutual, SA 10.01.2001 2001-02 6 Birla Sun LI Co. Ltd Sun Life, Canada 31.01.2001 2001-01 7 Tata-AIG LI Co. Ltd American International Assurance Co. USA 12.02.2001 2000-01 8 SBI LI Co. Ltd BNP Paribas Assurance, SA, France 29.03.2001 2001-02 9 ING Vysya LI Co. Ltd ING Insurance International B.V, Netherlands 02.08.2001 2001-02 10 Allianz Bajaj LI Co. Ltd Allianz, Germany 03.08.2001 2001-02 11 MetLife India insurance Co. Ltd MetLife International Holdings Ltd. USA 06.08.2001 2001-02 12 Reliance LI Co. Ltd -- 03.01.2002 2001-02 13 AVIVA Aviva International Holdings Ltd. UK 14.05.2002 2002-03 14 Sahara LI Co. Ltd -- 06.02.2004 2004-05 15 Shriram LI Co. Ltd Sanlam, SA 17.11.2005 2005-06 16 Bharti AXA LI Co. Ltd AXA Holdings, France 14.07.2006 2006-07 17 Future Generali India LI Co. SMNPL Generali, Italy 04.09.2007 2007-08 18 IDBI Fortis LI Co. Ltd Fortis, Netherlands 19.12.2007 2007-08 19 Canara HSBC OBC LI Co. Ltd HSBC,UK 08.05.2008 2008-09 20 Aegon Religare LI Co. Ltd Religare, Netherlands 27.06.2008 2008-09 21 DLF Pramerica LI Co. Ltd. Prudential of America, USA 27.06.2008 2008-09 22 Star Union Dai-ichi LI Co. Ltd. Dai -ich Mutual life Insurance of Japan 26.12.2008 2009-10 23 IndiaFirst LI Co.Ltd. -- 05.11.2009 2009-10 24 Edelweiss Tokio Life Insurance Co. Ltd. LI of Tokio NA 2011-12 * As on 31 March 2013.
  • 25.
    A STUDY OFTHE IMPACT OF LIBERALIZATION ON THE INDIAN LIFE INSURANCE INDUSTRY Page 24 CHAPTER- III LITERATURE REVIEW This chapter provides comprehensive survey of literature on the topic of insurance sector liberalization and related trends. Insurance markets worldwide have changed in the last two decades. Liberalization, deregulation, globalization of insurance institutions, intensified competition, electronic commerce etc. are among the challenges faced by insurance markets now. Balasubramanian, T.S. and S.P. Gupta,(2000) in their book on “Insurance Business Environment” explain at length the global and Indian pictures of Insurance systems. The impact of globalization and also liberalization on Insurance business environment is also discussed analytically to have a clear understanding of the challenges faced by the insurance industry. Srivastava, D.C. and Srivastava, S. (2001) in their book on “Indian Insurance Industry–Transition and Prospects” discuss analytically the financial significance of insurance industry, its contribution to Indian economy and also the transitory prospects and challenges of insurance industry due to liberalization and the opening up of the sector to private players. Rajendran and Natarajan (2009) found out the remarkable improvements that the acceptance and adaptation of Liberalization Privatization and Globalization has brought about in the Indian Life Insurance Industry specifically to LIC of India. They first compared the overall performance of LIC of India between pre and post LPG era and secondly examined the current status, volume of competitions and challenges faced by LIC of India. The growth of LIC was compared in terms performance indicators such as annual business, 50 business in force, group business in force and life fund between the period 1957 and 2007.For this they have taken the secondary data from the annual reports of LIC of India. Their analysis concluded that LPG was incorporating a positive influence on the performance of LIC of India showing that the business in India, business outside India as well as the total business of LIC of India was always in increasing trends. Kshetrimayum Sobita Devi (2011) in her thesis on “A Study of the Impact of Liberalization on the Indian Life Insurance Industry”, Ph.D. Thesis submitted to the Department of Economics, University of The Maharaja Sayajirao University of Baroda, Vadodara, 2011. Confirms a general opinion that innovativeness in every activity alone rules
  • 26.
    A STUDY OFTHE IMPACT OF LIBERALIZATION ON THE INDIAN LIFE INSURANCE INDUSTRY Page 25 and dominates the industry. But, at the same time, the practicality and economic justification of that innovativeness are also to be analyzed. All these studies most of the studies available analyzed Indian industry scenario in varying aspects such as emerging strategic and regulatory issues in light of liberalization, appraisal of industry development, structure, innovation etc. My Project attempts to contribute to field of insurance sector research by examining the changing industry scenario in terms of concentration, efficiency and other benefits of insurance reforms.
  • 27.
    A STUDY OFTHE IMPACT OF LIBERALIZATION ON THE INDIAN LIFE INSURANCE INDUSTRY Page 26 CHAPTER- IV DATA ANALYSIS AND INTERPRETATION Therefore the study has limited itself to analyze and interpret the impact of insurance liberalization on the topics of Concentration, Efficiency and Innovation. In analyzing these topics, the methodology and variables used are also restricted to the available data. 4.1- CONCENTRATION Concept – Market concentration is commonly used to represent the level of market competition. Concentration may have far-ranging and long-lasting implications for financial sector efficiency, stability, competitiveness. The concept of industrial concentration has been extensively discussed and debated in the economic literature. Despite the many different approaches to its measurement, general agreement prevails about the constituting elements of concentration measures, i.e. the number of firms (fewness) and the distribution of firm sizes (inequality) in a given market. Methodology – Market share identifies the shares of specific firms within a market. This study measures market shares of life insurers. For this project, concentration ratios (CR), Herfindahl Hirschman index (HHI) is calculated taking market shares in terms of Total premium and Equity share capital. The concentrations measures are calculated for each insurance company for each year from 2001-02 to 2012-13. The HHI and CR1 and CR4 is calculated for all the life insurance firms with and without LIC of India. Because LIC still plays dominant role in life insurance industry and so an index excluding its share may give a fair knowledge of competition among the private players after liberalization. Concentration Ratio (CR): The concentration ratio is the measure of the percentage market share in an industry held by the largest firms within that industry. For example, if 3 firms dominate a specific industry, holding 80% market share of the industry, the concentration ratio of the industry would thus be 80%. So the market share of the K firms in the market takes the form given below, giving equal emphasis to the k leading firms, but neglecting the many small firms in the market.
  • 28.
    A STUDY OFTHE IMPACT OF LIBERALIZATION ON THE INDIAN LIFE INSURANCE INDUSTRY Page 27 There are no rules for the determination of values of the k, so that the number of firms included in the concentration index is a rather arbitrary decision. The concentration ratio may be considered as one point on the concentration curve, and it is a one-dimensional measure ranging between zero and unity. The index approaches zero for an infinite number of equally sized firms (given that the k chosen for the calculation of the concentration ratio is comparatively small as compared to the total number of firms) and it equals unity if the firms included in the calculation of the concentration ratio make up the entire industry. For this study concentration ratio are calculated taking the value of k as 1 (CR1) and 4(CR4) respectively. CR1 is calculated to determine the share of top company. The Four Firm Concentration Ratio (CR4) calculates the market share of the top four companies in the industry. This calculation determines if an industry is an oligopoly, a monopoly or neither. A Four Firm Concentration Ratio below 40 percent shows there is monopolistic competition. A Four Firm Concentration Ratio above 60 percent shows there is an oligopoly. Herfindahl-Hirschman Index (HHI): It measures the size of the firm in relation to the industry and so indicates the amount of competition among them. The Herfindahl-Hirschman Index (HHI) of competition therefore is a measure of the competitiveness of a market overall. It is not a measure specific to any one insurer, though it is a function of each insurer„s market share. The herfindahl index stresses the importance of larger firms by assigning them a greater weight than smaller firms, and it incorporates each firms individually, so that arbitrary cut-offs and insensitivity to the share distribution are avoided. Where Si is the market share of the firm i, The HHI index ranges between 1/ n and 1, reaching its lowest value (the reciprocal of the number of firms) when all firms in a market are of equal size, and reaching unity in the case of monopoly. So a decrease in the H indicates
  • 29.
    A STUDY OFTHE IMPACT OF LIBERALIZATION ON THE INDIAN LIFE INSURANCE INDUSTRY Page 28 an increase in competition. The maximum value of HHI will be 1 when there is monopoly and the minimum value of HHI is 1/n if there are n firms of equal size.
  • 30.
    A STUDY OFTHE IMPACT OF LIBERALIZATION ON THE INDIAN LIFE INSURANCE INDUSTRY Page 29 Table 4.1: Market share and herfindahl index of all life insurance firms (Total Premium) Insurers 2001- 02 2002- 03 2003- 04 2004- 05 2005- 06 2006- 07 2007- 08 2008- 09 2009- 10 2010- 11 2011- 12 2012- 13 (Si) Si2 LIC 0.9946 0.9799 0.9532 0.9067 0.8575 0.8245 0.7439 0.7092 0.7010 0.6978 0.7067 0.7270 0.5285 ICICI 0.0023 0.0075 0.0148 0.0285 0.0402 0.0510 0.0674 0.0692 0.0623 0.0613 0.0488 0.0471 0.0022 Max 0.0008 0.0017 0.0032 0.0050 0.0074 0.0097 0.0135 0.0174 0.0183 0.0199 0.0222 0.0231 0.0005 HDFC 0.0007 0.0027 0.0045 0.0083 0.0148 0.0184 0.0241 0.0251 0.0264 0.0309 0.0355 0.0394 0.0016 Birla 0.0006 0.0026 0.0081 0.0110 0.0119 0.0115 0.0163 0.0206 0.0207 0.0195 0.0205 0.0182 0.0003 Tata 0.0004 0.0015 0.0038 0.0060 0.0083 0.0088 0.0102 0.0124 0.0132 0.0137 0.0127 0.0096 0.0001 SBI 0.0003 0.0013 0.0034 0.0073 0.0102 0.0189 0.0279 0.0325 0.0381 0.0443 0.0458 0.0364 0.0013 Kotak 0.0002 0.0007 0.0023 0.0056 0.0059 0.0063 0.0084 0.0106 0.0108 0.0102 0.0102 0.0097 0.0001 Bajaj 0.0001 0.0012 0.0033 0.0121 0.0296 0.0278 0.0483 0.0479 0.0430 0.0329 0.0261 0.0240 0.0006 ING V. 0.0001 0.0004 0.0013 0.0041 0.0040 0.0046 0.0058 0.0065 0.0062 0.0059 0.0059 0.0061 0.0000 Met 0.0000 0.0001 0.0004 0.0010 0.0019 0.0032 0.0058 0.0090 0.0096 0.0086 0.0093 0.0085 0.0001 Reliance 0.0000 0.0001 0.0005 0.0013 0.0021 0.0065 0.0160 0.0222 0.0249 0.0225 0.0192 0.0141 0.0002 Aviva -- 0.0002 0.0012 0.0031 0.0057 0.0074 0.0094 0.0090 0.0090 0.0081 0.0084 0.0075 0.0001 Sahara -- -- -- 0.0000 0.0003 0.0003 0.0007 0.0009 0.0009 0.0008 0.0008 0.0007 0.0000 Shriram -- -- -- -- 0.0001 0.0012 0.0018 0.0020 0.0023 0.0028 0.0022 0.0022 0.0000 Bharti -- -- -- -- -- 0.0001 0.0006 0.0016 0.0025 0.0027 0.0027 0.0026 0.0000 Future -- -- -- -- -- -- 0.0000 0.0007 0.0020 0.0025 0.0027 0.0024 0.0000 IDBI -- -- -- -- -- -- 0.0001 0.0014 0.0022 0.0028 0.0026 0.0028 0.0000 Canara H -- -- -- -- -- -- -- 0.0013 0.0032 0.0053 0.0065 0.0067 0.0000 DLF Par -- -- -- -- -- -- -- 0.0000 0.0006 0.0003 0.0006 0.0008 0.0000 Aegon R -- -- -- -- -- -- -- 0.0001 0.0001 0.0013 0.0016 0.0149 0.0002 Staruni -- -- -- -- -- -- -- 0.0002 0.0020 0.0032 0.0044 0.0037 0.0000 IndiaFirst -- -- -- -- -- -- -- -- 0.0008 0.0027 0.0045 0.0059 0.0000 EdelwT -- -- -- -- -- -- -- -- -- -- 0.0000 0.0001 0.0000 Sum 1.0000 1.0000 1.0000 1.0000 1.0000 1.0000 1.0000 1.0000 1.0000 1.0000 1.0000 1.0000 0.5359 HHI 0.989 0.960 0.909 0.823 0.739 0.684 0.563 0.513 0.501 0.496 0.507 0.536 --
  • 31.
    A STUDY OFTHE IMPACT OF LIBERALIZATION ON THE INDIAN LIFE INSURANCE INDUSTRY Page 30 Table 4.2: Market share and herfindahl index for all private life firms (total premium) Insurers 2001- 02 2002- 03 2003- 04 2004- 05 2005- 06 2006- 07 2007- 08 2008- 09 2009- 10 2010- 11 2011- 12 2012- 13 (Si) Si2 ICICI 0.4270 0.3732 0.3170 0.3059 0.2825 0.2908 0.2630 0.2381 0.2083 0.2029 0.1665 0.1726 0.0298 Max 0.1429 0.0863 0.0690 0.0535 0.0523 0.0551 0.0526 0.0598 0.0612 0.0660 0.0759 0.0847 0.0072 HDFC 0.1228 0.1330 0.0954 0.0889 0.1041 0.1050 0.0942 0.0863 0.0883 0.1022 0.1211 0.1444 0.0209 Birla 0.1037 0.1286 0.1723 0.1185 0.0835 0.0653 0.0635 0.0709 0.0694 0.0664 0.0699 0.0665 0.0044 Tata 0.0776 0.0726 0.0813 0.0643 0.0584 0.0503 0.0397 0.0426 0.0440 0.0452 0.0431 0.0352 0.0012 SBI 0.0539 0.0647 0.0723 0.0778 0.0713 0.1076 0.1090 0.1118 0.1273 0.1465 0.1560 0.1333 0.0178 Kotak 0.0278 0.0360 0.0483 0.0603 0.0412 0.0357 0.0328 0.0363 0.0361 0.0338 0.0349 0.0354 0.0013 Bajaj 0.0262 0.0618 0.0708 0.1296 0.2077 0.1581 0.1886 0.1647 0.1439 0.1090 0.0889 0.0879 0.0077 ING V. 0.0154 0.0189 0.0284 0.0439 0.0282 0.0260 0.0225 0.0224 0.0207 0.0194 0.0199 0.0222 0.0005 Met 0.0018 0.0071 0.0092 0.0106 0.0137 0.0181 0.0225 0.0310 0.0320 0.0285 0.0318 0.0310 0.0010 Reliance 0.0010 0.0058 0.0100 0.0138 0.0149 0.0369 0.0626 0.0765 0.0832 0.0745 0.0653 0.0516 0.0027 Aviva -- 0.0120 0.0261 0.0328 0.0398 0.0422 0.0367 0.0309 0.0300 0.0266 0.0287 0.0273 0.0007 Sahara -- -- -- 0.0002 0.0018 0.0019 0.0028 0.0032 0.0032 0.0028 0.0027 0.0026 0.0000 Shriram -- -- -- -- 0.0007 0.0067 0.0069 0.0068 0.0077 0.0093 0.0076 0.0079 0.0001 Bharti -- -- -- -- -- 0.0003 0.0023 0.0056 0.0084 0.0090 0.0092 0.0095 0.0001 Future -- -- -- -- -- -- 0.0000 0.0024 0.0068 0.0082 0.0092 0.0086 0.0001 IDBI -- -- -- -- -- -- 0.0002 0.0049 0.0072 0.0092 0.0088 0.0103 0.0001 CanaraH -- -- -- -- -- -- -- 0.0046 0.0106 0.0174 0.0221 0.0243 0.0006 DLF Par -- -- -- -- -- -- -- 0.0001 0.0021 0.0010 0.0020 0.0030 0.0000 AegonR -- -- -- -- -- -- -- 0.0005 0.0005 0.0044 0.0054 0.0054 0.0000 Star U -- -- -- -- -- -- -- 0.0008 0.0067 0.0106 0.0151 0.0136 0.0002 India F -- -- -- -- -- -- -- -- 0.0025 0.0091 0.0154 0.0216 0.0005 EdelwT -- -- -- -- -- -- -- -- -- -- 0.0001 0.0007 0.0000 Sum 1.0000 1.0000 1.0000 1.0000 1.0000 1.0000 1.0000 1.0000 1.0000 1.0000 1.0000 1.0000 0.0967 Pvt HHI 0.2392 0.1961 0.1649 0.1523 0.1565 0.1475 0.1413 0.1239 0.1096 0.1052 0.0961 0.0967 --
  • 32.
    A STUDY OFTHE IMPACT OF LIBERALIZATION ON THE INDIAN LIFE INSURANCE INDUSTRY Page 31 Results Analysis: In terms of total premium, year wise market share of different life insurance firms is shown in table 4.1 and 4.2 respectively with their HHI. In all the years taken, LIC dominated the industry though its share was decreasing over the years. Till 2004-05, it occupied 90% of the total premium but was reduced to 70% & 69% in 2010 and 2011 respectively. But after that LIC dominated the industry and increase its market share (in terms of total premium) again in 2012 and 2013 as 70% and 72% respectively. All the private life insurers have shown increasing market share over the years. ICICI, Bajaj, SBI, and HDFC, has market share of 4 percent, 2 percent 3 percent and 3 percent in 2012-13 respectively. The herfindahl index of industry was reducing over the years with 0.0989 in 2001-02 to 0.0536 in 2012-13. The herfindahl index of private industry was reducing over the years with 0.2392 in 2001-02 to 0.0967 in 2012-13. ICICI started with 42 percent market share but reduced in successive years to 17% in 2012-13. It however, dominated the private insurance market throughout the years. SBI has shown increasing trend of market share except in 2005-06 and 2013. Its market share increased significantly with a mere 5% in 2001-02 to 13 % in 2012-13. Bajaj has also increased it share from 2% in 2001-02 to 8 % in 2012-13.
  • 33.
    A STUDY OFTHE IMPACT OF LIBERALIZATION ON THE INDIAN LIFE INSURANCE INDUSTRY Page 32 Insurers 2001- 02 2002- 03 2003- 04 2004- 05 2005- 06 2006- 07 2007- 08 2008- 09 2009- 10 2010- 11 2011- 12 2012- 13 (Si) Si2 LIC 0.0030 0.0022 0.0015 0.0011 0.0008 0.0006 0.0004 0.0003 0.0002 0.0002 0.0040 0.0039 0.0000 ICICI 0.1138 0.1902 0.2081 0.2125 0.2011 0.1615 0.1139 0.0782 0.0679 0.0603 0.0573 0.0560 0.0031 Max 0.1498 0.1141 0.1067 0.1071 0.0946 0.0902 0.0840 0.0977 0.0875 0.0778 0.0780 0.0762 0.0058 HDFC 0.1007 0.0976 0.0788 0.0735 0.1052 0.0986 0.1034 0.0984 0.0936 0.0843 0.0800 0.0782 0.0061 Birla 0.0899 0.0806 0.0894 0.0804 0.0781 0.0827 0.1036 0.1030 0.0937 0.0832 0.0789 0.0772 0.0060 Tata 0.1108 0.0828 0.0712 0.0737 0.0759 0.0673 0.0708 0.0832 0.0914 0.0825 0.0784 0.0766 0.0059 SBI 0.0749 0.0560 0.0540 0.0804 0.0721 0.0615 0.0813 0.0548 0.0476 0.0422 0.0401 0.0392 0.0015 Kotak 0.0605 0.0588 0.0466 0.0486 0.0415 0.0407 0.0391 0.0280 0.0243 0.0215 0.0205 0.0200 0.0004 Bajaj 0.0899 0.0672 0.0463 0.0345 0.0255 0.0185 0.0123 0.0083 0.0072 0.0063 0.0060 0.0059 0.0000 ING V. 0.0659 0.0761 0.0755 0.0747 0.0832 0.0849 0.0642 0.0558 0.0485 0.0619 0.0588 0.0574 0.0033 Met 0.0659 0.0492 0.0493 0.0540 0.0399 0.0652 0.0619 0.0866 0.0844 0.0832 0.0790 0.0789 0.0062 Reliance 0.0749 0.0560 0.0493 0.0499 0.0562 0.0817 0.0933 0.0636 0.0554 0.0492 0.0480 0.0469 0.0022 Aviva -- 0.0693 0.0749 0.0735 0.0779 0.0933 0.0817 0.0817 0.0899 0.0847 0.0804 0.0786 0.0062 Sahara -- -- 0.0484 0.0361 0.0266 0.0193 0.0189 0.0127 0.0110 0.0098 0.0093 0.0091 0.0001 Shriram -- -- -- -- 0.0212 0.0154 0.0102 0.0068 0.0059 0.0073 0.0070 0.0069 0.0000 Bharti -- -- -- -- 0.0002 0.0185 0.0298 0.0366 0.0538 0.0644 0.0689 0.0708 0.0050 Future -- -- -- -- -- -- 0.0150 0.0257 0.0334 0.0444 0.0483 0.0569 0.0032 IDBI -- -- -- -- -- -- 0.0163 0.0247 0.0214 0.0295 0.0321 0.0313 0.0010 CanaraH -- -- -- -- -- -- -- 0.0219 0.0238 0.0295 0.0321 0.0372 0.0014 DLFPar. -- -- -- -- -- -- -- 0.0075 0.0105 0.0124 0.0122 0.0125 0.0002 AegonR -- -- -- -- -- -- -- 0.0164 0.0271 0.0401 0.0455 0.0461 0.0021 Star U -- -- -- -- -- -- -- 0.0082 0.0119 0.0105 0.0100 0.0098 0.0001 India F -- -- -- -- -- -- -- -- 0.0095 0.0137 0.0191 0.0186 0.0003 EdelWT -- -- -- -- -- -- -- -- -- -- 0.0060 0.0058 0.0000 Sum 1.0000 1.0000 1.0000 1.0000 1.0000 1.0000 1.0000 1.0000 1.0000 1.0000 1.0000 1.0000 0.0603 HHI 0.0975 0.0993 0.0997 0.1016 0.0988 0.0889 0.0799 0.0717 0.0680 0.0632 0.0606 0.0602 -- Table 4.3: Market share and HHI of all life insurance firms (Equity share capital)
  • 34.
    A STUDY OFTHE IMPACT OF LIBERALIZATION ON THE INDIAN LIFE INSURANCE INDUSTRY Page 33 Table 4.4: Market share and HHI of all private life insurance firms (Equity share capital) Insurers 2001- 02 2002- 03 2003- 04 2004- 05 2005- 06 2006- 07 2007- 08 2008- 09 2009- 10 2010- 11 2011- 12 2012- 13 (Si) Si2 ICICI 0.1142 0.1907 0.2084 0.2128 0.2013 0.1616 0.1140 0.0782 0.0679 0.0605 0.0576 0.0560 0.0031 Max 0.1502 0.1144 0.1069 0.1072 0.0947 0.0902 0.0840 0.0977 0.0875 0.0778 0.0782 0.0765 0.0059 HDFC 0.1010 0.0978 0.0789 0.0736 0.1053 0.0987 0.1034 0.0984 0.0936 0.0848 0.0805 0.0782 0.0061 Birla 0.0901 0.0807 0.0895 0.0805 0.0781 0.0827 0.1037 0.1030 0.0937 0.0835 0.0789 0.0772 0.0060 Tata 0.1112 0.0830 0.0713 0.0738 0.0759 0.0674 0.0708 0.0833 0.0914 0.0828 0.0787 0.0766 0.0059 SBI 0.0751 0.0561 0.0540 0.0805 0.0722 0.0616 0.0814 0.0548 0.0476 0.0422 0.0401 0.0392 0.0015 Kotak 0.0607 0.0589 0.0467 0.0487 0.0415 0.0407 0.0391 0.0280 0.0243 0.0215 0.0205 0.0200 0.0004 Bajaj 0.0901 0.0673 0.0463 0.0345 0.0255 0.0185 0.0123 0.0083 0.0072 0.0063 0.0060 0.0059 0.0000 ING V. 0.0661 0.0763 0.0756 0.0748 0.0832 0.0850 0.0643 0.0558 0.0485 0.0619 0.0592 0.0574 0.0033 Met 0.0661 0.0493 0.0494 0.0541 0.0399 0.0653 0.0619 0.0866 0.0845 0.0834 0.0790 0.0789 0.0062 Reliance 0.0751 0.0561 0.0494 0.0499 0.0562 0.0818 0.0934 0.0636 0.0554 0.0492 0.0480 0.0469 0.0022 Aviva -- 0.0694 0.0750 0.0736 0.0779 0.0934 0.0817 0.0818 0.0899 0.0849 0.0804 0.0786 0.0062 Sahara -- -- 0.0485 0.0361 0.0267 0.0193 0.0189 0.0127 0.0110 0.0098 0.0093 0.0091 0.0001 Shriram -- -- -- -- 0.0212 0.0154 0.0102 0.0069 0.0059 0.0073 0.0070 0.0069 0.0000 Bharti -- -- -- -- 0.0002 0.0185 0.0298 0.0366 0.0538 0.0645 0.0691 0.0708 0.0050 Future -- -- -- -- -- -- 0.0151 0.0257 0.0334 0.0444 0.0483 0.0569 0.0032 IDBI -- -- -- -- -- -- 0.0163 0.0247 0.0214 0.0295 0.0321 0.0313 0.0010 CanaraH -- -- -- -- -- -- -- 0.0219 0.0238 0.0295 0.0322 0.0372 0.0014 DLFPar. -- -- -- -- -- -- -- 0.0075 0.0105 0.0124 0.0124 0.0125 0.0002 AegonR -- -- -- -- -- -- -- 0.0164 0.0271 0.0401 0.0455 0.0461 0.0021 Star U -- -- -- -- -- -- -- 0.0082 0.0119 0.0105 0.0100 0.0098 0.0001 India F -- -- -- -- -- -- -- -- 0.0095 0.0137 0.0191 0.0186 0.0003 EdleWT -- -- -- -- -- -- -- -- -- -- 0.0060 0.0059 0.0000 Sum 1.0000 1.0000 1.0000 1.0000 1.0000 1.0000 1.0000 1.0000 1.0000 1.0000 1.0000 1.0000 0.0603 Pvt.HHI 0.0981 0.0998 0.1000 0.1019 0.0990 0.0890 0.0800 0.0718 0.0680 0.0635 0.0609 0.0603 --
  • 35.
    A STUDY OFTHE IMPACT OF LIBERALIZATION ON THE INDIAN LIFE INSURANCE INDUSTRY Page 34 The market share of life insurance industry in terms of equity share capital and HHI is shown in table 4.3 and that of private life insurers in terms of equity share capital and HHI is shown in table 4.4. The market share of LIC was decreasing over the years standing 0.02 % in 2010 from 0.03% in 2002. This is because LIC equity share was fixed at 5 crore only while the total equity share capital of the industry was increasing with the increase in private insurers. But, in 2010-11 during the year LIC increased its equity capital and its market share goes up to 0.04%. The HHI of the industry is at 0.09 in the first three years and increased to 0.10 in 2005. From 2006 onwards it was decreasing to 0.060 in 2013. Among private insurers, the market share of Max, ICICI and SBI was highest in 2002 but only ICICI stood highest for 6 years from 2003 to 2008. The market share of Bajaj was decreasing over the years standing 0.005 % in 2013 from 0.09% in 2002. In 2010, PNB Met stood first among life insurers in market share of equity share. The HHI of the private insurers was at 0.09 in the first two years and increased to 0.10 in 2004 and 2005. From 2006 onwards it was decreasing to reach 0.060 in 2013.
  • 36.
    A STUDY OFTHE IMPACT OF LIBERALIZATION ON THE INDIAN LIFE INSURANCE INDUSTRY Page 35 Chart 4.1-HHI of life insurance industry (Total Premium and Equity Share Capital) Chart 4.1 shows the graphical representation of HHI of all Life Insurance Industry from table 4.1 and 4.3. 0 0.1 0.2 0.3 0.4 0.5 0.6 0.7 0.8 0.9 1 0.9890 0.9600 0.9090 0.8230 0.7390 0.6840 0.5630 0.5130 0.5010 0.4960 0.5070 0.5360 0.2392 0.1961 0.1649 0.1523 0.1565 0.1475 0.1413 0.1239 0.1096 0.1052 0.0961 0.0967 Herfindahl-Hirschman Index (HHI) HHI(Total Premium) HHI (Total Equity Capital)
  • 37.
    A STUDY OFTHE IMPACT OF LIBERALIZATION ON THE INDIAN LIFE INSURANCE INDUSTRY Page 36 Table 4.5: HHI, CR1and CR4 compared (Total Premium) Year 2001- 02 2002- 03 2003- 04 2004- 05 2005- 06 2006- 07 2007- 08 2008- 09 2009- 10 2010- 11 2011- 12 2012- 13 No‟s of Insurers 12 13 13 14 15 16 18 22 23 23 24 24 Industry Total HHI 0.9890 0.9600 0.9090 0.8230 0.7390 0.6840 0.5630 0.5130 0.5010 0.4960 0.5070 0.5360 Pvt. HHI 0.2392 0.1961 0.1649 0.1523 0.1565 0.1475 0.1413 0.1239 0.1096 0.1052 0.0961 0.0967 CR1 (%) 99.46 97.99 95.32 90.67 85.75 82.45 74.39 70.92 70.10 69.78 70.67 72.07 CR4 (%) 99.84 99.27 98.06 95.83 94.21 92.22 88.75 85.88 84.44 83.63 83.68 84.99 Table 4.6: HHI, CR1and CR4 compared (Total Equity Capital) Year 2001- 02 2002- 03 2003- 04 2004- 05 2005- 06 2006- 07 2007- 08 2008- 09 2009- 10 2010- 11 2011- 12 2012- 13 No‟s of Insurers 12 13 13 14 15 16 18 22 23 23 24 24 Industry Total HHI 0.0975 0.0993 0.0997 0.1016 0.0988 0.0889 0.0799 0.0717 0.0680 0.0632 0.0606 0.0602 Pvt. HHI 0.0981 0.0998 0.1000 0.1019 0.0990 0.0890 0.0800 0.0718 0.0680 0.0635 0.0609 0.0603 CR1 (%) 14.98 19.02 20.81 21.25 20.11 16.15 11.39 10.30 09.37 09.32 09.44 09.71 CR4 (%) 47.51 48.47 48.30 48.04 48.41 44.36 41.42 38.57 36.86 33.60 31.88 31.29
  • 38.
    A STUDY OFTHE IMPACT OF LIBERALIZATION ON THE INDIAN LIFE INSURANCE INDUSTRY Page 37 In Table 4.5, HHI and Concentration Ratios (CR1 and CR4) are shown in terms of total premium. The HHI decreasing over the years from 2001-02 to 2012-13. For the industry total, HHI decreased from 0.99 in 2001-02 to 0.53 in 2012-13, the HHI decreased from 0.23 in 2001-02 to 0.09 in 2012-13. In terms of total premium, the concentration was almost reduced to half since monopoly regime of LIC and the competition among private insurers was also increasing over the period. This was also evident from the CR1 which is decreasing over the years. The CR4 was also decreasing over the years. In Table 4.6, HHI and Concentration Ratios (CR1 and CR4) in terms of equity share capital are shown. The HHI of industry as well as private insurers showed a similar trends wherein both were decreasing since 2006. However the indices showed a slight increase till the year 2005. The equity share of LIC was constant at 5 Crores in all the years and so the fluctuations may be due to increase in private players. For the industry total, HHI decreased from 0.09 in 2002 to 0.06 in 2013. In case of private insurers, the HHI decreased from 0.098 in 2002 to 0.060 in 2010. The CR1 was fluctuating over the years. The CR4 also changed from year to year. The average CR4 of the 09 years taken was at around 45%.
  • 39.
    A STUDY OFTHE IMPACT OF LIBERALIZATION ON THE INDIAN LIFE INSURANCE INDUSTRY Page 38 4.2- EFFICIENCY Concept of Efficiency- Efficiency refers to how well firms are performing relative to the existing technology in the industry. The concept of economic efficiency flows directly from the microeconomic theory of firm. In microeconomic theory of firm, production (or economic) efficiency is decomposed into technical and Allocative efficiency. Estimation Technique- Firm performances can be measured using various methods; conventional financial ratios such as return on assets (ROA), return on equity (ROE), expense to premium ratios etc. For this project select ROA, ROE and Expense Ratio to analyse the financial potion of firms. The above Ratios are calculated for LIC and Top 5 private sector insurance companies for last 5 years from 2008-09 to 2012-13. ROE indicates the return a company is generating on the owners' investments. As a general rule for insurance companies, ROE should lie between 10-15%. ROA indicates the return a company is generating on the firm's investments /assets. In general, a life insurer should have an ROA that falls in the 0.5-1% range. A measure of what it costs an investment company to operate its funds. An expense ratio is determined through an annual calculation, where a fund's operating expenses are
  • 40.
    A STUDY OFTHE IMPACT OF LIBERALIZATION ON THE INDIAN LIFE INSURANCE INDUSTRY Page 39 divided by the average value of its assets under management. expense ratios are calculated by dividing each item of expenses or group of expense with the net sales to analyze the cause of variation of the operating ratio. Table 4.7: Ratio Analysis of LIC and private sector top 5 firms. Name of the Insurer 2008-09 2009-10 2010-11 2011-12 2012-13 Public Sector LIC ROE 191.47 212.14 234.36 13.13 14.38 ROA .0011 .0009 .0009 .0010 .0009 Expense Ratio .0577 .0658 .0835 .0735 .0801 Private Sector SBI Life ROE -.0263 .2765 .3663 .5558 .6222 ROA -.0019 .0098 .0093 .0118 .0119 Expense Ratio .0862 .0656 .0710 .0783 .1109 ICICI Prudential ROE -.5463 .1806 .5654 .9687 1.0469 ROA -.0213 .0043 .0115 .0193 .0201 Expense Ratio .1789 .1559 .1228 .1441 .1519 HDFC Standard ROE -.2801 -.1398 -.0496 .1359 .2263 ROA -.0429 -.0127 -.0035 .0081 .0110 Expense Ratio .3189 .2170 .1670 .1251 .1194 Bajaj Allianz ROE -.4690 .3598 .7013 .8700 .8530 ROA -.0040 .0164 .0269 .0332 .0335 Expense Ratio .1769 .1555 .1678 .1892 .2341 Birla SunLife ROE -.3736 -.2211 .1549 .2339 .2749 ROA -.0655 -.0241 .0142 .0206 .0225 Expense Ratio .2765 .2445 .2151 .2114 .2296 Note: Calculated from the various Annual Reports of IRDA, respective Insurers. 1. Return on Equity (Net profit per Equity). 2.Return on Assets (Net profit per Assets) 3. Underwriting Expenses to Net Written Premiums. Table 4.7 represent the efficiency of LIC and private sector top 5 life insurers. The return on assets (ROA) also known as investment income ratio (investment income per investment assets) of the life insurers under review. The ROA analysis vehemently supports the evaluation made herein above under ROE thus all life insurers under review recorded satisfactory performance of the net income to total assets. Moreover, the Bajaj Allianz flag its banner on the top in the sector by recording a high performance the ratio was stood at 0.0335 (i.e. 3.35 per cent) the Birla SunLife stood at 0.0225 (i.e. 2.25 per cent) and the ICICI Prudential stood at 0.0201 (i.e.2.01 per cent) during 2012-13. Expenses ratio (underwriting expenses to net written premium) of the life insurers under review.
  • 41.
    A STUDY OFTHE IMPACT OF LIBERALIZATION ON THE INDIAN LIFE INSURANCE INDUSTRY Page 40 4.3- INNOVATIONS Innovations are the introduction or adoption of new ideas, process, product or services, developed internally or acquired from external environment. The adoption of innovation flows from and is contingent upon an organization„s repertoire of technical, strategic and administrative skills. Liberalization has given way for establishment of new companies in Insurance sector and consequently competition is leading to innovation. The innovation is discussed under the following headings –  Products  Quality of Customer Service 4.3.1: Products - Products offered before liberalization and after liberalization are given in this section. Before liberalization, the range of product available was very limited. India has an enormous middle class that can afford to buy life insurance product as per their need. However after the liberalization, there was a major change in the insurance product offered by the insurance companies and insurance services covers opted for by the customers. It is difficult to specify exact number of policies or product that LIC or others have, since time to time; some products were introduced or withdrawn with small variation of time and may be counted as new product. Table 4.8 shown is the number of products offered by life insurance companies per year. Of the 18 life insurance companies taken together, 4 companies were offering more than 10 products per year on an average, and only two companies have offered less than 5 products per year. The remaining 12 companies have on average offered more than 5 but less than 10 products per year. The number of product offered was varied irrespective of the year and there was no trend of either increasing or decreasing for all the companies. As of now, the relationship between the number of product offered and the growth of the company is not looking into but it is important to mention here that the number of product available in the market has increased tremendously in the wake of liberalization. For table 4.8 Data are taken from IRDA„s annual reports .The number of new product launched in each year is mentioned here irrespective of whether withdrawn or not. The company wise average is calculated for the year product was launched. In case of the year where no product or riders were launched then that year is excluded from the average calculation.
  • 42.
    A STUDY OFTHE IMPACT OF LIBERALIZATION ON THE INDIAN LIFE INSURANCE INDUSTRY Page 41 Table-4.8: Number of products offered by life insurers in India Year 2001- 02 2003 2004 2005 2006 2007 2008 2009 2010 2011 2012 2013 Company wise Total 1* Firms Average Rank LIC 07 13 05 06 06 08 06 09 08 06 04 05 83 12 6.92 12 Aviva -- 18 10 04 02 24 18 12 16 18 01 06 129 11 11.73 02 Max NY 03 03 05 07 06 06 14 03 10 05 04 03 69 12 5.75 15 HDFC 06 02 07 04 05 11 04 13 19 17 05 06 99 12 8.25 08 ICICI 06 14 10 16 08 27 10 13 17 10 13 04 148 12 12.33 01 Met 03 12 07 06 02 08 07 05 16 07 05 05 83 12 6.92 13 SBI lIfe 06 05 09 02 04 09 13 05 14 14 10 06 97 12 8.08 11 Tata A 21 07 11 02 01 08 11 09 19 11 05 05 110 12 9.17 04 Birla S 07 05 01 02 06 18 09 06 14 24 04 08 104 12 8.67 06 Bajaj Al 08 05 13 10 06 15 14 16 22 13 08 08 138 12 11.50 03 ING Vys 06 05 04 04 05 09 07 03 10 11 07 02 73 12 6.08 14 Reliance 05 00 11 03 00 09 05 15 31 07 05 07 98 12 8.17 09 Kotak 07 09 05 10 04 17 07 09 16 11 03 05 103 12 8.58 07 Shriram -- -- -- -- 03 08 06 02 13 07 04 02 45 08 5.63 16 BhartiA -- -- -- -- -- 08 05 05 17 13 09 05 62 07 8.86 05 Futur G -- -- -- -- -- -- 04 13 11 10 07 04 49 06 8.17 10 IDBI Li -- -- -- -- -- -- 02 06 06 09 05 01 29 06 4.83 17 Year wise Total 85 98 98 82 61 191 144 147 264 197 101 83 1551 -- -- -- 2* 12 12 13 14 14 16 18 18 18 18 18 18 18 -- -- -- Industry Average 7.08 8.17 7.54 5.86 4.36 11.94 8.00 8.17 14.67 10.94 5.61 4.61 86.17 -- -- -- Source: Calculated from IRDA annual reports. (1 is the number of years taken for average calculation. 2 is the number of companies taken for average calculation.)
  • 43.
    A STUDY OFTHE IMPACT OF LIBERALIZATION ON THE INDIAN LIFE INSURANCE INDUSTRY Page 42 4.3.2: Quality of Customer Service – With liberalization of insurance sector, it has become very important for insurers to improve customer satisfaction and loyalty. In fact, service quality is an important means of differentiation and path to achieve business success in the competitive environment. Customer service is a derivative of a mix of human reactions influenced by a host stimuli emanating from within and outside the organization. Any improvement in customer services cannot be attained in isolation, unless the entire gamut of factors affecting it is taken into account and managed properly. Customers and employees need active participation in the process of developing a healthy relationship which involves a thorough overhaul of the approach of insurance company towards customer relations management. Keeping in view the two important dimensions of customer„s perceived quality service viz. assurance and compliance, the quality of customer service is examined on the point of the claim settlement of the life insurance firms.  Status of claim Settlement – Claim records of the insurance company give a fair idea of their payment history. Claim settlement ratio, claim repudiation ratio and claim pending ratio are three important parameters which would make us understand the quality of company„s trustworthiness. Claim settlement ratio is the number of claims settled for every 100 claims received by the life insurance company. For example if an insurance company has received 100 claims in a year and it has settled 98 claims out of it, then the claim settlement ratio will be 98%. Higher is the claim settlement ratio for the company, the better. Likewise claim repudiation ratio or claim pending ratio are the number of claims repudiated or pending for every 100 claims received by the life insurance company. Companies with lower claim repudiation or claim pending ratio are considered good.
  • 44.
    A STUDY OFTHE IMPACT OF LIBERALIZATION ON THE INDIAN LIFE INSURANCE INDUSTRY Page 43 Table 4.9: Claim Settlement ratio of all Life Insurers (In Percent) Source: IRDA Annual Reports. *All figures are rounded to the nearest integer in %. The payment history of private as well public insurer in case of death claim Settlement Ratio for five years from 2008-09 to 2012-13. The claim settlement record of 24 life insurers on claim settled parameter is examined here. For overall life insurance sector, LIC obviously stood top in all category and all the years as highest claim receiver. ICICI, HDFC, Kotak, SBI, Birla are the private insurers those who receive highest claims and its increasing year to year. For the industry, the number of death claim was increasing over the years. Sr. No Insurers 2008-09 2009-2010 2010-2011 2011-2012 2012-2013 1. LIC 96% 97% 97% 97% 98% 2. ICICI 90% 90% 95% 97% 96% 3. Max 60% 66% 78% 90% 94% 4. HDFC 89% 91% 95% 96% 96% 5. Birla 82% 89% 95% 91% 83% 6. Tata 73% 78% 82% 84% 84% 7. SBI 83% 82% 83% 95% 94% 8. Kotak 85% 87% 89% 92% 92% 9. Bajaj 79% 88% 89% 91% 89% 10. ING V. 81% 89% 90% 89% 84% 11. Met Life 78% 83% 85% 81% 84% 12. Reliance 78% 81% 89% 85% 86% 13. Aviva 74% 87% 84% 90% 88% 14. Sahara 42% 53% 63% 78% 85% 15. Shriram 29% 40% 56% 65% 67% 16. Bharti 68% 78% 87% 88% 89% 17. Future 29% 39% 51% 68% 71% 18. IDBI 44% 50% 65% 67% 80% 19. CanaraH 31% 39% 71% 81% 88% 20. DLFPar. 35% 40% 51% 24% 27% 21. AegonR 42% 48% 52% 66% 67% 22. Star U 54% 58% 81% 86% 90% 23. India F 48% 54% 82% 82% 71% 24. EdleWT NA NA NA 100% 45%
  • 45.
    A STUDY OFTHE IMPACT OF LIBERALIZATION ON THE INDIAN LIFE INSURANCE INDUSTRY Page 44 CHAPTER- V LIMITATION OF THE STUDY There are many other issues or effects of liberalization and all of them cannot be examined here. The main problem faced was the shortage of data. Due to time lag in publishing official data, the data considered was from financial year 2001-02 to 2012-13. Sometimes, there was lack of consistency and uniformity in the format of the data or annual reports published. Therefore the study has limited itself to analyze and interpret the impact of insurance liberalization on the topics of concentration and efficiency. In analyzing these topics, the methodology and variables used are also restricted to the available data. The results from this study need to be interpreted with some amount of caution as 12 years may not be sufficient time for a complete overhaul of the industry, and many trends may only be indicative. The number of insurers are taken varies from analysis to analysis. In some cases, top 5 private sector insurers (in terms of total premium and net earnings) are taken for the study instead of all the insurers, as the data pertaining to new entrants are not available or may deteriorate the overall result. In some cases, 18 insurers are taken for calculations due to unviability of data.
  • 46.
    A STUDY OFTHE IMPACT OF LIBERALIZATION ON THE INDIAN LIFE INSURANCE INDUSTRY Page 45 CHAPTER- VI CONCLUSION The current reforms in Indian insurance sector have facilitated many functional changes over the past decade. This project aims to provide an assessment of deregulation with respect to industry scenario, concentration and efficiency in the Indian life insurance industry. The entry of private players in insurance was needful and justifiable in order to enhance the efficiency. It also tries to find out how the reforms have benefited Indian life insurance industry. An overview of present market scenario is compared to that of pre liberalization market. The changes in market structure are examined in terms of market concentration as well as insurers efficiency. The insurance sector was seen to have many new entrants and made a robust growth in terms of huge volume of business underwritten by the companies and overall growth of the market. In addition, India is poised to experience major changes in its insurance markets as insurers operate in an increasingly deregulated and liberalized environment. Liberalization, deregulation, privatization and globalization of insurance sector have been the major trend worldwide in the last two decades. Outcomes of the study on deregulation and liberalization differ from analysis to analysis. On an average, the studies reviewed shows that liberalization has positive impact on efficiency growth. Project study relating to Indian industry covered varying aspects such as emerging strategic and regulatory issues in light of liberalization, appraisal of industry development, structure, innovation etc. The change in structure of life insurance with the coming of private insurers and the intensity of changes is analyzed with CR1 (market share of largest insurer), CR4 (market share of 4 largest insurer), Herfindahl Hirschman index (HHI) as well as ROA, ROE and Expense ratio. These statistical technics shows the actual condition of industry as well as insurance firm. Financial technics shows the financial positions of particular firms.
  • 47.
    A STUDY OFTHE IMPACT OF LIBERALIZATION ON THE INDIAN LIFE INSURANCE INDUSTRY Page 46 BIBLIOGRAPHY I - Books  Balasubramanian, T.S. and S.P. Gupta,(2000) - “Insurance Business Environment”  Srivastava, D.C. and Srivastava, S. (2001) -“Indian Insurance Industry–Transition and Prospects” II - Papers/Articles  Kshetrimayum Sobita Devi (2011) “The Impact of Liberalization on the Indian Life Insurance Industry”.  Tapen Sinha, CRIS Discussion Paper Series-2002.X, the University of Nattingham, Mexico.  Bhave S.R (1970), Saga of Security: Story of Indian Life insurance (1870-1970).  Goyal K. A. (2006) ―Impact of Globalization on Developing Countries (With Special Reference to India) “International Research Journal of Finance and Economics, ISSN 1450-2 887 Issue 5. III -Web Resources  www.avivaindia.com  www.bajajallianz.com  www.birlasunlife.com  www.hdfcinsurance.com  www.iciciprulife.com  www.ingvysyalife.com  www.irda.org.in  www. insurance.kotak.com  www.licindia.org  www.maxnewyorklife.com  www.metlife.co.in  www.mospi.nic.in  www.reliancelife.co.in  www.sbilife.co.in  www.sharalife.com
  • 48.
    A STUDY OFTHE IMPACT OF LIBERALIZATION ON THE INDIAN LIFE INSURANCE INDUSTRY Page 47  www.shriramlife.com  www.swissre.com  www.tata-aig-life.com  www.wikipedia .com  www.moneycontrol.com  www.investopedia.com http://calculator.tutorvista.com/math-calculator.html (For calculations of Logs and Antilog).
  • 49.
    A STUDY OFTHE IMPACT OF LIBERALIZATION ON THE INDIAN LIFE INSURANCE INDUSTRY Page 48 Appendices Table A.1- Total life insurance premium (Rs. Crore) Insurers 2001-02 2002-03 2003-04 2004-05 2005-06 2006-07 2007-08 2008-09 2009-10 2010-11 2011-12 2012-13 LIC 49821.91 54628.49 63533.43 75127.29 90792.22 127822.80 149790.00 157288.04 186077.31 203473.40 202889.28 208803.58 ICICI 116.38 417.62 989.28 2363.82 4261.05 7912.99 13561.06 15356.22 16531.88 17880.63 14021.58 13538.24 Max 38.95 96.59 215.25 413.43 788.13 1500.28 2714.60 3857.26 4860.54 5812.63 6390.53 6638.70 HDFC 33.46 148.83 297.76 686.63 1569.91 2855.87 4858.56 5564.69 7005.10 9004.17 10202.40 11322.68 Birla 28.26 143.92 537.54 915.47 1259.68 1776.71 3272.19 4571.80 5505.66 5677.07 5885.36 5216.30 Tata 21.14 81.21 253.53 497.04 880.19 1367.18 2046.35 2747.50 3493.78 3985.22 3630.30 2760.43 SBI 14.69 72.39 225.67 601.18 1075.32 2928.49 5622.14 7212.10 10104.03 12911.64 13133.74 10450.03 Kotak 7.58 40.32 150.72 466.16 621.85 971.51 1691.14 2343.19 2868.05 2975.51 2937.43 2777.78 Bajaj 7.14 69.17 220.80 1001.68 3133.58 4302.74 9725.31 10624.52 11419.71 9609.95 7483.80 6892.70 ING V 4.19 21.16 88.51 338.86 425.38 707.20 1158.87 1442.28 1642.65 1708.95 1679.98 1742.36 Met 0.48 7.91 28.73 81.53 205.99 492.71 1159.54 1996.64 2536.01 2508.17 2677.50 2429.52 Reliance 0.28 6.47 31.06 106.55 224.21 1004.66 3225.44 4932.54 6604.90 6571.15 5497.62 4045.39 Aviva -- 13.47 81.50 253.42 600.27 1147.23 1891.88 1992.87 2378.01 2345.17 2415.87 2140.67 Sahara -- -- -- 1.74 27.66 51.00 143.49 206.47 250.59 243.41 225.95 205.38 Shriram -- -- -- -- 10.33 181.17 358.05 436.17 611.27 821.52 644.16 618.07 Bharti -- -- -- -- -- 7.78 118.41 360.41 669.73 792.02 774.16 744.52 Future -- -- -- -- -- -- 2.49 152.60 541.51 726.16 779.58 678.29 IDBI -- -- -- -- -- -- 11.90 318.97 571.12 811.00 736.70 804.68 CanarH -- -- -- -- -- -- -- 296.41 842.45 1531.86 1861.08 1912.15 DLFPra -- -- -- -- -- -- -- 3.37 165.65 95.04 167.01 236.79 AegoR -- -- -- -- -- -- -- 31.21 38.44 165.65 457.32 430.50 Star U -- -- -- -- -- -- -- 50.19 530.37 933.31 1271.95 1068.80 IndiaF -- -- -- -- -- -- -- -- 201.60 201.60 1297.93 1690.08 EdelWT -- -- -- -- -- -- -- -- -- -- 10.88 54.83 Pvt total 272.55 1119.06 3120.35 7727.51 15083.55 27207.52 51561.42 64497.41 79373.05 79369.94 84182.83 78398.91 I. Total 50094.46 55747.55 66653.78 82854.80 105875.80 155030.40 201351.40 221785.45 265450.36 265447.25 287072.11 287202.49
  • 50.
    A STUDY OFTHE IMPACT OF LIBERALIZATION ON THE INDIAN LIFE INSURANCE INDUSTRY Page 49 Table A.2- Equity share capital of life insurers (Rs Crore) Insurers 2002 2003 2004 2005 2006 2007 2008 2009 2010 2011 2012 2013 LIC 5.00 5.00 5.00 5.00 5.00 5.00 5.00 5.00 5.00 5.00 100.00 100.00 ICICI 190.00 425.00 675.00 925.00 1185.00 1312.30 1401.11 1427.26 1428.14 1428.46 1428.85 1428.94 Max 250.00 255.00 346.08 466.08 557.43 732.43 1032.43 1782.43 1838.82 1841.00 1944.69 1944.69 HDFC 168.00 218.00 255.50 320.00 620.00 801.26 1271.00 1796.00 1968.00 1994.88 1994.88 1994.88 Birla 150.00 180.00 290.00 350.00 460.00 671.50 1274.50 1879.50 1969.50 1969.50 1969.50 1969.50 Tata 185.00 185.00 231.00 321.00 447.00 547.00 870.00 1519.50 1920.50 1953.50 1953.50 1953.50 SBI 125.00 125.00 175.00 350.00 425.00 500.00 1000.00 1000.00 1000.00 1000.00 1000.00 1000.00 Kotak 101.00 131.30 151.26 211.76 244.58 330.35 480.27 510.29 510.29 510.29 510.29 510.29 Bajaj 150.00 150.03 150.07 150.07 150.23 150.37 150.71 150.70 150.71 150.71 150.71 150.71 ING V. 110.00 170.00 245.00 325.00 490.00 690.00 790.00 1019.15 1019.15 1464.88 1464.88 1464.88 Met 110.00 110.00 160.00 235.00 235.00 530.00 761.08 1580.00 1774.79 1969.57 1969.57 2012.88 Reliance 125.00 125.00 160.00 217.10 331.00 664.00 1147.70 1160.43 1164.65 1165.84 1196.32 1196.32 Aviva -- 154.80 242.80 319.80 458.70 758.20 1004.50 1491.80 1888.80 2004.90 2004.90 2004.90 Sahara -- -- 157.00 157.00 157.00 157.00 232.00 232.00 232.00 232.00 232.00 232.00 Shriram --- -- -- -- 125.00 125.00 125.00 125.00 125.00 175.00 175.00 175.00 Bharti -- -- -- -- 1.10 150.00 366.11 668.43 1131.35 1525.35 1718.65 1807.20 Future -- -- -- -- -- -- 185.00 468.50 702.00 1052.00 1203.00 1452.00 IDBI -- -- -- -- -- -- 200.00 450.00 450.00 700.00 800.00 800.00 Canara H -- -- -- -- -- -- -- 400.00 500.00 700.00 800.00 950.00 DLF Pra. -- -- -- -- -- -- -- 137.05 221.30 293.96 305.17 320.02 Aegon R -- -- -- -- -- -- -- 300.00 570.00 950.00 1135.00 1176.00 Star U -- -- -- -- -- -- -- 150.00 250.00 250.00 250.00 250.00 India First -- -- -- -- -- -- -- -- 200.00 325.00 475.00 475.00 EdelWT -- -- -- -- -- -- -- -- -- -- 150.00 150.00 Pvt total 1664.00 2229.13 3238.71 4347.81 5887.04 8119.41 12291.41 18248.04 21015.00 23656.85 24831.92 25418.72 Total 1669.00 2234.13 3243.71 4352.81 5892.04 8124.41 12296.41 18253.04 21020.00 23661.85 24931.92 25518.72