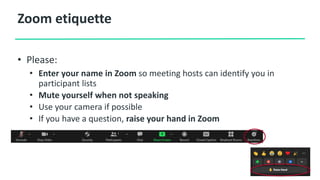
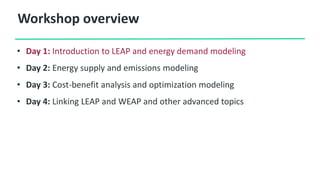
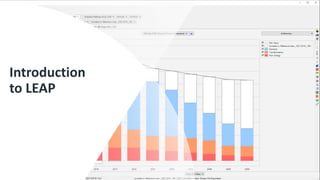
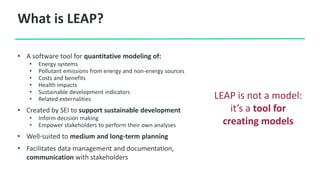
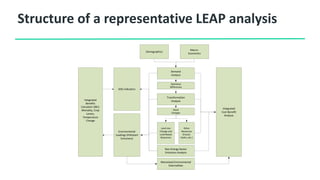
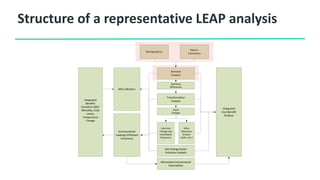
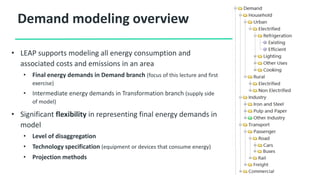
Eight lectures were delivered in 2021 as a series of webinars organized by SEI, with support from the Swedish International Development Cooperation agency (Sida). Delivered by Jason Veysey and Charlotte Wagner of SEI.
This presentation is for lectures #1 and #2: An introduction to LEAP, including its key features, history, structure, user interface, and terminology, and modelling energy demand with LEAP, including definitions, concepts, and methods.
Find out more about this course here: https://www.weadapt.org/knowledge-base/synergies-between-adaptation-and-mitigation/introductory-low-emissions-analysis-platform-leap-training-course-2021
Sida LEAP Training Lecture #3 and #4: Energy Supply and Emissions ModelingweADAPT
Eight lectures were delivered in 2021 as a series of webinars organized by SEI, with support from the Swedish International Development Cooperation agency (Sida). Delivered by Jason Veysey and Charlotte Wagner of SEI.
This presentation is for lectures #3 and 4: Energy Supply and Emissions Modeling.
Find out more about this course here: https://www.weadapt.org/knowledge-base/synergies-between-adaptation-and-mitigation/introductory-low-emissions-analysis-platform-leap-training-course-2021
Climate Change: Implications for EnergyECFoundation
The Fifth Assessment Report from the
Intergovernmental Panel on Climate Change is the
most comprehensive and relevant analysis of our
changing climate. It provides the scientific fact base
that will be used around the world to formulate
climate policies in the coming years.
This document is one of a series synthesizing the most pertinent findings of AR5 for specific economic and business sectors. It was born of the belief
that the energy sector could make more use of AR5, which is long and highly technical, if it were distilled into an accurate, accessible, timely, relevant and readable summary. Although the information presented here is a ‘translation’ of the key content relevant to this sector from AR5, this summary report adheres to the rigorous scientific basis of the original source material.
The basis for information presented in this overview report can be found in the fully-referenced and peer-reviewed IPCC technical and scientific background reports at: www.ipcc.ch
Energy Management PowerPoint Presentation SlidesSlideTeam
This complete deck can be used to present to your team. It has PPT slides on various topics highlighting all the core areas of your business needs. This complete deck focuses on Energy Management PowerPoint Presentation Slides and has professionally designed templates with suitable visuals and appropriate content. This deck consists of total of sixty five slides. All the slides are completely customizable for your convenience. You can change the colour, text and font size of these templates. You can add or delete the content if needed. Get access to this professionally designed complete presentation by clicking the download button below. http://bit.ly/2HcxVBI
Energy Transition - A comprehensive approachSampe Purba
this Paper discuss that a transition energy can be reached by the lining streaming of Supply, Demand, Infrastructure, Commerciality and regulation. However, any transitional energy has to consider the technology, existing power generation and the ability to absorb and competitiveness
Philippine Energy Plan: Towards a Sustainable and Clean Energy Future - Felix...OECD Environment
1st Clean Energy Finance and Investment Consultation Workshop: “Unlocking finance and investment for clean energy in the Philippines” 31 May – 1 June 2022, Makati Diamond Residences, Legazpi Village, Makati City
This presentation focuses on risk assessment and financing options for renewable energy projects. Learn about carbon finance prospects for renewable energy projects.
A #COP26 presentation by Zainab Usman of Carnegie Endowment for International Peace and Katie Auth of Energy for Development, building on this paper: September 28, 2021
REFRAMING CLIMATE JUSTICE FOR DEVELOPMENT: SIX PRINCIPLES FOR SUPPORTING INCLUSIVE AND EQUITABLE ENERGY TRANSITIONS IN LOW-EMITTING ENERGY-POOR AFRICAN COUNTRIES
By Mimi Alemayehou, Katie Auth, Murefu Barasa, Morgan Bazilian, Brad Handler, Uzo Iweala, Todd Moss, Rose Mutiso, Zainab Usman
Advancing inclusive and equitable energy transitions is one of this century’s most vital global challenges, and one in which development finance will play a crucial role. References to justice and equity are widespread in international climate policy, and are increasingly being used by development organizations to guide their own work, including support for energy transitions.
But prevailing definitions of climate justice rarely fully capture the priorities, challenges and perspectives of low-emitting energy-poor countries, the vast majority of which are in sub-Saharan Africa. When applied to development policy, this gap risks prioritizing near-term emissions reductions over broader support for economic development and energy transformation, with comparatively little climate benefit. This could severely hinder poverty alleviation, development, and climate resilience — the very opposite of justice. We need energy transitions that are truly ‘just and inclusive.’ What does this mean for development funders and financiers, and how should it drive their approach to supporting energy transitions in the lowest-income countries?
My presentation at the "Third Annual Conference of the Transatlantic University Collaboration for Climate and Energy Law" on 28 April 2021 in Oslo https://www.jus.uio.no/nifs/english/research/events/2021/04-28-tucccel.html
Optimized Energy Management and Planning Tools for the Iron and Steel IndustrySchneider Electric
Copyright AIST Reprinted with Permission. Presented at the 2013 Iron and Steel Technology Conference and Exposition (AISTech 2013). According to EDF (environmental defense fund) the energy cost for the U.S. iron and steel industry reached U$ 6.8B / year (2008). The industry has improved its energy efficiency significantly over the last decade, however, there are more energy savings opportunities to be explored.
Greenhouse Gas Accounting Scope 2 Guidance: New developments in corporate GHG accounting for electricity. Find out more and download guidance at http://www.ghgprotocol.org/scope_2_guidance
Renewable Energy Certificate (REC) MechanismKranav Sharma
This presentation provides a proper introduction to the Renewable Energy Certificate (REC) mechanism in India; a possible tool for obligated entities to satisfy their Renewable Purchase Obligation (RPO) compliance. It includes the general background, need for, objectives, implementation and other key elements of the REC mechanism.
Conferencia de Jeffrey Sachs en Madrid el 28 de mayo de 2019, en la jornada "La transformación ineludible: investigación e innovación para acelerar el cumplimiento de la Agenda 2030"
Linking the energy crisis with climate change, Ritu Mathu, TERI University, I...ESD UNU-IAS
This lecture is part of the 2016 ProSPER.Net Young Researchers’ School on sustainable energy for transforming lives: availability, accessibility, affordability
Sida LEAP Training Lectures #7 and #8: Linking LEAP and WEAP and other advanc...weADAPT
Eight lectures were delivered in 2021 as a series of webinars organized by SEI, with support from the Swedish International Development Cooperation agency (Sida). Delivered by Jason Veysey and Charlotte Wagner of SEI.
This presentation is for lectures #7 and #8: Linking LEAP and WEAP and other advanced topics
Find out more about this course here: https://www.weadapt.org/knowledge-base/synergies-between-adaptation-and-mitigation/introductory-low-emissions-analysis-platform-leap-training-course-2021
Assessing Renewable Energy Potential Using the Geospatial Toolkit (GsT): Appl...Worldwatch Institute
This webinar includes an overview and demonstration of the desktop-based Geospatial Toolkit and the web-based Enterprise Geospatial Toolkit. Participants will also learn how the Geospatial Toolkit was used in Vietnam to support the development of Thanh Hoa’s Green Growth Initiative.
The Geospatial Toolkit is a desktop-based application produced for individual countries or regions that allows data visualization and guided geospatial analysis of high-level renewable energy development issues (wind, solar, and/or biomass depending on data availability). The Geospatial Toolkit is designed for use by non-geospatial professionals, but also provides access to the geospatial layers for more advanced analysis. Geospatial Toolkits have been produced for several countries/regions in Asia, and around the world.
The Geospatial Toolkit is recognized as a valuable tool providing decision makers with the ability to visualize the renewable energy resources relative to their infrastructure and conduct guided, quantitative analysis of high-level renewable energy resource potential under different scenarios. It can be used to identify areas with large amounts of renewable energy resource potential and/or few barriers to development, allowing more efficient targeting of detailed site analysis needs. The desktop version of the Toolkit is an open-source application, packaged with public data to allow widespread access to the application. Recently a web-based version, the Enterprise Geospatial Toolkit, has been developed, improving access to more spatially and temporally detailed datasets for analysis within the application and externally, improving performance, and providing access to enhanced analysis capabilities.
Speakers:
Jon Duckworth, National Renewable Energy Laboratory (NREL)
Donna Heimiller, National Renewable Energy Laboratory
Khanh Nguyen, USAID Low Emission Asian Development (LEAD) Program Country Coordinator
Moderators:
Sandra Khananusit, Asia LEDS Partnership Secretariat
Alexander Ochs, LEDS GP Energy Working Group
this is presentation on energy star in building.LongBun1
Save Energy
If you haven’t already, set up an account in ENERGY STAR Portfolio Manager to start benchmarking your building. Benchmarking will help you identify underperforming buildings to target for cost-effective measures and help you verify reductions from energy-saving efforts.
Conduct a Treasure Hunt
The first step to saving energy in your building is to start by looking. During an Energy Treasure Hunt, teams walk around a facility looking for quick ways to save energy. Those quick fixes can add up to big savings. Hundreds of organizations have used Energy Treasure Hunts to reduce their facilities’ energy use by 15 percent or more.
Ways to Save
Start saving with no- and low-cost approaches, and then use savings to pay for more extensive upgrades:
Upgrade your lighting. If your building relies on inefficient lighting, such as incandescent, halogen, HID, or T12 fluorescent, you’re missing out on significant savings. Updating your lighting can be a great first step when it comes to making your building an efficient one.
Operations & maintenance best practices. Efficient building operation reduces operating costs, maintains comfort, and extends equipment lifetime, all without significant capital investment.
Checklists of energy-saving measures. These checklists include energy-saving measures that can be implemented at no or low cost, or with rapid payback.
Energy-efficient products. Purchasing efficient products reduces energy costs without compromising quality. Learn more about ENERGY STAR certified products, estimate potential savings, and specify them in your purchasing policies and contracts.
Energy-saving competitions. Competitions can be a great way to motivate your team to find new efficiencies, engage occupants in your efforts, and multiply savings across your portfolio – all while helping the environment.
Building upgrades. Maximize your financial and energy savings by taking a staged approached to building upgrades that accounts for energy flows among systems.
Water, waste, and renewable energy. Check out EPA resources to expand your sustainability work to reduce water use, manage waste and materials, or purchase or install renewable energy.
Find Expert Help
EPA’s network of service and product providers (SPPs) have partnered with ENERGY STAR to offer you expert help with energy management when you need it. Many also offer innovative financing options and can help you identify, prioritize, and implement energy projects that not only cut costs and offset emissions, but can make your building more comfortable, too.
Evaluate the Economics of Energy Efficiency Projects
Making the business case for energy efficiency-related capital expense requires economic analysis. EPA provides several tools to help evaluate the economics of an energy efficiency project.
MEEA staff Rose Jordan and Catie Krasner led a session walking Illinois school representatives through Pillar 1 and the concept of building a sustainability roadmap. The presentation included advice, guidelines, and resources available for energy benchmarking and auditing as well as free EPA tools available to measure other sustainability metrics (e.g., water, waste, etc.).
Presentation at the “Green Stormwater Infrastructure Consulting: Chat with the Experts” seminar at the Atlantic Builders Convention on Wednesday, April 11, 2018 about green infrastructure tools for developers.
ONS Local has been established by the Office for National Statistics (ONS) to support evidence-based decision-making at the local level. We aim to host insightful events that connect our users with exciting developments happening in subnational statistics and analysis at the ONS and across other organisations.
On 28th June 2022, Census 2021 released their first results, followed by data covering eight topics and more recently launched a new ‘Create a custom dataset’ tool. We will take you through a tour of the products such as census maps, build a custom area profile, create your own custom dataset tool and pre-built tables, as well as census analysis plans and how you can carry out your own analysis using census data.
This event is open to all, however we anticipate it will be of most interest to anyone working at a local level on Census data or on any Census topics.
If you have any questions, please contact ons.local@ons.gov.uk
Sida LEAP Training Lectures #5 and #6: Cost-benefit analysis and optimization...weADAPT
Eight lectures were delivered in 2021 as a series of webinars organized by SEI, with support from the Swedish International Development Cooperation agency (Sida). Delivered by Jason Veysey and Charlotte Wagner of SEI.
This presentation is for lectures #5 and #6: Cost-benefit analysis and optimization modelling with LEAP and NEMO.
Find out more about this course here: https://www.weadapt.org/knowledge-base/synergies-between-adaptation-and-mitigation/introductory-low-emissions-analysis-platform-leap-training-course-2021
What to consider when integrating energy into Facilities ManagementeSightEnergy
"What to consider when integrating energy into Facilities Management" - Delivered by UK Sales Manager Dean Noden at the Facilities Management event, March 2015.
Despite being controversial, research metrics are becoming a key component of research evaluation processes globally. Nevertheless, accessing research metrics to support these processes in a timely manner is not a straightforward task, as it requires either having access to expensive commercial solutions such as Elsevier SciVal or Clarivate Analytics' InCites, or having substantial knowledge of existing APIs and data sources as well as the ability and skills needed to analyse large amounts of raw scholarly data in-house. This is especially the case on a department or institutional level where large amounts of data have to be aggregated prior to analysis. To alleviate this problem we have designed and prototyped CORE Analytics Dashboard – a tool for analytical evaluation of research outputs of universities. The aim of the CORE Analytics Dashboard is to help universities analyse their performance using a variety of metrics captured from openly available data sources, including citation counts and social media metrics, and to help them compare their performance with other institutions. This paper presents the motivation behind developing this dashboard and its main features.
ISO 50001 Presentation by Enerit at Industrial Energy Technology Conference 2015Arantico Ltd
Enerit, CEO, MIke Brogan presented at the Industrial Energy Technology Conference (IETC 2015) recently in New Orleans, USA. he presentation concentrated on the ISO 50001 Energy Planning process and why it is important the proper tools are used for carrying out energy review, identifying improvement opportunities and implementing a systematic approach for setting targets and prioritizing energy efficiency projects.
The IETC is hosted by the Energy Systems Laboratory at Texas A&M University and the Louisiana Department of Natural Resources. It is a one-of-a kind conference featuring a topics important to industrial energy managers, utility experts, government program managers, vendors and others.
apidays London 2023 - API Green Score, Yannick Tremblais & Julien Brun, Green...apidays
apidays London 2023 - APIs for Smarter Platforms and Business Processes
September 13 & 14, 2023
API Green Score : How to reduce the environmental impact of your APIs?
Yannick Tremblais, IT Innovation Manager for Groupe Rocher and Green API Score
Julien Brun, Head of APIs Center of Excellence at L’Oréal and Green API Score
------
Check out our conferences at https://www.apidays.global/
Do you want to sponsor or talk at one of our conferences?
https://apidays.typeform.com/to/ILJeAaV8
Learn more on APIscene, the global media made by the community for the community:
https://www.apiscene.io
Explore the API ecosystem with the API Landscape:
https://apilandscape.apiscene.io/
An introduction to how companies can begin to use data to identify energy waste, prioritise which buildings to focus on and drill down deeper into the data to maximise and report savings.
Energy Efficient Data Centres: the Engine to a Sustainable Digital EconomyXiao Wang
While digital is driving the industry growth, it is also feeding environmentally damaging consumption. Data centers as the engine of the digital economy are the fastest growing hidden monsters. If we run it inefficiently, it will turn into a power-hunger, heavy carbon and environmental threatening beast. Time to tame it through energy efficiency solutions.
A webinar exploring potential synergies and collaboration between European national, regional and transnational climate adaptation (knowledge) platforms (CAPs), EC-funded projects, and the Mission on Adaptation.
A number of European Commission (EC)-funded projects and the EU Mission Adaptation Community of Practice include as part of their respective work programmes, engaging with European national and regional/transnational climate adaptation (knowledge) platforms (CAPs).
IMC2022_Wikipedia for Science_for weADAPT.pptxweADAPT
This presentation for developed for a special session on why and how to use Wikipedia for science communication, given at the International Mountain Conference in Innsbruck, in September 2022.
Climate change and Mountains in East Africa The Adaptation at Altitude programmeweADAPT
This presentation was given on 30-03-2022 at the East Africa Mountains Regional Dialogue Event in Dar es Salaam, Tanzania, by Essey Daniel, Sabine McCallum, and Ansgar Fellendorf.
Adaptation at Altitude Programme in the South Caucasus (2021)weADAPT
This presentation by Sabine McCallum, Matthias Jurek, and Ansgar Fellendorf was delivered during the Adaptation at Altitude Regional Meeting: Taking Action Together for Resilient Mountain Communities in the South Caucasus, held on 14th December 2021.
Details of the event and its outcomes can be found here:
The global distribution of mountain adaptation projects by Simon AllenweADAPT
This presentation was delivered during the session "Upscaling adaptation solutions for vulnerable mountain regions through international cooperation" hosted by the Geneva Cryosphere Hub as part of a series of events held during COP26.
Find more about the event and watch the recording here: https://adaptationataltitude.org/knowledge-base/adaptation-in-mountains/upscaling-adaptation-solutions-for-vulnerable-mountain-regions-through-international-cooperation
Identifying adaptation solutions with upscaling potential within and beyond m...weADAPT
This presentation was delivered during the session "Upscaling adaptation solutions for vulnerable mountain regions through international cooperation" hosted by the Geneva Cryosphere Hub as part of a series of events held during COP26.
Find more about the event and watch the recording here: https://adaptationataltitude.org/knowledge-base/adaptation-in-mountains/upscaling-adaptation-solutions-for-vulnerable-mountain-regions-through-international-cooperation
Closing the Adaptation Gap in Mountains by Graham McDowell (2021)weADAPT
This presentation was delivered during the session "Upscaling adaptation solutions for vulnerable mountain regions through international cooperation" hosted by the Geneva Cryosphere Hub as part of a series of events held during COP26.
Find more about the event and watch the recording here: https://adaptationataltitude.org/knowledge-base/adaptation-in-mountains/upscaling-adaptation-solutions-for-vulnerable-mountain-regions-through-international-cooperation
Read the journal article on which this presentation is based here: https://bioone.org/journals/mountain-research-and-development/volume-41/issue-3/MRD-JOURNAL-D-21-00033.1/Closing-the-Adaptation-Gap-in-Mountains/10.1659/MRD-JOURNAL-D-21-00033.1.full
A whistle-stop tour of lessons learned through KE4CAPweADAPT
Presentation for the KE4CAP Synthesis Workshop: https://www.weadapt.org/knowledge-base/climate-change-adaptation-knowledge-platforms/final-ke4cap-synthesis-workshop
Plenary discussion 2: Questions from Local Climate Change Adaptation Centers ...weADAPT
Plenary discussion 2: Questions from Local Climate Change Adaptation Centers (LCCACs) in Japan
These questions have been compiled for the first of the BKE EU-Japan events: Enhancing Connections Across International, National and Local Adaptation Actions.
More details about the events can be found here: https://www.weadapt.org/knowledge-base/climate-change-adaptation-knowledge-platforms/bke-eu-japan-event
The role of CAS in enhancing the links between national and local adaptation ...weADAPT
The role of CAS in enhancing the links between national and local adaptation action in the Netherlands, Kim van Nieuwaal, Climate Adaptation Services.
This presentations is one of several produced for the BKE EU-Japan events: Enhancing Connections Across International, National and Local Adaptation Actions.
More details about the events can be found here: https://www.weadapt.org/knowledge-base/climate-change-adaptation-knowledge-platforms/bke-eu-japan-event
Professional air quality monitoring systems provide immediate, on-site data for analysis, compliance, and decision-making.
Monitor common gases, weather parameters, particulates.
THE IMPORTANCE OF MARTIAN ATMOSPHERE SAMPLE RETURN.Sérgio Sacani
The return of a sample of near-surface atmosphere from Mars would facilitate answers to several first-order science questions surrounding the formation and evolution of the planet. One of the important aspects of terrestrial planet formation in general is the role that primary atmospheres played in influencing the chemistry and structure of the planets and their antecedents. Studies of the martian atmosphere can be used to investigate the role of a primary atmosphere in its history. Atmosphere samples would also inform our understanding of the near-surface chemistry of the planet, and ultimately the prospects for life. High-precision isotopic analyses of constituent gases are needed to address these questions, requiring that the analyses are made on returned samples rather than in situ.
Nutraceutical market, scope and growth: Herbal drug technologyLokesh Patil
As consumer awareness of health and wellness rises, the nutraceutical market—which includes goods like functional meals, drinks, and dietary supplements that provide health advantages beyond basic nutrition—is growing significantly. As healthcare expenses rise, the population ages, and people want natural and preventative health solutions more and more, this industry is increasing quickly. Further driving market expansion are product formulation innovations and the use of cutting-edge technology for customized nutrition. With its worldwide reach, the nutraceutical industry is expected to keep growing and provide significant chances for research and investment in a number of categories, including vitamins, minerals, probiotics, and herbal supplements.
Multi-source connectivity as the driver of solar wind variability in the heli...Sérgio Sacani
The ambient solar wind that flls the heliosphere originates from multiple
sources in the solar corona and is highly structured. It is often described
as high-speed, relatively homogeneous, plasma streams from coronal
holes and slow-speed, highly variable, streams whose source regions are
under debate. A key goal of ESA/NASA’s Solar Orbiter mission is to identify
solar wind sources and understand what drives the complexity seen in the
heliosphere. By combining magnetic feld modelling and spectroscopic
techniques with high-resolution observations and measurements, we show
that the solar wind variability detected in situ by Solar Orbiter in March
2022 is driven by spatio-temporal changes in the magnetic connectivity to
multiple sources in the solar atmosphere. The magnetic feld footpoints
connected to the spacecraft moved from the boundaries of a coronal hole
to one active region (12961) and then across to another region (12957). This
is refected in the in situ measurements, which show the transition from fast
to highly Alfvénic then to slow solar wind that is disrupted by the arrival of
a coronal mass ejection. Our results describe solar wind variability at 0.5 au
but are applicable to near-Earth observatories.
This pdf is about the Schizophrenia.
For more details visit on YouTube; @SELF-EXPLANATORY;
https://www.youtube.com/channel/UCAiarMZDNhe1A3Rnpr_WkzA/videos
Thanks...!
Slide 1: Title Slide
Extrachromosomal Inheritance
Slide 2: Introduction to Extrachromosomal Inheritance
Definition: Extrachromosomal inheritance refers to the transmission of genetic material that is not found within the nucleus.
Key Components: Involves genes located in mitochondria, chloroplasts, and plasmids.
Slide 3: Mitochondrial Inheritance
Mitochondria: Organelles responsible for energy production.
Mitochondrial DNA (mtDNA): Circular DNA molecule found in mitochondria.
Inheritance Pattern: Maternally inherited, meaning it is passed from mothers to all their offspring.
Diseases: Examples include Leber’s hereditary optic neuropathy (LHON) and mitochondrial myopathy.
Slide 4: Chloroplast Inheritance
Chloroplasts: Organelles responsible for photosynthesis in plants.
Chloroplast DNA (cpDNA): Circular DNA molecule found in chloroplasts.
Inheritance Pattern: Often maternally inherited in most plants, but can vary in some species.
Examples: Variegation in plants, where leaf color patterns are determined by chloroplast DNA.
Slide 5: Plasmid Inheritance
Plasmids: Small, circular DNA molecules found in bacteria and some eukaryotes.
Features: Can carry antibiotic resistance genes and can be transferred between cells through processes like conjugation.
Significance: Important in biotechnology for gene cloning and genetic engineering.
Slide 6: Mechanisms of Extrachromosomal Inheritance
Non-Mendelian Patterns: Do not follow Mendel’s laws of inheritance.
Cytoplasmic Segregation: During cell division, organelles like mitochondria and chloroplasts are randomly distributed to daughter cells.
Heteroplasmy: Presence of more than one type of organellar genome within a cell, leading to variation in expression.
Slide 7: Examples of Extrachromosomal Inheritance
Four O’clock Plant (Mirabilis jalapa): Shows variegated leaves due to different cpDNA in leaf cells.
Petite Mutants in Yeast: Result from mutations in mitochondrial DNA affecting respiration.
Slide 8: Importance of Extrachromosomal Inheritance
Evolution: Provides insight into the evolution of eukaryotic cells.
Medicine: Understanding mitochondrial inheritance helps in diagnosing and treating mitochondrial diseases.
Agriculture: Chloroplast inheritance can be used in plant breeding and genetic modification.
Slide 9: Recent Research and Advances
Gene Editing: Techniques like CRISPR-Cas9 are being used to edit mitochondrial and chloroplast DNA.
Therapies: Development of mitochondrial replacement therapy (MRT) for preventing mitochondrial diseases.
Slide 10: Conclusion
Summary: Extrachromosomal inheritance involves the transmission of genetic material outside the nucleus and plays a crucial role in genetics, medicine, and biotechnology.
Future Directions: Continued research and technological advancements hold promise for new treatments and applications.
Slide 11: Questions and Discussion
Invite Audience: Open the floor for any questions or further discussion on the topic.
Sida LEAP Training Lectures #1 and #2: Introduction to LEAP
1. SEI Asia Centre
Training on Low Emissions Analysis Platform
Day 1: 19 October 2021
Charlotte Wagner
Scientist, Energy Modeling Program
Stockholm Environment Institute
charlotte.wagner@sei.org
Jason Veysey
Deputy Director, Energy Modeling Program
Stockholm Environment Institute
jason.veysey@sei.org
2. Stockholm Environment Institute
• Bridging science and policy – an independent, non-
profit research institute focused on sustainable
development
• Over 200 staff worldwide: headquarters in Sweden,
centers in the U.S., Kenya, Colombia, Great Britain,
Thailand, Estonia
• Principal research areas: climate mitigation and
adaptation, energy, air pollution, water resources,
climate finance, environmental economics
• Commitment to stakeholder inclusion, capacity
development, and transparency
A sustainable future for all
3. Workshop registration
Please register your attendance daily
Participants need to register for at least 3 days
to be eligible for an attendance certificate
Registration link day 1
https://tinyurl.com/LEAP-SEIAsia-Day1
5. • Please:
• Enter your name in Zoom so meeting hosts can identify you in
participant lists
• Mute yourself when not speaking
• Use your camera if possible
• If you have a question, raise your hand in Zoom
Zoom etiquette
6. Workshop overview
• Day 1: Introduction to LEAP and energy demand modeling
• Day 2: Energy supply and emissions modeling
• Day 3: Cost-benefit analysis and optimization modeling
• Day 4: Linking LEAP and WEAP and other advanced topics
8. What is LEAP?
• A software tool for quantitative modeling of:
• Energy systems
• Pollutant emissions from energy and non-energy sources
• Costs and benefits
• Health impacts
• Sustainable development indicators
• Related externalities
• Created by SEI to support sustainable development
• Inform decision making
• Empower stakeholders to perform their own analyses
• Well-suited to medium and long-term planning
• Facilitates data management and documentation,
communication with stakeholders
LEAP is not a model:
it’s a tool for
creating models
9. Key characteristics
• Broad scope, flexible data structures
• Capable of providing results in data-scarce environments
• Multiple modeling methodologies supported
• User-selected modeling methods embedded in an accounting
framework (energy, emissions, costs, natural resources)
• Scenario-based: scenarios for different policies, assumptions,
analytical questions
• Graphical user interface, powerful visualizations
• Suitable for modeling at various scales: national, subnational,
regional, global
• Libraries of default data: units, pollutants, fuels, emission factors
• Annual time step with seasonal/time-of-day details
• Integration with Microsoft Office
• Widely used for energy planning, national communications, low
emission development strategies, air pollution action plans
10. LEAP Timeline
1980: Mainframe model
for Kenya Fuelwood
project
1985: PC version. Studies
in Africa, Asia, and Latin
America
1992: GHG
emissions modeling
1980 1985 1990 1995 2000 2005 2010 2015 2020
1994: Chinese
version
1997: GHG mitigation assessments
2000: Windows
version
2006: API allowing
links to other models
2011: Least-cost optimization modeling
2012: “Energy for a Shared Development
Agenda”: global energy model
2013: Energy-water nexus analysis: link
to WEAP water planning tool
2015: LEAP-IBC for analysis of impacts from
air pollution
2016: New results
visualization capabilities
2020: Advanced
optimization
modeling, results
mapping, indoor air
pollution assessment
Four decades of
development and
implementation
Number of LEAP users over time Users by region Types of users
2021: Net-zero
GHG emissions
studies
11. Distribution
• User name and password required to fully enable software. Available on completion of a license
agreement
• License cost
• Free for all students
• Free for non-profit, academic, and governmental institutions in low-income and lower-middle-income
countries
• Nominal cost for non-profit, academic, and government users in upper-middle income countries
• Full-cost license for all other users
• Simple and quick to apply for a license online
• Technical support available though LEAP website or leap@sei-us.org
Access via the LEAP website: https://leap.sei.org/
12. Prerequisites
• Windows application
• Windows 7 or later
• Not supported on Mac, Linux, or
Unix
• At least 4 GB RAM
• At least 1 GB free disk space
• Administrator rights for installation
14. Typical inputs…
• Demographic and macroeconomic data and projections
• Energy balances, surveys, and audits
• GHG inventories
• Activity data
• Emission factors
• Emission totals
• Grid operator reports
• Equipment stock, sales, and performance data
• Natural resource reserves and potentials
• Plans and policies
• Climate
• Energy
• Air pollution
• Costs
• Equipment capital, operation and maintenance
• Fuel and other consumables
• Policy implementation
15. … and outputs
• Energy demand and supply
• Domestic/local production
• Imports and exports
• Pollutant emissions – direct and indirect
• Social costs
• Real and discounted
• Baseline and policy scenarios
• Energy balances and Sankey diagrams
• Equipment capacities, stocks, and utilization
• Natural resource exploitation
• Impacts of air pollution
• Decomposition analyses
• Marginal abatement cost curves (MACCs)
• Other user-defined indicators
Mitigation
Demand 5.00
Household 0.73
Industry 1.70
Transport 2.56
Commercial -
Transformation -3.00
16. Time frame
• LEAP is intended as a medium- to long-term modeling tool
• Most of its calculations occur on an annual time-step
• The modeling horizon can extend for an unlimited number
of years, but most studies use a forecast period of 20-50
years
• Energy demand and supply for selected fuels/sectors (e.g.,
electricity) can be calculated with a finer level of temporal
detail
• Years are split into user-defined “time slices” representing
seasons, types of days, and times of day
• Demand is determined by time slice, and supply is dispatched by
time slice to meet demand
• Time slices can easily be reconfigured to explore impacts of
temporal resolution on results
17. LEAP user interface: Views
Analysis is where you enter or view input data and construct your model and scenarios
Results is where you examine the outcomes of your scenarios as graphs and tables
Energy Balance lets you see calculated energy results as specially formatted energy balance tables
and Sankey diagrams
Summaries allows you to create your own customized tabular reports, including cost-benefit
summary reports, MACCs, and decomposition analyses
Overviews is used to group together “Favorite” charts created earlier in the Results view
Technology Database provides default data on the technical characteristics, costs, and environmental
impacts of various energy technologies available internationally and in particular regions
Notes is a simple word processing tool with which you can enter documentation and references for
different parts of your model
18. User interface
Choose a
different
view
here.
Input data can be reviewed in
chart or table format.
The status bar indicates
the current LEAP version,
model, view, and user.
The main menu and
toolbar provide access
to major options.
Select a
scenario here.
Choose
units and
scaling
factors
here.
Edit data and
expressions (formulas)
by typing here.
Data are organized
in a tree. Available
variables depend
on your location!
Analysis View:
model design and
construction
Choose
an input
variable
here.
Use the Notes tab
to document your
model.
Use the
Builder tab if
you need
more room
when typing
an expression.
19. User interface
Results View:
results visualization
and analysis
Define chart series here:
branches, pollutants, fuels,
scenarios, years, and more.
Define a chart’s x-axis here:
branches, pollutants, fuels,
scenarios, years, and more.
The data shown and available
output options depend on your
location in the tree.
Choose an output
variable here.
Results can be shown in
chart, table, or map format.
Set other context-
specific options here.
Export outputs directly
to Excel and PowerPoint.
Change chart types,
colors, and other
formatting here.
Charts can be saved
as Favorites, which
can then be grouped
and plotted together
in the Overviews
view.
20. The tree
• Defines a model’s structure – organizes
input data and results
• Made up of branches; each branch contains
context-dependent variables
• Supports standard graphical user interface
interactions – copy & paste, click & drag
• LEAP sets top-level branches depending on
model’s scope; other branches generally
determined by user
21. Types of tree branches
Categories: used mainly for organizing other
branches
Technologies: final-energy consuming devices
and energy transformation processes
Key Assumptions: user-defined independent
variables (demographic, macroeconomic, etc.)
Fuels (energy carriers)
Effects: environmental loadings (e.g., emissions)
22. Modeling methods: two levels
• Basic, non-controversial physical accounting calculations are
handled internally within LEAP (e.g., energy, equipment stocks,
natural resources, costs, pollutants)
• Users can specify additional modeling through LEAP
expressions and other options
23. Expressions
• Similar to formulas in spreadsheets
• Used to specify values of variables
• All expressions define a time series of
values: can be a constant in all years (a
simple numerical expression) or a formula that
yields different results in each year
• Can use many built-in functions and refer
to values of other variables
• Can be linked to Excel spreadsheets
• Can be inherited across scenarios and
regions
24. Expressions: some examples
• Simple number
• A constant value in all scenario years
• Simple formula
• Example: “0.1 * 5970”
• Calculates a constant value in all scenario years
• Growth rate
• Example: “Growth(3.2%)”
• Calculates exponential growth over time
• Interpolation
• Example: “Interp(2000, 40, 2010, 65, 2020, 80)”
• Performs linear interpolation between values
• Step function
• Example: “Step(2000, 300, 2005, 500, 2020, 700)”
• Calculates discrete changes in particular years
• GrowthAs
• Example: “GrowthAs(Income,elasticity)”
• Causes variable to grow at same rate as another variable, subject to an elasticity
25. Expressions: ways to edit
In Analysis view…
• Type to directly edit an expression
• Use Expression builder to make an
expression by dragging and dropping
functions and variables
• Choose Function Wizard for help
selecting a built-in function
• Use Time-Series Wizard to enter time-
series functions and data (Interp, Step,
etc.)
• There are also multiple ways to import
and export data from/to Excel
26. Scenario analysis
The future is unknown…
…but we can explore it using scenarios
Scenario: An internally coherent, physically plausible storyline that describes a possible
state of the world. Scenarios are represented in LEAP by exogenous inputs (data and
assumptions), calculation methods, and results produced from the inputs and methods.
• LEAP recognizes two types of scenarios
• Current Accounts – historical data
• Future projections – baseline, policies, mitigation
measures, etc.
27. Scenario inheritance
A scenario can inherit expressions
and data from multiple other
scenarios
Parent scenario: the default source of
expressions and data for projection years
Other scenarios from which to
inherit. The order matters!
LEAP follows this order when
searching for expressions
and data to inherit.
Expressions are color-coded in the Analysis view. Blue =
defined in the scenario, black = inherited from another
scenario, green = inherited from another region.
For a projection scenario, the last
scenario in the inheritance chain is
always Current Accounts.
28. Scenario reporting
• LEAP provides powerful features for
analyzing and comparing scenario
results
• Differences between scenarios
• Amounts avoided in a scenario
• Scenarios as series in charts and tables
29. LEAP glossary
• A LEAP model or the system being modeled. Areas may be
divided into multiple geographic regions.
Area
• The first year in a model.
Base year
• The last year in a model.
End year
• A consistent set of model inputs and results corresponding to a
possible state of the world. Models can contain multiple
scenarios.
Scenario
• A special scenario containing historical data. Every model
includes Current Accounts.
Current Accounts
• The year following the last year in Current Accounts. The first year in
projection scenarios.
First scenario year
• A hierarchical data structure that organizes a model’s inputs and
results.
Tree
• An item in the tree: categories, technologies, modules, processes, key
assumptions, etc.
Branch
• An input variable for a model, contained in a branch. Branches may
have multiple variables, which are shown in tabs on screen.
Variable
• A formula that specifies time-series values of a variable for a given
branch, scenario, and region.
Expression
30. LEAP is not…
• A system dynamics model
• A general equilibrium model
• A macroeconomic model
• An agent-based model
• An electricity system production cost model
• An electricity system network reliability (AC power flow)
model
31. Example LEAP applications
Sixth ASEAN Energy Outlook
• Regional LEAP model with national detail
• Energy demand, energy supply, and
emissions
• Bottom-up modeling of key demand and
supply sectors
• Simulation of national plans and policies,
regional targets including SDG 7
attainment
32. Example LEAP applications
Integrated resource and resilience
planning in Lao PDR
• Highly resolved LEAP/NEMO model of
national electricity system
• Nodal simulation of electricity grid and
power flow
• Applied in large scenario ensemble analysis
for robust decision making
33. LEAP license for this workshop
• User name: SEI Asia LEAP Training
• Password: 897-735-038-898-864
• Software expires: 1 November 2021 (after this date, saving
changes to data will be disabled)
36. Demand modeling overview
• LEAP supports modeling all energy consumption and
associated costs and emissions in an area
• Final energy demands in Demand branch (focus of this lecture and first
exercise)
• Intermediate energy demands in Transformation branch (supply side
of model)
• Significant flexibility in representing final energy demands in
model
• Level of disaggregation
• Technology specification (equipment or devices that consume energy)
• Projection methods
38. Disaggregation: bottom-up / end-use
• Detailed accounting of sectors, subsectors, end-uses,
and devices that consume energy
- Provides a more fundamental
understanding of why energy is
used in an economy: probably
best approach for thinking
about long-term transitions
- Captures impacts of
structural shifts and from
technology-based policies such
as energy efficiency
- Data-intensive
- Reliant on expertise of
analyst for many trends and
assumptions
- Hard to capture impacts of
fiscal policies (e.g., carbon tax)
39. Disaggregation: top-down
• A more aggregate approach often with energy consumption broken
down only by sector and fuel
• Consumption often forecast into future using simple historical trends or
aggregate econometric relationships (GDP, fuel prices, etc.)
• Generally relies on good historical time-series data
- Lends itself to capturing
impacts of fiscal policies
(e.g., carbon tax)
- Less data-intensive
- Hard to account for inertia
due to technology /
equipment investments
- Provides little insight into
physical bases of demand
- Not well-suited for
examining technology-
based policies
40. Disaggregation: hybrid / decoupled
• Baseline scenario forecast using top-down approach
• Bottom-up policy measures modeled in alternative
scenarios
• In LEAP, policy measures are entered as negative “wedges”
of consumption: subtracted from baseline energy use in
each sector
- Less data-intensive than
end-use approach, but
able to capture
technology-based policies
- Not a full end-use
model, so does not give
insights into how energy
system structure might
change in long-run
- Limited to situations
where measures are small
relative to baseline
41. Technology specification
• Final energy consumption in LEAP occurs in special branches called
“technologies”
• Four types of technologies are available
• Technology with Energy Intensity
• LEAP provides Activity Level and Energy Intensity variables for technology
• Product of activity and energy intensity is energy consumption
• Technology with Total Energy
• LEAP provides Total Energy variable for technology – its value is energy
consumption
• Transport Technology
• LEAP provides several variables for vehicle stock turnover modeling –
starting stock, sales, average distance traveled, fuel economy, and more
• Energy consumption is based on number and age of vehicles, distance
traveled, and fuel economy
• Other Technology
• LEAP provides several variables for stock turnover modeling of other (non-
vehicle) devices – starting stock, sales, energy use per device, and more
• Energy consumption is based on number of devices and energy use per
device
42. Technology specification
• A variant of Technology with Energy Intensity modeling
allows energy intensity and activity to be specified for
a category containing technologies rather than the
technologies themselves => Category with Energy
Intensity
• Energy demand is then calculated at category level as
activity x energy intensity
• Technologies in category meet shares of category-level
demand – using Fuel Share variable
• Category with Energy Intensity approach also supports
modeling useful energy demand
43. Final energy vs. useful energy
• Final energy is energy used by final consumers’ devices
• Useful energy is energy available after energetic conversions by those
devices – i.e., energy delivered to end-use
Example – a stove
• Final energy = gas consumed (J)
• Useful energy = heat transmitted to food (J)
𝑓𝑖𝑛𝑎𝑙 𝑒𝑛𝑒𝑟𝑔𝑦 × 𝑒𝑓𝑓𝑖𝑐𝑖𝑒𝑛𝑐𝑦 = 𝑢𝑠𝑒𝑓𝑢𝑙 𝑒𝑛𝑒𝑟𝑔𝑦
44. Projection methods
• Within a given branch structure – with a selected level of disaggregation and technology
specification – various methods can be used to project changes in demand
• Common choices include:
• Activity analysis
• Econometric modeling
• Consumer choice modeling
• Expressions can link variables (and custom user variables can be added), allowing a wide
variety of projection formulas
• On the horizon: optimization of final energy demands given useful energy requirements
(targeting release in 2022)
45. Activity analysis
• Most common projection method in LEAP models
• Defines energy demand as product of activity and energy intensity
(energy consumption per unit of activity)
• Can be used to calculate final energy demand or useful energy demand
• Enabled by Technologies and Categories with Energy Intensity
• If Demand branch is disaggregated, LEAP provides Activity Level
variables at each level of tree => activity at bottom of tree is product
of Activity Levels in hierarchy
46. Activity analysis example
Households
(8 million)
Cooking
(100%)
Refrigeration
(95%)
Lighting
(100%)
Existing (100%, 400 kWh/yr)
Urban
(30%)
Rural
(70%)
Efficient (0%, 120 kWh/yr)
Other Uses
(100%)
Electrified
(100%)
Electrified
(20%)
Non-Electrified
(80%)
Energy consumption =
8M households
x 30% urban
x 100% electrified
x 100% with lighting
x 100% with existing technology
x 400 kWh/year
= 960 GWh/year
47. Activity analysis and stock turnover
• Stock turnover modeling – with Transport and Other Technologies –
can be thought of as a form of activity analysis
• Number of vehicles or devices is activity
• Fuel economy or energy use per device is energy intensity
• Key difference is vehicle/device vintages are tracked
48. Econometric modeling
• Energy demand or intermediate variables (e.g., activity level, energy
intensity) are calculated using expressions representing an econometric
model
• Parameters for model are typically estimated outside of LEAP
• Facilitated by Technologies with Total Energy
Example: ln 𝑒𝑡 = 𝛼 + 𝛽 ln 𝑝𝑡 + 𝛾 ln 𝑖𝑡 + 𝜆 ln 𝑒𝑡−1 + 𝛿𝑡
t is year, e is total final energy demand, p is fuel price, i is income, β is price elasticity of demand, γ is income
elasticity of demand, α is a constant
49. Consumer choice modeling
• Equipment purchase decisions are simulated with a multinomial logit
model
Sales share =
𝑒
𝑉𝑗
σ𝑖=1
𝐽
𝑒𝑉𝑖
j is type of equipment, V is a linear function describing consumer utility for type of equipment
• Generally used with stock turnover technology specification (which has
an explicit sales variable)
50. Projection methods: overall points
• Methods can be mixed in Demand branch
• Some branch structures and technology specifications lend themselves to
particular projection methods
• Example: bottom-up disaggregation with Technologies with Energy Intensity =>
activity analysis
• However, this correspondence isn’t rigid – other methods can be
introduced
• Example: econometric methods used to project Activity Level and Energy
Intensity for Technologies with Energy Intensity
• Scenario analysis involves describing how each variable in tree changes over
time
51. Expressions and time series data
An expression in LEAP defines a value for a branch,
variable, and region in each year of a scenario
• 100 => constant value in all years
• Interp(2010, 0, 2040, 100) => linear
interpolation between specified points
• Step(2010, 0, 2020, 25, 2040, 100) => step-
wise interpolation between specified points
• Data(2020, 25, 2040, 100) => specified points
only (0 in all other years)
52. Expressions and time series data
An expression in LEAP defines a value
for a variable and region in each year of a scenario
• 100 => constant value in all years
• Interp(2010, 0, 2040, 100) => linear
interpolation between specified points
• Step(2010, 0, 2020, 25, 2040, 100) => step-
wise interpolation between specified points
• Data(2020, 25, 2040, 100) => specified points
only (0 in all other years)
Scenario years
• Current Accounts: base year to last historical year (first scenario year - 1)
• Projection scenarios: first scenario year to end year
Current Accounts expressions are inherited in projection scenarios by default!
53. Air Conditioning Fog Lamps
Power Windows
Percentages in LEAP
Cars Trucks Motorcycles
54. Percentages in LEAP
Air Conditioning Fog Lamps
Cars Trucks Motorcycles
These are exclusive characteristics….
…these are non-exclusive characteristics,
which can overlap.
55. Percentages in LEAP
• LEAP unit for exclusive percentages:
Share
• Must sum to 100% across neighboring
branches
• LEAP unit for non-exclusive percentages:
Saturation
• Need not sum to 100% across
neighboring branches
58. Freedonia
1.1. Overview of
Freedonia
1.2. Settings 1.3. Demand
1.3.1. Data structures
1.3.2. Current Accounts
1.3.3. Viewing Results
1.3.4. Reference Scenario
1.4. Transformation
1.4.1. Transmission and
Distribution
1.4.2. Electricity
Generation
1.4.3. Viewing Results
1.5 Emissions
1.5.1. Viewing Results
1.6. A Second
Scenario: Demand-
Side Management
1.6.1. DSM Scenario
Results
Exercise 1
59. Sketch the data structure
Keep in mind:
- There is not a single answer
- Be guided by data and assumptions
- Go from general to specific:
- Sector > subsector > end use > technology/device > fuel
60. Sketch - Urban households
Sector
Sub-sector
Electrification
End-use
Fuel
Household
Urban
Electrified
Cooking
Electricity Natural Gas
Lighting
Electricity
Refrigeration
Electricity
Other electric
appliances
Electricity
Rural
62. Saving and sharing models
LEAP Areas Repository
…DocumentsLEAP Areas
One folder with multiple
files per area
.LEAP file
One zipped file per area
Backup
Install
Installing an area from a .LEAP file overwrites
what’s in local LEAP areas repository
Be careful, you can lose work!