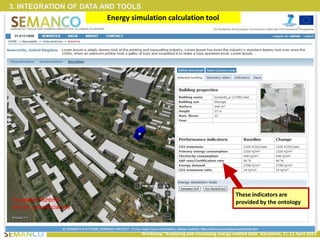
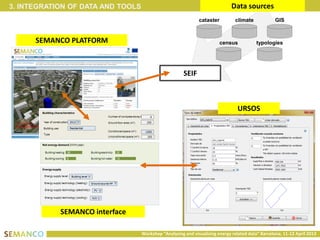
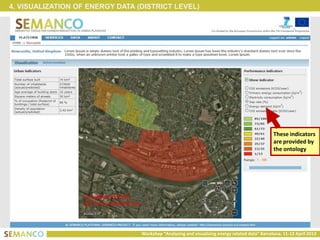
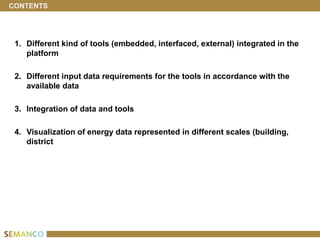
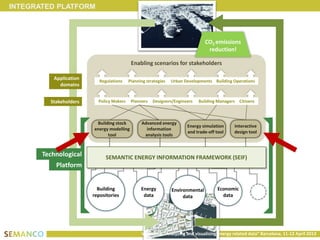
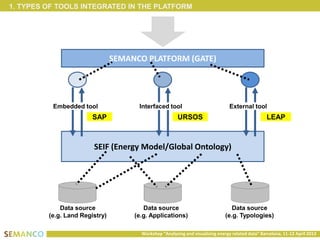
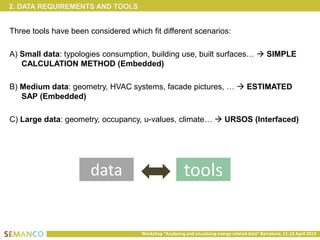
The document discusses the SEMANCO platform for visualizing and analyzing energy-related data, detailing the types of tools integrated, such as embedded, interfaced, and external tools, and their varying data requirements. It emphasizes the integration of diverse data sources and visualization at both building and district levels, facilitated by a shared semantic framework. The workshop, held in Barcelona in April 2013, aims to showcase methods for reducing CO2 emissions and improving energy performance through technology and data integration.
![3. INTEGRATION OF DATA AND TOOLS
cataster GIS climate census typologies
…DATA
[open, proprietary,
multiple domains]
SEIF SHARED VOCABULARY
[to kink data and tools]
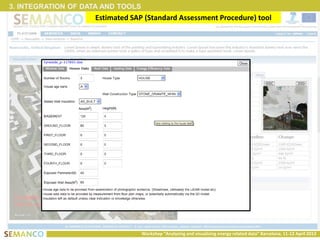
SIMPLE METHODS Estimated SAP URSOS TOOLS
[to query data
using
ontologies]
BASELINE
Energy performance of the city
as it is calculated with tools
INTERVENTIONS
Energy performance of
new plans and scenarios
Workshop “Analysing and visualising energy related data” Barcelona, 11-12 April 2013](https://image.slidesharecdn.com/semancoworkshoptheme2semanco-130423093501-phpapp01/85/Semanco-workshop-Theme2-Semanco-6-320.jpg)