Download as PDF, PPTX


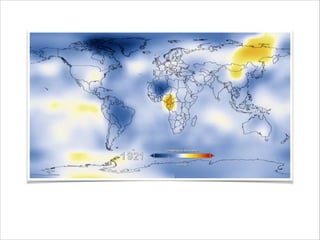
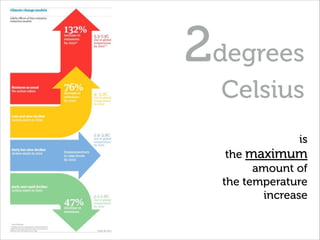
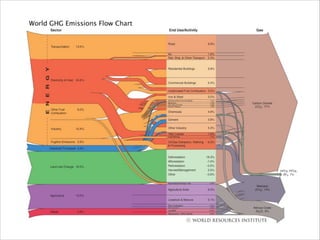
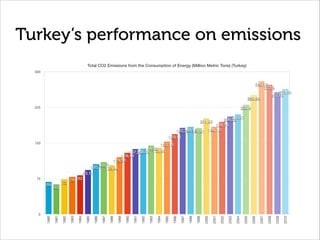


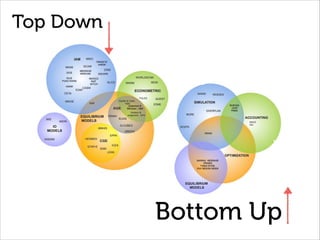
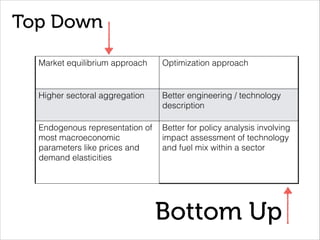
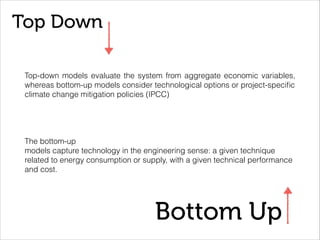
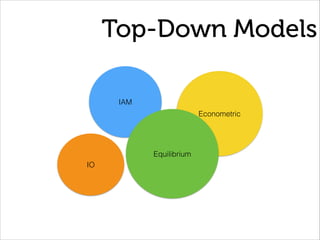
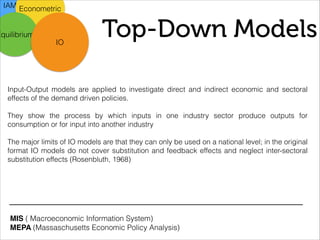
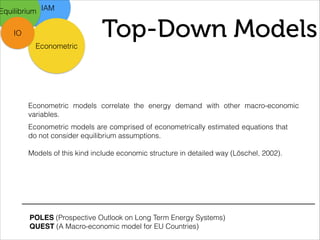
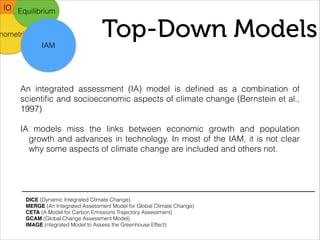
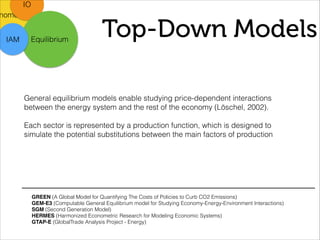

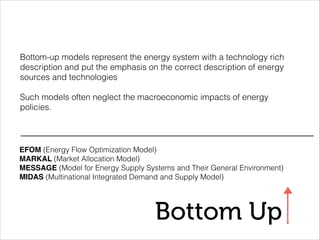
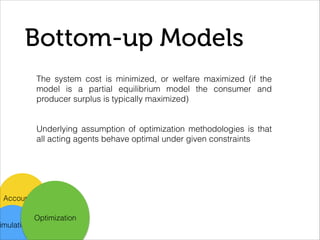
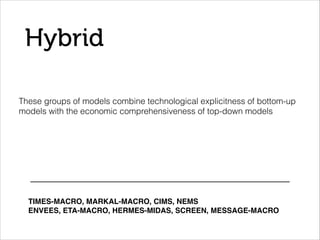


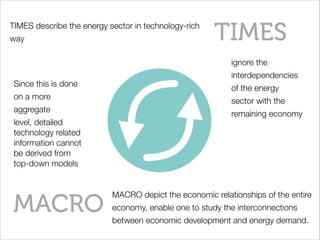
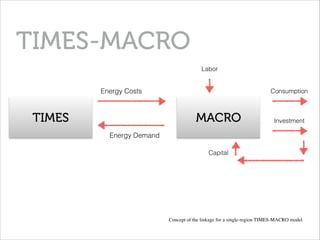


This document outlines a proposal for a thesis project to conduct integrated large-scale modeling and analysis of the Turkish energy system. It begins by explaining that keeping global temperature increases below 2 degrees Celsius is important to avoid worst impacts of climate change. It then provides background on Turkey's growing carbon emissions over time. The remainder of the document discusses different modeling approaches researchers have used, including top-down macroeconomic models and bottom-up engineering models, as well as hybrid approaches. It provides examples of specific models and explains how models like TIMES and TIMES-MACRO work to minimize energy system costs while meeting demand and policy constraints. The goal of the proposal is to use an integrated modeling framework to analyze Turkey's energy system and policy options