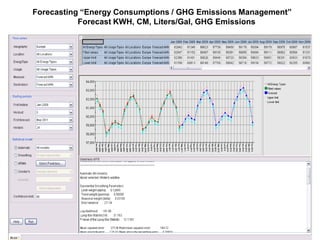
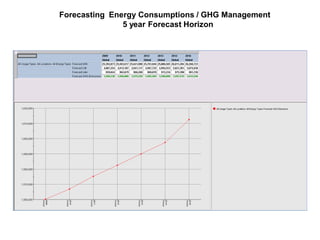
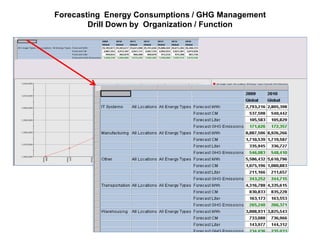
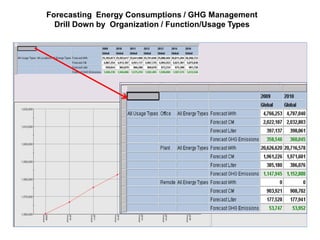
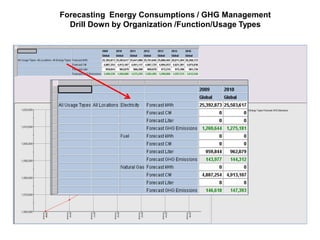
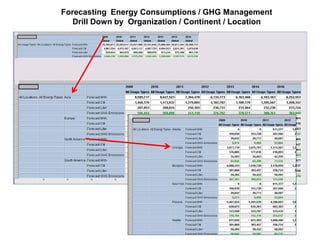
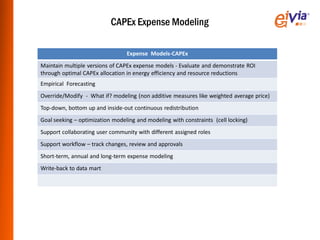
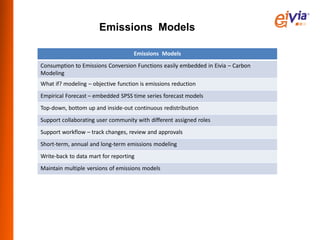
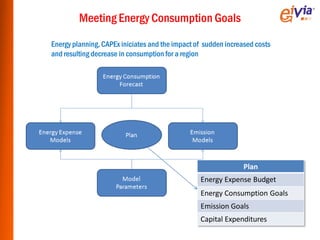
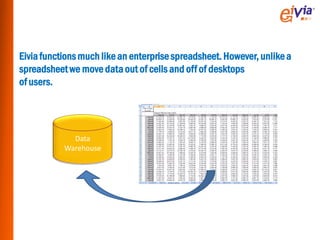
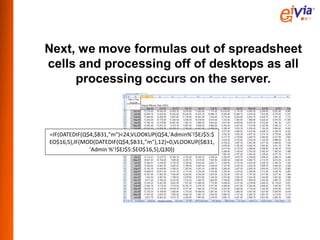
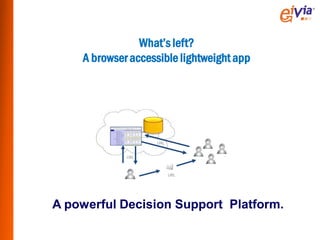
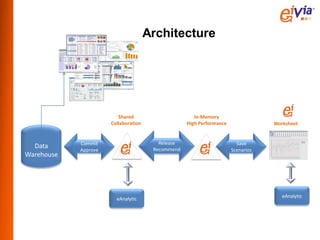
eiVia provides forecasting, planning, and financial modeling software to help organizations manage energy consumption, costs, and carbon footprints. The software uses empirical and causal forecasting, goal seeking, and optimization modeling to create baseline forecasts and model the impact of capital expenditure plans. It allows for drilling down across different dimensions like organization, location, and usage type. This enables collaborative scenario modeling and optimization of energy efficiency initiatives.
Business Intelligence (BI) solutions can help manufacturing business users to analyse cost factors and make appropriate decisions for acquisition of raw material and sold goods.
Business Intelligence (BI) for ManufacturingDhiren Gala
Business Intelligence (BI) for Manufacturing - Plastics are no different
BI is very effective for all types of manufacturing, be it process, discrete or automatic. BI can close the ‘fact gap’ by improving the availability and delivery of actionable data with minimal IT
involvement.
Building a business intelligence architecture fit for the 21st century by Jon...Mark Tapley
Objectives of the presentation:
To record some history –what has happened in the past that makes the future quite challenging.
To provide real examples of BI at work –good and bad.
To illustrate the nature of data and why it has become so important in driving forward
the business in the 21stcentury.
To outline a way to align technology with the business so that efforts and budget are spent
in a way that will enable the future rather that support the past.
To propose a set of principles and ideas that can guide a company in a way to make data available to all who have the penchant to turn it into useful and valuable information.
To describe the new organisation unit that will be needed to realise the dream.
Areas Of It Complexity PowerPoint Presentation SlidesSlideTeam
Enhance your audiences knowledge with this well researched complete deck. Showcase all the important features of the deck with perfect visuals. This deck comprises of total of thirty two slides with each slide explained in detail. Each template comprises of professional diagrams and layouts. Our professional PowerPoint experts have also included icons, graphs and charts for your convenience. All you have to do is DOWNLOAD the deck. Make changes as per the requirement. Yes, these PPT slides are completely customizable. Edit the colour, text and font size. Add or delete the content from the slide. And leave your audience awestruck with the professionally designed Areas Of It Complexity PowerPoint Presentation Slides complete deck.
Keynote Address given by Paul Strassman, former Director of Defense Information and current Distinguished Professor of Information Science at George Mason University, at Transformation and Innovation 2007.
Application Management Service OfferingsGss America
GSS America extends support for Application Development and Maintenance initiatives and helps customers focus on their strategic priorities. The cost effective AMS solutions from GSS ensures that customers achieve significant savings on running their business operations, so that they can channel these savings towards new product development initiatives that contribute to additional revenue generation.
Adaptive insights forrester and boston scientific webinar_finalAdaptive Insights
Paul Hamerman, VP & Principal Analyst for Forrester Research, explains how modern enterprises can leverage new finance technology in this FP&A Power Hour Presentation
Smart Grid Operational Services: Selecting the Right Mobile SolutionCapgemini
Whether you manage field service operations within the utilities industry or some other large business operation, a mobile computing solution can strengthen your field service capabilities, lower your operating costs and improve customer service.
With mobile devices in hand, field technicians, engineers and supervisors alike discover that information flow increases and costly data entry errors become issues from the past.
The mobile computing market abounds with “cool” devices, but embracing innovative technology alone can easily distract an organization from finding an intelligent mobile solution that will ultimately meet the needs of its users.
In other words, preparing for the technology is every bit as critical as selecting it.
This paper describes the 3 stages recommended for deciding on, and ranking the importance of, available solution options, and how proper planning can improve the total cost of ownership (TCO) of the solution. It also reviews common obstacles that impede deployment and thwart a positive return on investment.
AHS12 Robb Wolf, BS — City Zero: How Markets and Evolution Can Revolutionize ...Ancestral Health Society
Robb Wolf, B.S. presenting at the Ancestral Health Symposium 2012 (AHS12)
City Zero: How Markets and Evolution Can Revolutionize Medicine
Abstract:
An investigation of how markets influence medical innovation and a case history of how the Ancestral Health model has been implemented at the city level.
Bio:
Robb Wolf, a former research biochemist, is the New York Times Best Selling author of The Paleo Solution: The Original Human Diet.
Robb has functioned as a review editor for the Journal of Nutrition and Metabolism, is co-founder of the nutrition and athletic training journal, The Performance Menu, and co-owner of NorCal Strength & Conditioning, one of the Men's Health Top 30 Gyms in America.
We describe the features of Oak Lucene indexes and how they can be used to get your queries perform better. In the second part we will talk about how asynchronous indexing works in general and how it can be monitored.
This was presented as part of AEM Gem Series -http://dev.day.com/content/ddc/en/gems/oak-lucene-indexes.html
Many projects experience failures that result in poor project delivery performance or process capacity/reliability degradations after commissioning
Many studies have shown that 60% to 95% of equipment life cycle costs (TLCC) are a result of decisions made (in CAPEX) prior to handover/start-up and transfer to owners (maintenance or operations) in OPEX
Wouldn’t it make common sense to manage the risk of CAPEX project failures in advance and address equipment life cycle decisions in (CAPEX) rather than after commission handover phase (OPEX)?
Shouldn't owners "invest" in project success "insurance" to help ensure that these multi-billion dollar projects are delivered as they were intended?
The Energy Management Application enables plant personnel to monitor real-time energy flow and automatically notifies operators, supervisors and cost accountants of energy inefficiencies and non-compliance of configured policies. Application functionality includes recording consumption and demand at main and sub-meters for a wide range of energy types, including power, water, chill, gas, air and steam. For more information, please go through the slide.
iARMS-EMS/PMS is developed by Envision Enterprise Solutions
Envision Enterprise Solutions is one of the fast growing global technology and innovation companies offering services in IT consulting, software implementation, system integration and development, with presence in USA, UAE, Singapore and India. Envision has solutions portfolio that range from Enterprise Asset Management, Port Automation Solutions, ERP Solutions, Application Services, Enterprise Mobility Solutions, Cloud Solutions, Performance Optimization and Real Time Monitoring Solutions. Envision is partnered with leading technology giants like IBM, SAP, Oracle and Microsoft.
For many organizations, a move to Azure creates issues with managing costs and resource ownership. Why? Cloud-based technologies rely on a different cost model - one based on usage consumption, rather than purchasing hardware and software.
In this presentation we cover how to:
- Build an Azure cost model based on best practices
- Use chargebacks to assign and track IT usage to specific business units
- Avoid unexpected consumption expenses by seeing what you’re consuming, and who's consuming it
The Science of Predictive Maintenance: IBM's Predictive Analytics SolutionSenturus
Overview of IBM’s Predictive Maintenance and Quality (PMQ) solution. View the webinar video recording and download this deck: http://www.senturus.com/resources/science-predictive-maintenance/.
We show you the PMQ solution can keep manufacturing processes, infrastructure and field equipment running to maximize use and performance, while minimizing costs.
We show how you can use powerful analytics and data integration to help: Anticipate asset maintenance and product quality problems, Reduce unscheduled asset downtime, Spend less time solving production machinery and field asset problems, Improve asset productivity and process quality, Monitor how assets are performing in real-time and predict what will happen next.
Senturus, a business analytics consulting firm, has a resource library with hundreds of free recorded webinars, trainings, demos and unbiased product reviews. Take a look and share them with your colleagues and friends: http://www.senturus.com/resources/.
Transpara Visual KPI Overview - March 2017Transpara
Visual KPI from Transpara is software the provides a single real-time view of operations across all of your data sources and on any device. https://www.transpara.com
Is your big data journey stalling? Take the Leap with Capgemini and ClouderaCloudera, Inc.
Transitioning to a Big Data architecture is a big step; and the complexity of moving existing analytical services onto modern platforms like Cloudera, can seem overwhelming.
There are hundreds of branch locations for even a medium size bank, the cumulative annual energy spend across the branches runs into millions of dollars and can add up to 40%-80% of the overall bank consumption across branches and offices. This PDF describes the ways in which banks have taken significant steps to address energy consumption in large offices.
Wipro Ecoenergy – Making Energy Work for BanksNidhi Vora
To meet the energy management challenges of bank branches, Wipro EcoEnergy offers Managed Energy Services engagement, wherein Wipro takes ownership of identifying savings opportunities, developing the best-_t custom solution, deploying the solution and then delivering time bound savings over a 5-7 year period.
There are hundreds of branch locations for even a medium size bank, the cumulative annual energy spend across the branches runs into millions of dollars and can add up to 40%-80% of the overall bank consumption across branches and offices. This PDF describes the ways in which banks have taken signi¬ficant steps to address energy consumption in large offices
There are hundreds of branch locations for even a medium size bank, the cumulative annual energy spend across the branches runs into millions of dollars and can add up to 40%-80% of the overall bank consumption across branches and offices. This PDF describes the ways in which banks have taken significant steps to address energy consumption in large offices.
To meet the energy management challenges of bank branches, Wipro EcoEnergy offers Managed Energy Services engagement, wherein Wipro takes ownership of identifying savings opportunities, developing the best custom solution, deploying the solution and then delivering time bound savings over a 5-7 year period.
There are hundreds of branch locations for even a medium size bank, the cumulative annual energy spend across the branches runs into millions of dollars and can add up to 40%-80% of the overall bank consumption across branches and offices. This PDF describes the ways in which banks have taken signi¬ficant steps to address energy consumption in large offices.
Enterprises looking to modernize the data warehouse have been facing the dilemma of choosing between migration of legacy systems and total re-engineering. While migrating the systems as is is not the best transformation choice for all workloads, total re-engineering can be complex and disrupt business processes.
An EDW transformation approach that maintains a balance between the two extreme approaches is required to solve this problem. You will have full control in addressing low-performing or costly, resource-constrained workloads, while also building a strong foundation for a modern data warehouse architecture that supports sophisticated analytics using a cloud/hybrid/on-premises strategy.
In this webinar, experts from Impetus will walk you through a path to solve this dilemma. Attendees of this session will be able to:
Arrive at a pragmatic decision when faced with the dilemma
Learn methods to estimate and measure the bottom-line impact across applications and reporting workloads
Build a prioritized transformation roadmap of use cases based on cost, performance, and business needs
Understand how automation can be used to optimize workloads for a scalable and iterative architecture.
To view the webinar visit - https://bit.ly/31KWqO6
This Workshop Teaches Business Leaders How To Implement AI Technologies To Serve Customers Better Than Anybody Else.
AGENDA
Introduction to Artificial Intelligence
Extracting Value & Delivering Value
Predictive & Preventive maintenance
Marine market, Jet engines
How to prepare & implement AI Playbook
Similar to Carbon Management Market EiVia Overview (20)
1. eiVia
Energy Consumption Management – Forecasting,
Planning, Financial Modeling - CAPEx Planning /
Execution, Optimization, & Carbon Footprint
Performance Impact Analysis
Presented by
John C. Kesseg
VP of Sales
eiVia, Inc.
703-408-1534
Confidential Proprietary Information
2. Business Intelligence Dashboards have their limitations. Events
happen rapidly and unexpectedly it is being able to anticipate events
or react and mitigate around an event that distinguishes top
performers. Arguably, even real time data is not fast enough….we
need more time to formulate our response to changing events. We
now need continuous and very accurate forecasts. We need the ability
to model the impact of forecasts and response scenarios . Today,
decision makers are overwhelmed with news and data, but navigating
between events and Business Intelligence is a challenge.
“I was watching my dashboard, I don’t
know how this could have happened ! “
3. NUMBERS
Business Intelligence
Event Intelligence
NEWS
• Real time data is not fast enough
• Need continuous accurate forecasts
• Need real time financial modeling
• Collaboration for effective rapid respond
5. eiVia – meeting the forecasting & financial modeling
challenges in the Environmental Energy Management Market
•Within Environment and Energy Management Market - the biggest challenge is
forecasting long term energy consumption, cost and GHG emissions at both the
top line and granular levels.
•The data dimensions usually include time, energy type, source, use, and
location
•Organizations need to create a baseline forecast. If we do nothing, what does
the future look like?
•They then need to model and Optimize CAPEx spending on energy Cleantech
initiatives to take advantage of subsidies and rebates, lowering their operating
costs and financing capital expenditures.
•eiVia’s multidimensional and hierarchical forecasting and modeling provides
these capabilities in one toolset.
•eiVia can add competitive advantage to your Energy & Environmental
Management solution set.
6. eiVia’s Competitive Value Add for EEM
Areas of Impact:
• manage an organizations sustainability footprint.
• Set and meet sustainability goals
• Decision support around CAPEx asset investment.
Type of impact:
• Statistically baseline measures of energy (usage & cost), carbon emissions,
water usage, and waste streams.
• Empirically forecast measures of usage in time series
• Model across measures for mitigation of market place changes.
• Model within a measure’s higherarchal structure for optimization.
• Model for optimization across measure and against goals by constraining any
measure at any level in the higherarchy.
• Write back optimization and mitigation models to the data warehouse for
reporting.
7. eiVia’s capabilities in the Environmental
and Energy Management Markets
Energy Consumption Forecast - Modeling
Empirical Forecasting:
Trend, seasonality and cyclical forecasting
Causal forecasting
Override / Modify (User-changes of forecasted values)
Data Entry
Data Values - Empty data fields
Model inputs – Causal forecasting
Short-term, annual, and long-term forecasting on energy consumption, cost and GHG
emissions at both the topline and granular levels . Top-down, bottom up and inside-out
continuous redistribution
Goal seeking (cell locking) and modeling with constraints
Support collaborating user community with different assigned roles
Support workflow – track changes, review and approvals
Write-back to data mart
Maintain multiple versions of forecasts
14. CAPEx Expense Modeling
Expense Models-CAPEx
Maintain multiple versions of CAPEx expense models - Evaluate and demonstrate ROI
through optimal CAPEx allocation in energy efficiency and resource reductions
Empirical Forecasting
Override/Modify - What if? modeling (non additive measures like weighted average price)
Top-down, bottom up and inside-out continuous redistribution
Goal seeking – optimization modeling and modeling with constraints (cell locking)
Support collaborating user community with different assigned roles
Support workflow – track changes, review and approvals
Short-term, annual and long-term expense modeling
Write-back to data mart
15. Emissions Models
Emissions Models
Consumption to Emissions Conversion Functions easily embedded in Eivia – Carbon
Modeling
What if? modeling – objective function is emissions reduction
Empirical Forecast – embedded SPSS time series forecast models
Top-down, bottom up and inside-out continuous redistribution
Support collaborating user community with different assigned roles
Support workflow – track changes, review and approvals
Short-term, annual and long-term emissions modeling
Write-back to data mart for reporting
Maintain multiple versions of emissions models
16. Meeting Energy Consumption Goals
Energy planning, CAPEx iniciates and the impact of sudden increased costs
and resulting decrease in consumption for a region
Plan
Energy Expense Budget
Energy Consumption Goals
Emission Goals
Capital Expenditures
17. The hierarchical and cross-dimensional impact of one change
=
Reduce
Energy
Consumption
18. Global monitoring of consumption implies complex hierarchical
Modeling at a global, regional, local, and device level. Eivia capability
will allow for modeling at any level and make changes at all related
points in the higherarchy: Top down, bottom up or inside and outside.
19. Indirect Changes
Eivia also models across measures as a change at any level not only impacts
within a measures higherarchy, but every function related to the impacted
measure.
Emissions Expense Consumption
20. About Eivia
• Deep roots in Business Intelligence & Data Warehousing as Eivia represents
the 2nd generation tool from the management and development team of
Information Advantage
• Over $20 million invested in development of technology, to-date.
• Large commercial users: Pepsi, Cargill, and Johnson & Johnson.
• Go to market strategy is to provide the Eivia engine to SAAS Providers to
deliver decision support for their user community.
21. Eivia functions much like an enterprise spreadsheet. However, unlike a
spreadsheet we move data out of cells and off of desktops
of users.
Data
Warehouse
22. Next, we move formulas out of spreadsheet
cells and processing off of desktops as all
processing occurs on the server.
=IF(DATEDIF(Q$4,$B31,"m")<24,VLOOKUP(Q$4,'Admin%'!$EJ$5:$
EO$16,5),IF(MOD(DATEDIF(Q$4,$B31,"m"),12)=0,VLOOKUP($B31,
'Admin %'!$EJ$5:$EO$16,5),Q30))
23. What’s left?
A browser accessible lightweight app
URL
URL
URL
A powerful Decision Support Platform.
24. Architecture
Shared In-Memory
Collaboration High Performance Worksheet
Commit Release Save
Data Approve Recommend Scenarios
Warehouse
eAnalytic
eAnalytic
25. Eivia Benefits Summary
• Familiar User Interface - Facilitates Rapid Adoption
• Web based application
Ready for the sweeping business changes associated
with tablet computing
Zero Footprint
Information Assurance & security - Conforms to
Enterprise Data Governance Best Practices
• Empirical Forecasting
• Complex Data Modeling Planning, and Forecasting
Multidimensional Database Navigation – model
impact what if analysis on CAPEx initiatives
• E-Analytic allows for easy integration with complex
business rules and functions